© International Epidemiological Association 1993 Printed in Great Britain
Mortality Patterns and Trends
for Lung Cancer and Other
Tobacco-Related Cancers in the Americas,
1955-1989
PAOLO BOFFETTA,* CARLO LA VECCHIA," * FABIO LEVI##•* AND FRANCA LUCCHINI" •* Boffetta P (International Agency for Research on Cancer, 150 cours Albert-Thomas, 69372 Lyon cedex 08, France), La Vecchia C, Levi F and Lucchini F. Mortality patterns and trends for lung cancer and other tobacco-related cancers in the Americas, 1955-1989. International Journal of Epidemiology 1993; 22: 377-384.
Mortality from cancers of the oral cavity and pharynx, oesphagus, larynx and lung between 1955 and 1989 has been analysed for USA, Canada and 14 countries in Latin America. Among males, Uruguay, Cuba, Argentina and Puerto Rico have the highest rates for all sites, and Peru, Ecuador, Dominican Republic, Mexico and Colombia have the lowest rates. Among females, Cuba, Colombia and Puerto Rico rank high for all sites, and Mexico, Paraguay, Ecuador and Peru rank low. For both sexes, lung cancer mortality rates from the US and Canada are high, whereas rates from other sites are intermediate. An increasing trend in lung cancer mortality over time is shown in all countries except Cuba (no changes), Argentina, Paraguay and Peru (decreasing trend). In Latin America, the tobacco-related lung cancer epidemic is in its early phase among males, and very early phase among females.
Consumption of tobacco and its health effects have been widely investigated in the US and Canada: on the other hand, little is known about smoking-related diseases in Central and South American countries. In particular, little information is available on the occur-rence of tobacco-related cancers.1 This study has been carried out to investigate how routine mortality data can be used to estimate the importance of tobacco-related cancers in developed as well as developing American countries. Cancers of the lung and of the upper respiratory and digestive tract have been con-sidered. Lung cancer has been given specific attention because it is the single most important tobacco-related disease not appreciably influenced by alcohol or mate drinking or other major lifestyle risk factors, and a major cause of illness and premature death as well as of health-related costs. In addition lung cancer mor-tality is close to incidence because of poor survival • International Agency for Research on Cancer, 150 cours Albert-Thomas, 69372 Lyon cedex 08, France.
• • Institut universitaire de medecine sociale et preventive, Bugnon 17, 1005 Lausanne, Switzerland.
t Istituto de Ricerche Farmacologiche 'Mario Negri', Via Eritrea 62, 20157 Milano, Italy.
' Registre viudois des tumeurs, Institut universitaire de medicine sociale et preventive, Centre Hospitaller Universitaire Vaudois, Falaises 1, 1011 Lausanne, Switzerland.
rates, and the seriousness of the disease makes the diagnosis more reliable than for other conditions, especially in the 35-64 age group.
MATERIALS AND METHODS
Death certification figures for cancers of the oral cavity and pharynx (International Classification of Diseases, ICD—9, 140-148), oesophagus (ICD—9, 150), larynx (ICD—9, 161) and lung (ICD—9, 162), stratified for sex and 5-year age groups for selected American countries were derived from the World Health Organization database, March 1991 version. During the period considered (1955-1989), four dif-ferent revisions of the International Classification of Diseases were used in the different countries.2 Conver-sion programmes were used to obtain consistent figures across the different revisions.
The WHO database also contains sex- and age-specific estimates of the resident population, based on official censuses. For each calendar year, and for each quinquennium, sex-specific age-standardized mortality rates were calculated using the weights of the World standard population.3 Truncated rates for the 35-64 year age group were also calculated.
The WHO database contains some data on mortality or population for 49 American countries or territories. 377
Excluded were all areas with <2000000 population. Out of the 24 countries left, only those with age-stratified mortality and population figures of sufficient detail were retained: eight countries (Bolivia, Brazil, El Salvador, Guatemala, Haiti, Honduras, Jamaica, Nicaragua) were excluded at this stage. The analysis is based on the remaining 16 countries: Argentina, Canada, Chile, Colombia, Costa Rica, Cuba, Dominican Republic, Ecuador, Mexico, Panama, Paraguay, Peru, Puerto Rico (a self-governing Com-monwealth), US, Uruguay, and Venezuela.
In most countries, data were missing for one or more years within the study period. When a single year was missing, numerators and denominators for each 5-year age group were interpolated from the previous and subsequent calendar year.
Apart from the US and Canada, few populations in-cluded in this study were covered by a Cancer Registry: La Plata, Argentina (1980), Chile (1959-1962), Cali, Colombia (1962-1981), Costa Rica (1980-1982), Cuba (1968-1977), Panama (1974-1980) Paraguay (three departments) (1975-1977), and Lima, Peru (1978). In these cases, comparisons were made between incidence and mortality rates. Incidence rates were derived from IARC publications.1'3"6 In the case of registries not covering the entire national population, the com-parison was made with national mortality figures. RESULTS
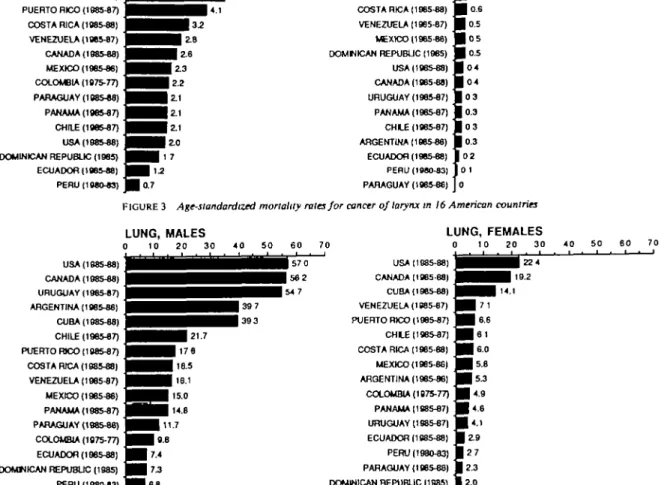
Sex-specific, age-standardized mortality rates for cancer of the oral cavity and pharynx, oesophagus, larynx, and lung during the most recent calendar period available are shown in Figures 1-4, respectively. For all sites, and in both sexes, the ratio of the highest
versus the lowest rates is approximately 10. Among
males, rates from Uruguay, Cuba, Argentina and Puerto Rico tend to be among the highest for all sites, whereas Peru, Ecuador, Dominican Republic, Mexico and Colombia are consistently among the countries with lowest mortality. Mortality rates for cancer of mouth and pharynx, oesophagus and larynx from the US and Canada are intermediate.
On the other hand, lung cancer mortality in these two countries is comparable to that of Uruguay (i.e. around or over 55/100000, World standard) and higher than those of all remaining countries. Thus, in the late 1980s overall age-adjusted (World population) lung cancer rates in males were 15-22/100000 in Chile, Costa Rica, Panama, Puerto Rico and Venezuela, and around or below 10/100000 in Colombia, the Dominican Republic, Ecuador, Paraguay and Peru. Among women, Cuba, Colombia and Puerto Rico tend to have higher mortality rates for all considered sites, whereas Mexico, Paraguay, Ecuador and Peru tend to score towards the bottom of all ranking. The US and Canada again have the highest mortality rates for lung cancer.
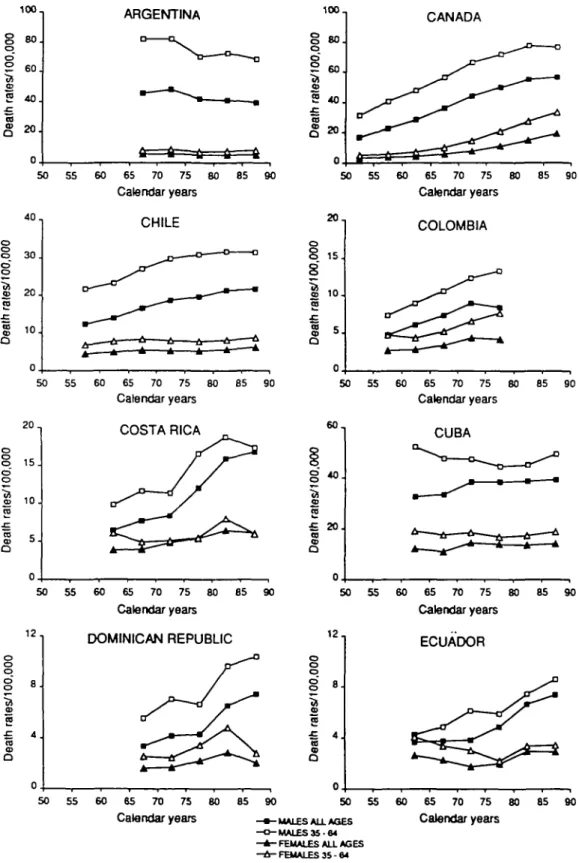
Figure 5 shows trends in lung cancer mortality rates by calendar quinquennium in men and women. In the late 1960s, Argentina had an overall World-standardized lung cancer mortality rate for males of > 45/100 000, and the rate for Uruguay and Cuba was >40/100000, i.e. two of the highest lung cancer rates in that period. Lung cancer mortality however, has since then been stable in Cuba and has declined in Argentina (to 39.7/1OOOO0 in males in 1985-1989) and is now, therefore, substantially lower than the values of 56-57/100000 for the US and Canada. A positive
MOUTH OR 0 i PUERTO RICO (1085-87) B j URUGUAY (1985-87) ^ | CUBA (198548) ^ J CANADA (1985-88) ^ J ARGENTINA (1885-88) ^ | COSTA FDCA (196548) ^ J USA (196548) ^ J PANAMA (198547) ^ J DOMINICAN REPUBLIC (1985) frj PARAGUAY (198548) ^ J COLOMBIA (1875-77) frj CHILE (198547) ^ J VENEZUELA (196547) frj MEXICO (106548) ^ J ECUADOR (196548) ^ J PERU(198043) ^ B PHARYNX, MALES 2 4 6 6 1 . 1 . 1 • 1 B H H H H H H H e9 HHHHHH5 5 HHHHI^'5 ^^^^^H4t UHl3-1 BHi2-7 H i2-4 ^ H 24 • • 2 . 2 • 1.7 08 MOUTH OR 1 10 0 j ^ ^ ^ 93 PANAMA (1965-87) _ • CUBA (196548) • DOMINICAN REPUBLIC (1985) • COLOMBIA (1975-77) • USA (196548) ~M PUERTO R K » (196547) M VENEZUELA (188547) | COSTA RICA (1885-88) • CANADA (196548) • URUGUAY (188547) • MEXICO (196546) • PARAGUAY (138546) • ECUADOR (196548) • CHLE (196547) • ARGENTINA (198546) • PERU (19SO-83) • PHARYNX, FEMALES 2 4 6 8 1 H Ii e ^ H1 s H I 1 8 H i 14 H i 1.4 H I1 3 H i '3 H i 1-3 1 1 0 | 0 . 8 I07 | 0 . 7 | 0 . 7 | 0 . 7 0.3
TOBACCO-RELATED CANCER MORTALITY IN THE AMERICAS OESOPHAGUS, MALES 0 5 OESOPHAGUS, FEMALES 0 5 10 URUGUAY (198547) | PUERTO RICO (198547) • ARGENTINA (198546) • CHLE (198547) • USA098S48) • PARAGUAY (198546) • COLOMBIA (1975-77) • CUBA (198548) • COSTA RICA (198548) | CANADA (198548) • VENEZUELA (198547) • ECUADOR (198548) • PANAMA (198547) • MEXICO (198546) j j PERU (196043) • DOMINICAN REPUBUC (1985) f ^ M H H i^M
• • •
^•1
^ ^
^•i
^•1
• • •
^•28 ^Hi2-7 H1-9 H1-9 11-4 I ' * | 4.5 I4 5 | 4.5 | 4 4 I43 I43 | ^ | 8 9 HS 4 ^ | 12 0 | 107 URUGUAY (198547) 1 C H l £ (1985-87) 1 COLOMBIA (1975-77) 1 PUERTO RICO (198547) 1 ARGENTINA (198548) 1 COSTA RICA (198548) 1 CUBA (198548) 1 VENEZUELA (198547) ] CANADA (1985-88) 1 USA (198548) 1 PANAMA (1985-87) 1 PARAGUAY (198546) 1 ECUADOR (1985-88) 1 MEXICO (198548) j DOMINICAN REPUBLIC (1985) 1 PERU (198043) ] ^ • ^ • 3 7 ^ ^ H3 7 I H H Z7 ^ B i2 3 ^ H i2 3 ^ H1 8 ^ 1 1.5 H <-3 H ^2 H ' ' | o . 9 | 0 8 | 0 8I
0 7 | 0 4 | 03FIGURE 2 Age-standardized mortality rates for cancer of oesophagus in 16 American countries
LARYNX, MALES 0 2 4 LARYNX, FEMALES URUGUAY (1985-87) CUBA (1985-88) ARGENTINA (1985-88) PUERTO RICO (198547) COSTA RICA (1985-88) VENEZUELA (198547) CANADA (1985-88) MEXICO (1985-88) COLOMBIA (1975-77) PARAGUAY (198548) PANAMA (1985-87) CHILE (1985-87) USA (1985-88) DOMINICAN REPUBLIC (1985) ECUADOR (1985-88) PERU (1980-83) 0.7 CUBA (1985-88) COLOMBIA (1975-77) PUERTO RICO (1985-87) COSTA RICA (198548) VENEZUELA (1985-87) MEXICO (1985-88) DOMNICAN REPUBLIC (198S) USA (198548) CANADA (1985-88) URUGUAY (198547) PANAMA (198547) CH I E (198547) ARGENTINA (198548) ECUADOR (198548) PERU(1»80-83) PARAGUAY (198546) • I I 1.0 •Joe • o.e • oe B o 5 • 05 • 0.5 • 04 • 04 Eo3 • 0.3 • 03 • 0.3 I 02 f 01 |o
FIGURE 3 Age-standardized mortality rales for cancer of larynx in 16 American countries LUNG, MALES 0 10 20 30 USA (198548) CANADA (198548) URUGUAY (198547) ARGENTINA (198548) CUBA (198548) CHILE (198547) PUERTO FBCO (198547) COSTA RICA (198548) VENEZUELA (198547) MEXICO (198548) PANAMA (198547) PARAGUAY (198548) COLOMBIA (1875-77) ECUADOR (198548) DOMNICAN REPUBLIC (1985) PERU (198043) LUNG, FEMALES 0 10 20 30 40 50 USA (1885-88) CANADA (1985 88) CUBA (198548) VENEZUELA (198547) PUERTO RICO (198547) CH I E (198547) COSTA RICA (198548) MEXICO (198546) ARGENTINA (198548) COLOMBIA (1975-77) PANAMA (198547) URUGUAY (198547) ECUADOR (1S8548) PERU( 198043) PARAGUAY (198548) DOMINICAN REPUBLIC (1985)
ioo1 8 80. o o ° 60, £ 2 40. CO S 20J ARGENTINA 100. 50 55 60 65 70 75 80 85 90 Calendar years 8 o S/100 , 2 ai r CD 8 0 . 6 0 . 4 0 . 2 0 . CANADA 50 55 60 65 70 75 80 Calendar years 85 90 40 o 8 30 1 20 10 CHILE tr-50 55 60 65 70 75 80 85 Calendar years 90 2 0 , 1 5 . 8 1 10 J
i
Q COLOMBIA 50 55 60 65 70 75 80 85 Calendar years 90 2 0 , o 8 15 o o I 10 iss
5. COSTA RICA 6 0 , 50 o o o 12 8 . CD 2 •B 4 . CO CD Q 55 60 65 70 75 80 85 90 Calendar years DOMINICAN REPUBLIC 5 0 5 5 6 0 6 5 7 0 7 5 8 0 8 5 9 0 Calendar years8
2 £ 20. (0 CD Q CUBA3=2-5 0 3=2-5 3=2-5 6 0 6 3=2-5 7 0 7 3=2-5 8 0 8 3=2-5 9 0 Calendar years 1 2" ECUADOR o o o
1
£ 4 as
5 0 5 5 6 0 6 5 7 0 7 5 8 0 8 5 9 0-MALES ALL AGES - MALES 35-84 - FEMALES ALL AGES - FEMALES 35 - 64
Calendar years
2 0 ,
§ «
•a 1 0 . 0) "ai
5
8
MEXICO 50 4 0 ,§
o o 20 ra 1 0 . CD Q 55 60 65 70 75 80 85 90 Calendar years PARAGUAY 50 3 0 ,g
ra 2 0 . 1 0 . ra CD O 55 60 65 70 75 80 85 Calendar years PUERTO RICO 90 50 1 0 0 , o o o '10 0 CD ra l .c ra cp O 8 0 . 6 0 . 4 0 . 2 0 . 55 60 65 70 75 80 85 90 Calendar years URUGUAY 50 55 60 65 70 75 80 85 90 Calendar years 3 0 ,g
o o 20. o m ra ra 1 0 . PANAMA 50 55 1 21 0 10.8
8
8J
1 6J
ra £ 4 . ra <B Q 2 . 60 65 70 75 80 85 90 Calendar years PERU 50 55 60 65 70 75 80 85 Calendar years 90 100, 8 o 100 , o) a "a an CD Q 8 0 . 6 0 . 4 0 . 2 0 .UNITED STATES OF AMERICA
-o o-50 55 60 65 70 75 80 85 90 Calendar years 3 0 - VENEZUELA o
8
£ ra £ 10. S a 55 60 - • - M A L E S ALL AGES - o - M A L E S 3 5 - 84 - A - F E M A L E S ALL AGES - A - FEMALES 35 - 64 FIGURE 5 Com. 65 70 75 80 Calendar years 85 90TABLE 1 Comparison of lung cancer mortality and incidence rates Argentina Chile Colombia" Costa Rica Cuba Panama Paraguay Peruc Years 1980 1959-1961 1977 1972, 1975, 1976 1967-1969 1962-1964 1980-1982 1973-1977 1968, 1971, 1972 1974, 1980 1975, 1977 1977 Mortality Males 43.8 13.4 10.1 8.7 7.4 4.3 15.7 38.9 39.3 14.3 10.2 6.4 Females 5.2 4.7 5.1 4.4 3.2 2.0 7.4 14.4 14.4 3.7 2.5 2.9 Years 1980 1959-1961 1977-1981 1972-1976 1967-1971 1962-1964 1980-1982 1973-1977 1968-1972 1974-1980 1975-1977 1978 Incidence Males 40.3 8.5 25.4 19.5 19.4 6.8 17.8 44.4 38.1 5.1 8.1 18.2 Females 6.7 2.8 9.7 5.4 2.6 1.9 6.8 16.9 12.9 1.8 1.9 5.7
•incidence data from the city of Cali only. ''Incidence data from three departments only, incidence data from Lima metropolitan area only.
(i.e. increasing over time) trend among men was found in Chile, Colombia, Costa Rica, Dominican Republic, Ecuador, Mexico, Panama, Puerto Rico, Uruguay, and Venezuela. In three countries, Argentina (starting from high values), Paraguay and Peru (whose rates have remained substantially low), a decreasing trend is shown, and in Cuba no modification was suggested. Among women, rates were increasing during the study period in Chile, Colombia, Costa Rica (not in the 35-64 year age group), Mexico, Panama, and Venezuela, as well as Canada and the US. Absolute values in all Latin America except Cuba were however substantially lower than in the US or Canada. Argen-tina was the only country showing a significant downward trend.
The comparison of lung cancer mortality and in-cidence data for areas and calendar periods covered by cancer registries is shown in Table 1. Overall, the cor-respondence between the two sets of data is very good. Incidence data from Colombia and Peru are higher than mortality figures, whereas the opposite is true for Panama.
DISCUSSION
The quality of death certification and in particular the accuracy of the diagnosis of cancer of the lung and other organs in the 16 countries included in the study is an important problem in the interpretation of the results. Two aspects can be identified: comparability of quality among countries and variation with time within countries. A further possible source of bias are differences in the completeness of census data. A par-tial assessment of the quality of the mortality rates
calculated in the present study can be derived from the comparison of mortality and incidence rates (Table 1). The high level of agreement adds to the validity of the mortality data from those countries with a nationwide register (i.e. Chile, Costa Rica and Cuba). In Colom-bia and Peru incidence rates are much higher than mortality rates, but only urban areas (Cali and Lima, respectively) were covered by cancer registration. The discrepancy between incidence and mortality data from Panama can be explained by incomplete coverage of the Registry1 or by instability of mortality rates, which are based on 2 years only.
Mortality rates of upper aero-digestive cancers from the US and Canada are intermediate when compared with those from most Latin American countries in-cluded in this study (Figures 1-3). Similarly, values shown in Figures 1-3 are similar to rates calculated for European Community (EC) countries: as an example, mortality rates for oesophageal cancer in EC countries during 1980-1984 ranged from 1.9 to 13.0/ 100000/year among males and from 0.5 to 3.9/ 100000/year among females. '•' For lung cancer, on the other hand, mortality rates for the US and Canada tend in both sexes to be much higher than those for most of the Latin American countries analysed; 1980-1984 EC rates are 53.0/lOOOOO/year among males and 8.2/100000/year among females, values which are higher than those of all but one Latin American country included in this study, and comparable to North American rates.
Data on tobacco consumption suggest a wide varia-tion in cigarette smoking among American countries; Cuba, Canada and the US being the countries with the
'///////////////////////////////////A Argentina Canada Chile Colombia Coata Rloa Cuba Dominican Rep. Ecuador Mexico Panama Paraguay Peru USA Uruguay Venezuela 0 600 1000 1500 2000 2600 3000
FIGURE 6 Per capita adult cigarette consumption in 15 American countries, 19889
60- 40- 30- 20-
10-Mexico Guatemala Bogota Caracas Lima Santiago Sao Paulo La Plata I S Male ourrsnt amok.
I I Female ourrent amok.
E22 Male ex amok. K<\1 Female ex amok.
FIGURE 7 Prevalence of smokers in eight Latin American populations, 1971
highest consumption and Central American and An-dean countries being those with the lowest (Figure 6). Even if these data may have some limitations, the wide range of values in cigarette consumption seems consis-tent with the range of values of mortality from tobacco-related cancers. Only one international survey on smoking habits is available from Latin America.l0 Over 9400 people aged 15-74 from eight urban areas (Bogota; Caracas; Guatemala City; La Plata, Argen-tina; Lima; Mexico City; Santiago; Sa"o Paulo, Brazil) were interviewed in 1971 (response rate 90%). The prevalence of current smokers among males ranged from 34.2% in Lima to 57.9% in La Plata, and in women between 6.5% in Lima and 26.4% in Santiago
(Figure 7). In all cities (except S3o Paulo), and in both sexes, there were more ever smokers among individuals 40-54 years old than among individuals aged 55-74, suggesting an increasing proportion of smokers among younger cohorts. The average number of cigarettes per day in Latin America, however, was substantially lower than in the US or Canada. The proportion of smokers of unfiltered cigarettes among males ranged from 3.9% (Caracas) to 28.0% (Sa"o Paulo), and in women from 4.0% (Bogota) to 23.5% (Caracas).
Although some mortality or incidence data have been published for individual countries or areas, such as La Paz," Chile,12-14 Cali, Colombia,13 Antioquia, Colombia,16 Argentina,17 and data from the US or
Canada are well known, our study provides the first comprehensive report on mortality from lung and other tobacco-related cancers in the Americas. The high variability in lung cancer mortality among American countries might be due in part to bias in death certification, but it is likely to reflect true variability in the effects of tobacco smoking and other carcinogens. A number of case-control studies have been conducted in Latin American countries on cancer of the lung,18-" larynx,*° oesophagus,2I oral cavity,22-23 and multiple sites;24 these studies showed that con-sumption of tobacco products is an important risk fac-tor and colour of tobacco (black versus blond)25 is an important aspect of the carcinogenic risk from tobacco smoking in these countries. The studies also showed a carcinogenic effect of other lifestyle factors, such as diet, alcoholic beverages and mate drinking, par-ticularly on cancers of the digestive tract. Occupa-tional exposures were also shown to play some role. In-ternational studies carried out in areas of low and high incidence of mortality for lung and other tobacco-related cancers might help to elucidate the role of tobacco and other risk factors in the aetiology of these neoplasms in different American countries.
On a public health scale, however, it is apparent that, whereas cancers of the oral cavity, oesophagus and larynx are a major issue in several Latin American countries, the tobacco-related lung cancer epidemic is still in its early phases in males, and very early phases in females, in these populations. There is, therefore, ample scope for intervention to avoid the future spread of this epidemic.
REFERENCES
1 Parkin D M (ed.) Cancer Occurrence in Developing Countries.
Lyon: International Agency for Research on Cancer, 1986 (IARC Scientific Publication, no. 75).
2 World Health Organization. Manual oflhe International Statistical
Classification of Diseases, Injuries and Causes of Death (9th revision conference). Geneva: WHO, 1978.
3 Muir C, Waterhouse J, Mack T, et al. (eds). Cancer Incidence in
Five Continents, Volume V. Lyon: International Agency for
Research on Cancer, 1987 (IARC Scientific Publication, no. 88).
4 Doll R, Muir C S, Waterhouse JAH, eds. Cancer Incidence in Five
Continents, Volume II. Berlin: Springer Verlag, 1970.
5 Waterhouse J A H , Muir C S, Correa P, et al. (eds). Cancer
In-cidence in Five Continents, Volume III. Lyon: International
Agency for Research on Cancer, 1976 (IARC Scientific Publication, no. 26).
6 Waterhouse J A H , Muir C S, Shanmugaratnam K, el al. (eds).
Cancer Incidence in Five Continents, Volume IV. Lyon:
Inter-national Agency for Research on Cancer, 1982 (IARC Scien-tific Publications, no. 46).
7 Jensen O M, Esteve J, Mpller H, et al. Cancer in the European Community and its member states. Eur J Cancer 1990; 26: 1167-256.
8 La Vecchia C, Lucchini F, Negri E, et al. Trends of cancer mortality
in Europe, 1955-1989: II, respiratory tract, bone, connective and soft tissue sarcomas, and skin. Eur J Cancer 1992; 28: 514-99.
' Kaiserman M J, Allen T A. Global per capita consumption of manufactured cigarettes, 1988. Chron Dis Canada, July 1990: 56-57.
1 0 Joly D J. Encuesta sobre las caracteristicas del habito defumar en
America Lalina (Spanish). Washington, DC: Organization
Panamericana de la Salud, Oficina Regional de la Organiza-cion Mundial de la Salud, 1977 (PAHO Publicaci6n Gen-tifica, no. 337).
' ' Rios-Dalenz J, Correa P, Haenszel W. Morbidity from cancer in La Paz, Bolivia. Int J Cancer 1981; 28: 307-14.
12 Armijo R. The epidemiology of cancer in Chile. Natl Cancer Inst
Monogr 1979; 53: 115-18.
13 Armijo R. Descriptive epidemiology of cancer in Chile: 1973-78.
Natl Cancer Inst Monogr 1982; 62: 91-94.
14 Martinez Oliva L, Paredes R, Caris L. Epidemiologja del cancer
broncopulmonar en Chile (Spanish). Rev Med Chile 1985;
113: 48-54.
15 Cuello C, Correa P, Haenszel W. Trends in canceT incidence in Cali, Colombia. J Natl Cancer Inst 1983; 70: 635-41. " Restrepo H E, Argeniro Franco H. Cancer morbidity and mortality
among the insured population of the Social Security Institute of Antioquia, Colombia. Int J Epidemiol 1978; 7: 285-91.
17 Matos E L, Parkin D M, Loria D I et al. Geographical patterns of
cancer mortality in Argentina. Int J Epidemiol 1990; 19: 860-70.
18 Joly O, Lubin J H, Caraballoso M. Dark tobacco and lung cancer
in Cuba. J Natl Cancer Inst 1983; 70: 1033-39.
19 De Stefani E, Fierro L, Correa P. Alcohol Drinking^ Meat
Con-sumption and Lung Cancer. Presented at the Meeting of the
International Association of Cancer Registries, Hamburg, Germany, August 1990.
2 0 De Stefani E, Correa P, Oreggia F el al. Risk factors for laryngeal
cancer. Cancer 1987; 60: 3087-91.
21 De Stefani E, Esteve J, Munoz N et al. Mate drinking, alcohol,
tobacco, diet and oesophageal cancer in Uruguay. Cancer Res 1990; 50:426-31.
2 2 De Stefani E, Correa P, Oreggia F et al. Black tobacco, wine and
mate in oropharyngeal cancer. A case-control study from Uruguay. Rev Epidemiol et Santt Publ 1988; 36: 389-94.
2 3 Franco E L, Kowalski L P, Oliveira B V et al. Risk factors for oral
cancer in Brazil: a case-control study. Int J Cancer 1989; 43: 992-1000.
2 4 Restrepo H E, Correa P, Haenszel W et al. A case-control study of
tobacco-related cancers in Colombia. PAHO Bull 1989; 23: 405-13.
2 5 Munoz N, Correa P, Bock F G. Comparative carcinogenic effect of
two types of tobacco. Cancer 1968; 21: 376-89.