Study of the Performances of
Thin Layer Chromatography. V. Flow Rate in
Reversed Phase Plates
Georges Guiochon
Ecole Polytechnique, Laboratoire de Chimie Analytique Physique, Route de Saclay, F-91128
Palaiseau Cedex, France
Gabor Korosi
Laboratoire de Chimie Technique, Ecole Polytechnique Federale, 41, Avenue des Bains, CH-1007 Lausanne,
Switzerland
Antoine Siouffi
Laboratoire de Chimie Industrielle, Universite d'Aix Marseille III, Centre de Saint Jerome, Rue Henri Poincarre,
F-13397-Marseille Cedex, France
Abstract
The conventional equation for the development of TLC plates predicts a velocity constant proportional to the
cosine of the wetting angle of the surface by the mobile phase. Because silica is wet by all organic solvents used in normal TLC, this dependence was never checked. The development of reversed-phase TLC plates using chemically bonded n-alkyl silica offers a new situation as water-rich solvent mixtures do not wet
these surfaces completely. Comparison of velocity constants measured in TLC using plates made with
various adsorbents and contact angles measured directly shows the validity of the conventional equation and the cos B dependence. As a consequence, it takes an impractically long time to develop TLC plates using water/alcohol mixtures containing more than ca. 25-40% water (v/v) depending on the adsorbent, which limits the applicability of reversed-phase TLC in practical analysis.
Introduction
In a recent paper the authors have shown (1) that from the pioneering work of Ruoff and Giddings (2) it is possible to derive an expression of the velocity constant of the mobile phase in thin layer chromatography (TLC).
The position, /, of the solvent front on a thin layer plate at time, t, in normal development is given by the quadratic equation:
z2 = k t Eq.
solvent front and of the vaporization of solvent from the wet part of the plate are small enough to be neglected (1). The velocity constant is related to the experimental conditions by the equation:
2 k
o
dp Y
C0SEq.2
where k is the velocity constant, provided the contributions of adsorption of the solvent vapor on the dry plate above the
In this equation, dp is the particle diameter, assuming the
plate has been prepared with a powder of sufficiently narrow particle size distribution; y is the surface tension of the solvent; rj is its viscosity; 9 is the wetting angle of the solvent on the adsorbent; ko is a dimensionless constant which takes
into account the profile of the external pore size distribution (assumed to be the same for particles of different average diameters), the effect of porosity on the permeability of the thin layer, and the ratio of the bulk liquid velocity to the solvent front velocity (2). Only pores around the particles con-tribute to the rate of development of the plate, not pores inside the particles.
The validity of Equation 2 has been established using the data published by authors who have demonstrated the proportionality of the velocity constant, k, to the ratio /%/ and to the particle diameter (1). The values of k0 obtained by
analysts working on plates made in their laboratories (1,3) or on industrial plates (1,4) are in excellent agreement. Combin-ation of the data by Guiochon and Siouffi (1) and by Ripphahn and Halpaap (4) gives for k0 x 103 an average value
of 7.92 with a standard deviation of 0.17 for the probability distribution of the true value around that mean (2.2°V).
In all this work, silica was used as stationary phase, and it was assumed that the wetting angle was close to 0° corre-sponding to complete wcttability. With most organic liquids examined, it is smaller than 10°, making cos 0 larger than 0.985, thus equal to 1 for all practical purposes (5).
With the recent availability of thin layer plates made with chemically bonded silica particles, the surface of which is covered by a dense layer of alkyl groups, so-called reversed-phase chromatography can be carried out. In the first
experi-ments it became clear that water-rich solvents typically used in this technique lead to very slow development because the sol-vent poorly wets the support (6). Thus, it also became possible to test the complete validity of Equation 2.
This paper reports results of the study on the dependence of the velocity constant on the wetting angle between the stationary phase and the solvent.
Experimental
II.C plates for reversed-phase chromatography were obtained from Merck (Darmstadt, West Germany). These plates are available in three different grades, RP-2, RP-8, and RP-18. The particles are porous silica reacted with CISi (CH3>2An, where An is the linear-chain alkyl group with 2, 8,
or 18 carbon atoms, respectively.
Average particle si/.e was 7 ^m according to manufacturer's specifications. One plate was scratched with a scraper and the powder obtained homogenized by ultrasonic irradiation of the suspension in acetone. The resulting powder was examined by scanning electronic microscopy. The average particle diameter thus found was 6.5 ^m. The same result was obtained with a sample of LiChrosorb RP-18(Merck) for column liquid chromatography.
Development times over distances of 1, 2, 3, and 4 cm were observed for the RP-18 plates with the following solvents: rt-pentane, A?-heptane, toluene, chlorobenzene, bromoben-zene, acetonitrile, methanol, and ethanol, as well as for mixtures of water with either methanol or ethanol in concentrations ranging from 5 to 40% (v/v) of water. Development times were also observed for plates prepared in the laboratory with UChrosorb RP-18 for column liquid chromatography, but only alcohols and water/alcohol mixtures were used in this last case. These measurements were made using standard chromatographic solvents and TLC equipment at room temperature (ca. 19"C). Most developments were carried out using a Camag development chamber (Mutten/, Switzerland).
Plates were manufactured in the laboratory using the conventional technique. They were rather easy to prepare with UChrosorb RP-8, but it was very difficult to achieve the required layer homogeneity with RP-18. At first the lack of a suitable binding agent made the plate very delicate to manipulate if the analyst did not wish to spread the particle layer as a cloud in the laboratory. Later it was discovered that /j-octadecane is a suitable binding agent which made the preparation and use of homemade plates for rcversed-phase chromatography more simple.
The cosine of advancing and receding contact angles of methanol, ethanol, and various water alcohol mixtures were calculated from capillary rise, using the method described previously (7), on the surface of Pyrex glass tubes treated by tetradecyldimethylsilanol, octadecyldimethylsilanol, and do-cosyldimethylsilanol. It has been shown that the wetting angles of silani/ed glass and silanized silica are the same. It was observed that equilibrium of the advancing or receding liquid front in the capillary tube was reached only very slowly, especially with organic solvent water mixtures. Vibration of the capillary tubes accelerated equilibration, but the measurement of the capillary rise of a (50/50) water/alcohol mixture typically needed 3 to 4 hrs.
Results and Discussion
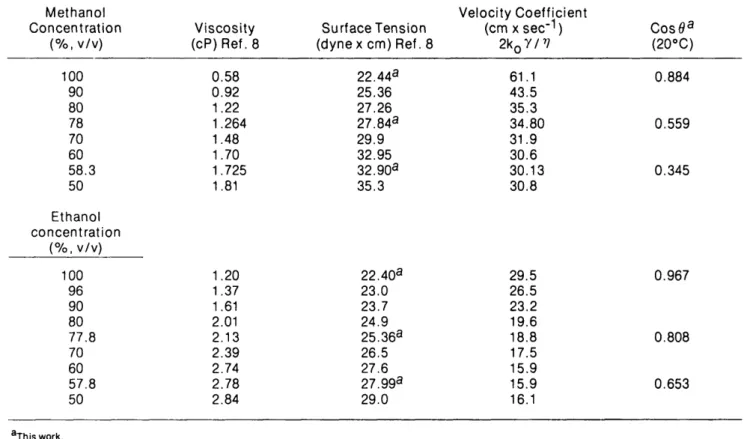
The viscosity, surface tension, and contact angle of the solvents used are given in Table I. The viscosity, surface tension, and contact angle of water/methanol and water/ ethanol mixtures are given in Table II.
The velocity constants obtained with the pure organic sol-vents are given in Table III. The velocity coefficient increases slightly with time, demonstrating a slow adsorption of the vapor on the dry part of the plate. The adsorption rate is cal-culated from the variation of z2/t with increasing time (I), assuming a layer thickness of 0.25 mm and a total porosity of 0.80. The values obtained are slightly larger than was observed on silica. They are not discussed here as no theoretical back-ground is yet available to account for these results.
Table I. Viscosity, Surface Tension and Advancing Contact Angle on Octadecyldimethyl Silica for Organic Solvents
Solvent
Viscosity
(cP)
(Ref.8)
0.24
0.41
1.26
0.59
0.80
1.13
0.36
0.58
1.20
Surface Tension
(dyne x cm)
(Ref. 10)
16.5
20.14
25.35
28.52
33.59
35.82
29.29
22.50
22.39
Velocity Coefficient
(cm x sec"1)on silica
115 80 32 77 67 52 125 63 32 Cos 9(Ref. 7)
1.000
a1.000
a0.960
0.908
0.822
0.799
0.669
b0.884
b0.967
bn-Pentane
n-Heptane
n-Dodecane
Toluene
Chlorobenzene
Bromobenzene
Acetonitrile
Methanol
Ethanol
^Extrapolated from values for octane to hecadecane (7). ^ h i s work.
NB. The velocity coefficient is the ratio k/dp = (2kg) (y/77 )cos6.
Table II. Viscosity, Surface Tension, and Advancing Contact Angle on Octadecyldimethyl Silica for Alcohol/Water
Mixtures
Methanol
Concentration
(%, v/v)
Viscosity
(cP)Ref.8
Surface Tension
(dynex cm) Ref. 8
Velocity Coefficient
(cm x sec'
1)
2k
o7/
r;
Cos0
a(20°C)
100 90 80 78 70 6058.3
50Ethanol
concentration
(%, v/v)
100 96 90 8077.8
70 6057.8
500.58
0.92
1.22
1.264
1.48
1.70
1.725
1.81
1.20
1.37
1.61
2.01
2.13
2.39
2.74
2.78
2.84
22.44
a25.36
27.26
27.84
a29.9
32.95
32.90
a35.3
61.1
43.5
35.3
34.80
31.9
30.6
30.13
30.8
22.40
a23.0
23.7
24.9
25.36
a26.5
27.6
27.99
a29.0
29.5
26.5
23.2
19.6
18.8
17.5
15.9
15.9
16.1
0.884
0.559
0.345
0.967
0.808
0.653
a This work.Table III. Velocity Constants, Rate of Adsorption, and
Wetting Angles from TLC Data (Pure Organic
Solvents)
Solvent
n-Pentane
n-Heptane
n-Dodecane
Toluene
Chloro-benzene
Bromo-benzene
Acetonitrile
k x(cm
2 6 4 1 4 3 2 6 102/sec)
.5 .9 .7 .8 .6 .4 .1V'x 10
6(cm/sec)
4.8 6.0 6.4 5.3 5.4 4.3Cos 9
0.87
0.94
0.82
0.96
0.83
0.71
0.75
The precision of the measurements of the velocity constant
is rather poor. On the one hand, experimental conditions,
especially the vapor pressure of the solvent in the tank and the
porosity of the plate, seem difficult to reproduce: in the
determination of the constant k
0(cf. Equation 2), from
meas-urements of velocity constants made on silica, the standard
deviation of the 37 values obtained was 13% (1). On the other
hand, on a given plate experimental errors result from the
determination of the position of the solvent front: the plate is
looked at through the tank wall and the chronometer is
stopped when the solvent front reaches a line drawn with a
pencil on the plate before the development. Similarly, the
plate is dipped so that the solvent level in the tank reaches a
second line. The standard deviation of the errors on the two
positions is about 1 mm, resulting in a total relative error of
ca. 7
a'o. On the contrary, the precision of the measurement of
contact angles by capillary rise is better than 1
a7o.
From the values of the velocity constant (cf. Table III) it is
possible to derive the wetting angle, assuming k
0= 7.9 x 10™
3and dp = 6.5 ^m and using the viscosity and surface tension
of the solvents found in the literature (8). Comparison of the
results with those published by Riedo, et al. (7) shows a good
agreement within the experimental errors. These
measure-ments have been made using a smooth surface, while TLC was
carried out using very rough surfaces. It is not too surprising
to obtain a lower value of the advancing contact angle on such
a rough surface. Figure 1 compares the two series of
measurements. The average ratio cos 9 measured by TLC over
cos 9 measured by capillary rise is 0.94 with a standard
devia-tion of 8
ro. This is in satisfactory agreement with Equation 2.
The results for water/methanol and water/ethanol mixtures
are given in Table IV and V, respectively. The migration rates
decrease markedly with increasing water content, and this
phenomenon can be ascribed to the parallel decrease in the
wetting angle. When this angle becomes close to 90°, the
solvent, although it still wets the adsorbent, becomes unable to
ascend the plate. At low values of cos 9 irreproducible results
are often obtained. In fact, TLC analysis becomes very slow
and impractical to carry out in the conventional way when cos
9 becomes smaller than 0.2-0.3, i.e., with water content above
ca. 3O
a'o. Unfortunately, no real practical alternative is
avail-able yet.
Another effect makes measurements with water
concentra-tions larger than 3O
a'o difficult if even significant at all. The
O
0.5 1
Figure 1. Plot of the cosine of the wetting angle derived from measurements of solvent velocity in TLC (cf. Table III) vs. the cosine of the advancing contact angle measured by capillary rise (cf. Table I). X: value for pure methanol (cf. Tables II and IV). The straight line has a slope unity.
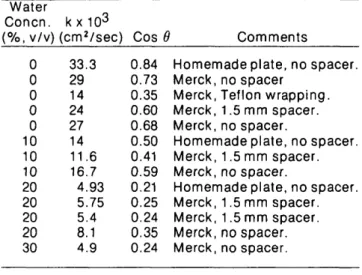
Table IV. Velocity Constant and Wetting Angle of RP-18
Silica by Water/Methanol Mixtures
Water
Concn. kx10
3(%, v/v) (cm
2/sec) Cos 9 Comments
Homemade plate, no spacer.
Merck, no spacer
Merck, Teflon wrapping.
Merck, 1.5 mm spacer.
Merck, no spacer.
Homemade plate, no spacer.
Merck, 1.5 mm spacer.
Merck, no spacer.
Homemade plate, no spacer.
Merck, 1.5 mm spacer.
Merck, 1.5 mm spacer.
Merck, no spacer.
Merck, no spacer.
Table V. Velocity Constant and Wetting Angle of RP-18
Silica Water/Ethanol Mixtures
0
0
0
0
0
10
10
10
20
20
20
20
30
33.3
29
14
24
27
14
11.6
16.7
4.93
5.75
5.4
8.1
4.9
0.84
0.73
0.35
0.60
0.68
0.50
0.41
0.59
0.21
0.25
0.24
0.35
0.24
Water
concentration
kx10
3(cm^/sec)
Cos0
0
4
10
20
30
40
50
16.6
13.4
12.3
7.8
5.5
3.5
1.50
0.87
0.78
0.76
0.61
0.48
0.34
0.14
movement of the solvent becomes very irregular. This pheno-menon is made very clear by observing the developed plates under UV light after developing them with solutions of picric acid, silver nitrate, or nickel nitrate in water/methanol mixtures. The development is carried out over 50 mm, then the plate is dried and the height of the homogeneous colored zone is measured. With Wo water, the height is slightly more than 49 mm. With 50% water it is only 42 mm with the Merck plates and about 48 mm with the homemade plates using decane as a binder.
Above the homogeneous colored zone and up to the 50 mm development distance there are fingerings; the solvent has moved below the layer surface, which is not wet, whereas the surface of the lower part of the plate is wet, seemingly along the glass plate, in narrow channels about 0.5 mm wide, which are in some places enlarged into small pools, approximately 1 mm in diameter. Accordingly, no wetting angle was calculated from velocity coefficients for mixtures above 3O"'o water. This also means then that Rj- values larger than 0.85 to 0.90 arc meaningless.
This effect, which is not seen for a development distance below 30-35 mm with 5O°'o water, is probably due to the lack of silanization of the glass plate itself, which is thus complete-ly wetted by the water/alcohol mixture while the particles are not; the layers of homemade plates are thinner than those of Merck plates but the glass plate is not silanized either. Obviously, when this phenomenon becomes significant the surface part of the layer is wet by liquid moving in the direction perpendicular to the solvent flow and retention data lose their significance.
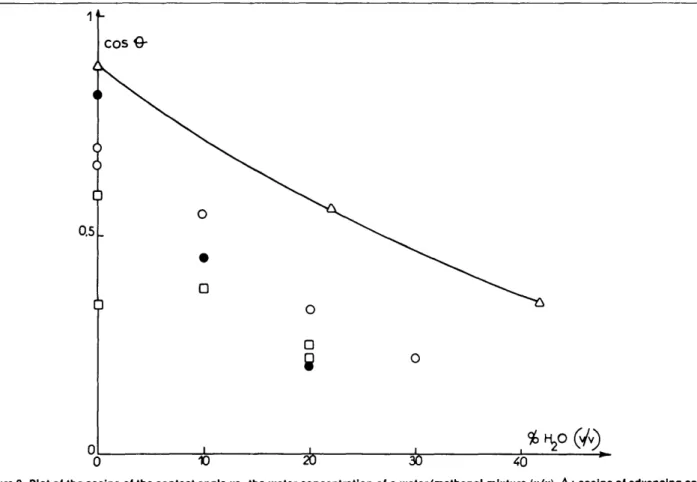
The possible influence of a spacer is related to the adsorption of water and methanol from the gas phase. Diffusion of vapors in the empty space over the plate seems to be fast enough to keep the gas phase homogeneous in all cases. Figure 2 illustrates the lack of reproducibility of data which occurs in this field and which most probably arises, among other factors, from local fluctuations in thin layer permeabil-ity and possibly wettabilpermeabil-ity. Nevertheless, the data in Figure 2 are in good agreement with those derived from development times measured by Gonnet and Marichy (9). Although all the values of contact angle are consistently well below those measured by capillary rise in smooth surface tubes, the trends observed are similar, a marked decrease in the contact angle with increasing water concentration. It seems normal that the value obtained by TLC is below the one derived from the capillary rise, because the surface is considerably rougher, and because development times, although long since development over 5 cm of a 7 ^m RP-18 particle plate takes approximately 20 minutes with pure methanol and over 2 hours with water/ methanol (30:70), are shorter than the equilibration time during capillary rise. These two facts could also explain the increase in the observed discrepancy between the two sets of results obtained by TLC on one hand and capillary rise on the other.
The data obtained for ethanol/water mixtures are much less scattered as shown by Figure 3. This is probably explained by the fact that they were all measured using the same experimen-tal conditions and the same batch of plates over a span of 2 days, while Table IV illustrates the collection of data measured in different series of experiments, during a period of over 3 months and using several batches of plates or of LiChrosorb particles with different development conditions (cf. Table IV).
Figure 2. Plot of the cosine of the contact angle vs. the water concentration of a water/methanol mixture (v/v). A : cosine of advancing contact angle, capillary rise in Pyrex glass tubes after treatment by dimethyloctadecyl silanol (7). • : TLC data on homemade plates (LiChrosorb RP-18, binder n-octadecane). 0 : Merck plates, no spacer. D: Merck plates, 1.5 mm spacers.
0
Q5
0
cosO-0
%
1020"
30
40 50
Figure 3. Plot of the cosine of the contact angle vs. the water concentration of a water/ethanol mixture (v/v). A: Cosine of the advancing contact angle, capillary rise. 0: TLC data.
The values obtained on homemade plates with LiChrosorb RP-18 show that it is extremely difficult to prepare layers as homogeneous as those that can be obtained in the industry. From previous work with column chromatography it is known that reversed-phase silica-based adsorbents are very difficult to pack. A two-fold increase in the permeability of the layer is explained by an increase of the external porosity from 0.40 to 0.46, which seems quite possible to experience in practice. On the other hand, the demixing of the mobile phase is much less important with the authors' plates.
All these results illustrate the difficulties of application of the TLC technique to wetting angle measurements. Besides the experimental errors of measurement, the difficulties in repro-ducing the layer external porosity within acceptable limits (a 10% variation of k0 would be obtained with a variation of the
external porosity from 0.400 to 0.409, a reproducibility which cannot be expected to be achieved) with widely different materials, the possible effects of the roughness of the surface, and of the use of a binding agent on the surface properties of the solid make this method of measurement of wetting angles extremely difficult to use reliably. The lack of accuracy of the measurements seems prohibitive for any application.
Finally, the experimental results demonstrate the validity of Equation 2 at low contact angles. At larger values of the contact angle and when solvent mixtures are used this relation-ship does not, however, seem to permit an accurate prediction of analysis time, although, qualitatively, the trend is in agreement with the experimental results. This may be due to difficulties in controlling the experimental parameters, but may result from a more fundamental roadblock as well: Equations 1 and 2 are derived from considerations involving capillary forces, which are known through equilibrium studies. Similarly, the wetting angles are derived from capillary rises and are static data. On the other hand, the development of TLC plates is a kinetic problem. It is not certain that it can be handled properly in all cases by the mere consideration of static forces, although this approach seems to be valid in most instances. The kinetic of wetting, however, is yet to be developed.
Acknowledgements
The authors thank Ervin sz. Kovats (Lausanne) for fruitful discussions. One of us (G.K.) is grateful to SEA for providing him a one year grant to work at EPF, Lausanne.
References
1. G. Guiochon and A. Siouffi. Study of the performances of thin layer chromatography. III. Flow velocity of the mobile phase. J. Chromatogr. Sci. 16: 598 (1978). 2. A.L. Ruoff and J.C. Giddings. Paper geometry and flow
velocity in paper chromatography. J. Chromatogr. 3: 438 (1960).
3. E. Stahl. Analytische und Preparative Dlinnschicht-Chromatographie. Z. Anal Chem. 236: 294 (1968). 4. J. Ripphahn and H. Halpaap. High Performance Thin
Layer Chromatography Development, Data and Results. A. Zlatkis and R.E. Kaiser, eds. Elsevier, Amsterdam, 1976.
5. E.A. Moelwyn-Hughes. Physical Chemistry. Pergamon, New York, 1961, pp. 923-25.
6. A. Siouffi and G. Guiochon. Some practical applications of reversed phase thin layer chromatography. J.
Chromatogr. 186: 563 (1979).
7. F. Riedo, M. Czencz, O. Liardon, and E. sz. Kovats. Chemically modified silicon dioxide surfaces. Helv. Chim. Acta. 61: 1912(1978).
8. R.C. Weast, ed. CRC Handbook of Chemistry and Phys-ics. CRC Press, Cleveland Ohio, 58th Edition, 1977. 9. C. Gonnet and M. Marichy. InteVet des supports greffes
apolaires en chromatographie sur couches minces et possibilites de transposition en colonne. Analusis. 7: 204 (1979).
10. J. Jasper. The surface tension of pure liquid compounds. J. Phys. Chem. Ref. Data. 1: 841 (1972).
Manuscript received October 12,1979, revision received March 17,1980.