Effectiveness of dog rabies vaccination programmes:
comparison of owner-charged and free vaccination campaigns
S. D U R R1#, R. M I N D E K E M2#, Y. K A N I N G A3, D. D O U M A G O U M M O T O2,
M. I. M E L T Z E R4, P. V O U N A T S O U1
A N DJ. Z I N S S T A G1* 1
Swiss Tropical Institute, Basel, Switzerland
2Centre de Support en Sante´ International, N’Djame´na, Chad 3Clinique Ve´te´rinaire Urbaine, N’Djame´na, Chad
4Division of Emerging Infections and Surveillance Systems, Centers for Disease Control and Prevention, Atlanta, USA
(Accepted 8 February 2009; first published online 30 March 2009)
S U M M A R Y
We investigated the percentage of dogs that could be vaccinated against rabies by conducting a pilot campaign in N’Djame´na, Chad. Owners were charged US$4.13 per dog vaccinated, and 24 % of all dogs in the three city districts covered by the campaign were vaccinated. Total campaign costs were US$7623, resulting in an average of US$19.40 per vaccinated dog. This is five times more expensive than the cost per animal vaccinated during a previous free vaccination campaign for dog-owners, conducted in the same districts. The free campaign, which vaccinated 2605 more dogs than this campaign, cost an additional US$1.45 per extra dog vaccinated. Campaigns in which owners are charged for vaccinations result in lower vaccination rates than in free campaigns. Public health officials can use these results when evaluating the costs and benefits of subsidizing dog rabies vaccination programmes.
Key words: Canine rabies, Chad, owner charge, public good, vaccination.
I N T R O D U C T I O N
Rabies causes, worldwide, an estimated 55 000 human deaths (90 % CI 24 000–93 000) per year. More than 99 % of these deaths occur in developing countries, with about 43 % (23 750) occurring in Africa [1]. In countries where the virus circulates in the dog popu-lation, more than 99 % of all human rabies cases are the result of exposure to rabid dogs [2, 3]. A person
bitten by a rabid dog, if untreated with post-exposure prophylaxis (PEP), has about a 5 % (if bitten on hand) to 70 % (if bitten on face) probability of developing clinical rabies [4, 5]. With one exception, clinical cases of human rabies are always fatal [6]. Unfortunately, PEP is often unavailable or unaffordable in many developing countries. Canine vaccination campaigns appear to be an effective means to control canine ra-bies [3]. Coleman & Dye calculated that, to eliminate rabies from a dog population, a minimum of 39–57 % of dogs must be vaccinated [7]. However, the World Health Organization (WHO) recommends that in order to eliminate dog rabies, vaccination coverage should reach 70 % [3]. Examples include Japan (1957),
* Address for correspondence : Professor J. Zinsstag, Swiss Tropical Institute, PO Box, CH-4002 Basel, Switzerland. (Email : [email protected])
Malaysia (1954), Taiwan (1961), Mexico (1990s) and several European countries, including elimination of wildlife rabies [8–11]. Recently, the USA declared it-self to be free of dog-to-dog transmission of rabies (importation of rabid dogs remains a risk) [12].
However, many developing countries have no ac-tive official dog rabies control strategy. The current government policy on rabies control in Chad, for example, is restricted to human post-exposure treat-ment. Public human health authorities in Chad con-sider rabies a veterinary problem, and the Ministry of Livestock considers the problem to be ‘ negligible ’. Human cases, however, are probably underreported [1]. Data from the incidence of dog bites in the United Republic of Tanzania, indicate that human rabies cases are between 10 and 100 times higher than of-ficially reported [4]. In N’Djame´na, capital of Chad, the annual incidence of canine rabies in 2006 was 1.7/ 1000 unvaccinated dogs [13]. In 2002 a pilot, free vac-cination campaign for dog-owners in N’Djame´na re-sulted in 64–87 % of all dogs being vaccinated [14]. In that campaign, the societal costs (public sector costs+ owner costs) were US$3.11 per dog [15]. Kaare et al. obtained similar levels of coverage with a free vac-cination campaign for dog-owners in agro-pastoralist communities in Tanzania [16]. Policy-makers can use cost and coverage data to both judge the value of, and plan necessary budgets for, dog rabies vaccination campaigns. Such cost data for Africa are scarce, with only three published cost per dog vaccination studies from sub-Saharan Africa [15–17]. We report in the present study the impact on dog rabies vaccination coverage when the owners are required to pay part of the costs of vaccination.
M A T E R I A L A N D M E T H O D S
N’Djame´na’s human population in 2001 was 649 460 [18], with a dog population, as measured in a 2001 study, of 23 560 dogs (95 % CI 14 570–37 898). About 19 % of the dogs were recorded as being vaccinated against rabies [19]. Our design for the dog vaccination campaign reported in the present study, conducted in October 2006, was similar to a pilot campaign in N’Djame´na conducted in 2002 [14]. Location (two city districts), scope, advertising, equipment, opera-tions, collaborators and (for the most part) the mem-bers of staff were the same as the previous campaign. The Chadian Ministry of Public Health gave written permission to conduct the study.
Information campaign
One week before the start of the vaccination cam-paign, the city government and the local chiefs of the two districts, in which the campaign was held, distributed posters announcing the campaign. Posters were displayed in the fronts of the houses of the local chiefs, at the vaccination points, and they were dis-tributed to health centres and drug stores in the three districts. On the evening before the campaign started, we drove a car through the districts, using a mega-phone to announce, in French, Arabic and Ngambaye, the date, locations and cost of the vaccinations. Ad-vertisements about the campaign were transmitted four times by the local radio prior to the onset of the campaign. Finally, in some sections of the districts, the local chiefs went from door to door during the second day of the campaign to invite the dog-owners to come and have their dogs vaccinated.
Charges to dog-owners and revolving fund
The earlier free vaccination campaign for dog-owners cost US$2.14 per vaccinated dog to the public sector, equivalent to FCFA 1110 [15]. For this campaign, owners were charged FCFA 2000 (US$4.13) per dog vaccinated. This amount covered the campaign costs (assuming the same level of participation as in the earlier campaign), and included an amount intended to start a revolving fund. We envisioned that the re-volving fund would be used to buy vaccine and equipment for future vaccination campaigns.
Vaccination campaign
The vaccination area was almost identical to the pre-vious campaign and covered the sixth and seventh districts of N’Djame´na, where 50–75 % of all house-holds have at least one dog [20]. As in the previous campaign, to aid logistics, we divided these two dis-tricts into three vaccination zones. The first zone was about 0.8 km2and located in the seventh district. The
second and third zones were in the sixth district, and were about 1.5 km2and 1.3 km2, respectively.
Ten vaccination points were established in each vaccination zone. In each zone, the campaign took place during 3 days over a weekend (Friday–Sunday), 4 h per day with a break during lunchtime. Two vet-erinary technicians operated each vaccination point, and a local chief was also present. All veterinary tech-nicians participated in a training day before the campaign and received (free) prophylactic anti-rabies
vaccinations (0-7-21 vaccination scheme). Each point was equipped with 35 doses of vaccine (Rabisin1, Merial, France), which were kept on ice in ice boxes, a register for recording the vaccinated animals, 50 syr-inges and needles, 50 vaccination certificates, a cash box and receipt book, muzzles or cord to prevent dog bites, and collars and paint to mark the dog after vaccination. We did not provide more than 35 vaccine doses at the beginning of each working day in order to hold vaccine as long as possible in a fridge at a central location. Vaccination points were re-supplied as needed during the day. The local chief supplied table and chairs. Three people supervised the campaign, and they drove by car between the vaccination points to ensure the continuous supply of vaccine, syringes and certificates. In case of an accidental animal bite, a first-aid kit with was available to the supervisors.
We subcutaneously vaccinated dogs, cats and monkeys. For each animal, a new syringe and needle was used. If an owner was unable to bring an animal to a vaccination point, vaccination technicians went to the owner’s house. We recorded owners’ addresses, and the age, sex and colour of each vaccinated animal, which were marked by a collar and paint. The loss of collars and paint on marked dogs was estimated at 1.87 and 2.2/day per 100 dogs, respectively (A. Gsell, unpublished data). Animals aged <3 months, and those obviously ill, were not vaccinated (vaccination is contra-indicated for these groups).
Recapture of marked and unmarked dogs
To assess vaccination coverage, we used the same capture–recapture methodology used by Kayali et al. [14]. Three observers walked through transect lines in each zone to detect all dogs in the street. There were 12 and 17 transect lines with a total distance of about 2.2 km and 3.3 km in the second and third zone, re-spectively. Detected dogs were counted, and a note was made as to whether or not they were marked with the campaign collar and/or paint, indicating vacci-nation. In each zone, the transect walks were done on the first and second days after the vaccination cam-paign. Each day, observers did two transects, one the morning and one the evening, when the dogs were most likely to be outside household compounds. The transect lines ran on parallel roads inside the vacci-nation zone, and we left a buffer zone ofy220 m wide on the border of each zone to avoid counting dogs that migrated in, even temporarily, from outside the zone. To avoid double counting within a zone, the
transect lines in each zone were separated by at least one street. Due to flooding following a torrential rain, we were unable to survey dogs in zone 1.
Household questionnaire
In each zone, 3 days after the last vaccination day, we also interviewed the heads (if absent, a suitable sub-stitute) of randomly selected households with at least one animal (dog, cat or monkey). The questionnaire was written in French, and, if necessary, the questions were translated in local languages for the interview. We asked the number of dogs owned by the household, if the owner had them vaccinated in the campaign, and reasons for non-participation in the campaign. For dogs unmarked during the campaign, but owner-identified as having been previously vaccinated, we checked the date on the vaccination certificate to see whether the vaccination was still valid (<1 year old). To estimate the probability of confinement, we asked how much time the dogs spent outside the compound and recorded if, during the interview, the door was open. We collected 160 questionnaires from zone 1, 133 from zone 2 and 132 from zone 3. We assumed binomial distributions to calculate the statistical con-fidence intervals for each reported reason for non-participation.
Analysis of the data for vaccination coverage
To estimate the proportion of vaccinated dogs (owned and ownerless) in the whole dog population, we used a Bayesian (probability-based) mathematical model [14]. Appendix 1 (available online) describes the model in detail. All dogs counted in each survey were included in the mathematical model. We calcu-lated the binomial probability distributions describing total owned dog population and the probabilities of confinement using data collected from the transect surveys and household questionnaires. The Peterson– Bailey formula was used to estimate the total owned dog population [21]. We assumed that confined (owned) dogs were not counted during the transect surveys and used the distribution from Kayali et al. [14] to estimate the number of ownerless dogs (see Appendix 1, online).
Cost data
We categorized cost data collected as either ‘ public sector ’ or ‘ private sector ’. Public sector was defined
as all costs that are paid using public funds, while private sector refers to costs paid by dog owners. From direct observation, we collected public-sector cost data for the following items : human rabies vac-cine (prophylaxis for campaign workers), canine rabies vaccine, ice boxes with ice, syringes and needles (one of each per animal vaccinated), certificates, col-lars, cash boxes, receipts, muzzles, registers, pens, salaries (for campaign workers, local chiefs and super-visors), transport costs for supervision (car rental, petrol). We priced dog rabies vaccine at FCFA 425/ dose (US$0.88), which was the price without a profit margin for the reseller in N’Djame´na (the vaccine doses were donated by the manufacturing company ; Merial). Public sector costs for the information cam-paign consisted of the costs of printing posters and running the radio advertisements.
For owner-related costs (private sector), we as-sumed an opportunity cost of labour of FCFA 500 (US$1.04) for every owner presenting an animal for vaccination [15]. Animal owner transport costs were considered negligible because of the short distance from residences to the vaccination points in each zone.
R E S U L T S
Characteristics of the population
We visited 356 households with at least one animal in the three zones. The majority of the households kept one dog (78 %) and 2 % of the households had no dog (Table 1). The average age of the dogs was 3.4 years, and almost one fourth of the animals were aged <1 year. The majority (77 %) of all animals were male. From owner statements, at least 70 % of the animals had been vaccinated against rabies at least once in their lives, but only 44 % had a valid vaccination certificate (f1 year old). Of those with a valid cer-tificate, 61 % had been vaccinated during the cam-paign (Table 1).
Campaign operations and vaccination coverage achieved
We successfully maintained the cold chain for the vaccine with ice boxes and ice, and were able to vac-cinate all the animals brought to the vaccination points without any reports of animal bites. We vacci-nated a total of 393 animals, of which 352 were dogs (102 in zone 1 ; 94 in zone 2 ; 156 in zone 3). We also vaccinated 11 cats, 12 monkeys and nine animals
whose species was unidentified in our records. Most of the animals came from within the three vaccination zones, with 38 coming from outside those zones. Table 1. Characteristics of the 356 households and 450 animals surveyed in the vaccination zones*
n %
Number of persons per household
1–10 230 65
11–20 107 30
21–30 10 3
30–35 1 0
Unknown 8 2
Gender of interviewed respondents
Female 165 46
Male 190 53
Unknown 1 1
Age (years) of interviewed respondents Mean (33.7)
Minimum (13.0) Maximum (80.0)
Number of respective animals per household Dogs 0 7 2 1 278 78 2 65 18 3 6 2 Cats 0 341 96 1 14 4 2 1 0 Monkeys 0 346 97 1 10 3
Age (years) of animals
<1 101 22 1–3 155 34 3–6 134 30 >6 48 11 Unknown 12 3 Average (years) 3.37 Animal gender Male 346 77 Female 101 22 Unknown 3 1
Animals stated to be vaccinated at least once in their life
Yes 314 70
With valid vaccination# 197 44
Vaccinated during the campaign 121 27
No 132 29
Unknown 4 1
* Adapted from Du¨rr et al. [22].
# For dogs unmarked during the campaign, but owner-identified as having been previously vaccinated, we checked the date on the vaccination certificate to see whether the vaccination was still valid (<1 year old). These dogs would have been vaccinated before our campaign.
We estimated the owned-dog population to be 336 (95 % CI 323–349) in zone 2, and 581 (95 % CI 562–599) in zone 3. These numbers are similar (in terms of average number of dogs per household) to those estimated in the earlier campaign [14]. We also estimated that there were 84 ownerless dogs in zone 2 (25 % of total zone population) and 87 (1.5 % of the total zone population) in zone 3.
We achieved an overall dog vaccination coverage of 23 % (95 % CI 0.3–26) for zone 2 and 24 % (95 % CI 0.0–24) for zone 3 (Table 2 a). As mentioned pre-viously, we were unable to collect population or vac-cination coverage data from zone 1.
Reasons for non-participation
Of the 328 respondents who did not have their dogs vaccinated, the two most common reasons cited for non-participation were not being informed (26 %, 95 % CI 21–30), and lack of money (25 %, 95 % CI 20–30) (Table 3). Several respondents also stated that current household financial resources were spent on paying school fees (the school year began during the campaign). Ramadan, which coincided with the campaign, was also mentioned as a reason for non-participation (probably due to higher than normal food expenditures related to Ramadan). However, it should be noted that, in the districts where the cam-paign was conducted, the majority of persons were Christians.
Dog-related reasons for non-participation included : recent vaccination 18 % (95 % CI 14–23) ; ‘ too young ’ (age<3 months) and/or ill or being unable to ‘handle’
the dog [these three reasons combined accounted for 9 % (95 % CI 6–12) of non-participating re-spondents]. Owner-specific reasons, such as lack of time, no interest or false information (e.g. expecting vaccinators to call door-to-door or thinking that rabies vaccination is only reasonable for aggressive dogs) accounted for 16 % (95 % CI 12–20) of the stated reasons for non-participation (Table 3).
Cost analysis
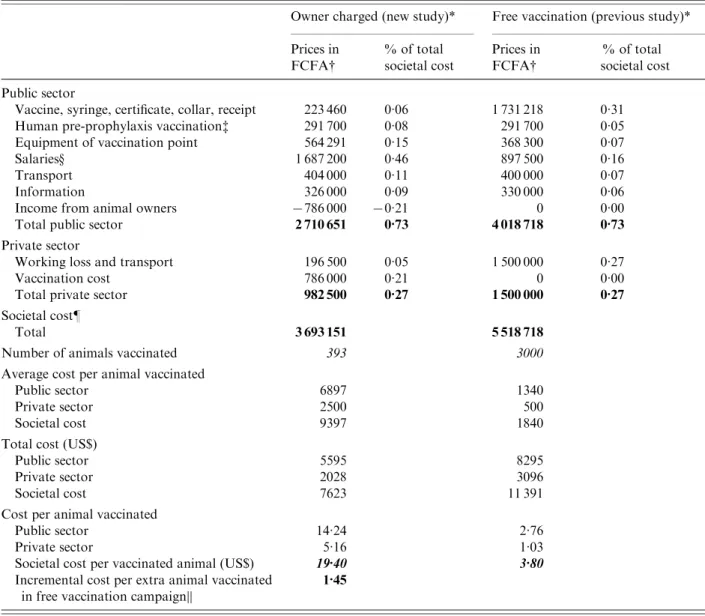
The societal cost of the campaign totalled US$7623 (public sector US$5595 ; private/owner sector US$2028), with the biggest single expense category being salaries (about 45 % of societal costs) (Table 4). Owner payments accounted for y21% of societal costs, whilst vaccines, syringes, certificates, collars, and receipts only accounted for 6 % of societal costs. The societal cost per vaccinated animal was US$19.40 (public sector US$14.24 ; private sector US$5.16) (Table 4). This is about five times greater than the cost of US$3.80 per animal vaccinated achieved during the free vaccination campaign for dog-owners (Table 4).
Although the earlier free vaccination campaign cost more than our campaign, it also resulted in more animals being vaccinated (i.e. greater public health impact) (Table 4). Compared to the campaign re-ported here, the earlier free vaccination campaign cost an additional US$1.45 per extra animal vaccinated (societal perspective ; incremental cost effectiveness ratio calculated as increased costs divided by the in-crease in number of animals vaccinated).
D I S C U S S I O N
We conducted a vaccination campaign in which we charged owners a fee that covered the cost of the vaccine plus an amount meant to fund future cam-paigns. As far as we are aware, this is the first time, in a Sahelian country, that both the total societal costs and coverage rates have been recorded for a rabies vaccination campaign in which owners were charged a fee. The data from this study are essential elements when public health officials wish to assess the poten-tial cost-effectiveness of subsidizing dog rabies vacci-nation programmes.
The campaign only achieved vaccination coverage rate ofy25%. This vaccination rate is well below the WHO’s recommendation of 70 %. The overall vacci-nation coverage from this campaign was much lower than the 64–87 % achieved in the earlier, free Table 2. (a) Overall vaccination coverage and (b)
vaccination coverage of owned dogs : owner-charged vs. free vaccination campaigns
Owner charged* (new study)
Free vaccination (previous study) (a) Overall vaccination coverage in all dogs
Zone 1 — 87 % (84–89)
Zone 2 23 % (0.3–26) 71 % (64–76)
Zone 3 24 % (0.0–24) 64 % (58–71)
(b) Vaccination coverage only in owned dogs
Zone 1 — 88 % (84–92)
Zone 2 27 % (0.0–27) 76 % (71–81)
Zone 3 24 % (0.0–24) 70 % (66–76)
Values in parentheses are 95 % confidence intervals. * Due to flooding following a torrential rain, we were un-able to survey dogs, and thus estimate vaccination coverage, in zone 1.
vaccination campaign (Table 2 a). Even considering vaccination coverage in owned dogs, our campaign obtained coverage rates of<30%, which is less than half the rate achieved during the earlier free vacci-nation campaign (Table 2 b). Because our campaign vaccinated far fewer animals than the previous free campaign, the cost per animal vaccinated in our campaign was about five times greater than in the free campaign. The free vaccination campaign vaccinated about nine times more animals than our campaign, yet the public-sector cost of the free campaign was only 1.5 times more than the current campaign. Although free campaigns are likely to be more effec-tive (i.e. more animals vaccinated), the increased cost of free campaigns, especially to the public sector (Table 4), may present significant budgetary problems that could prevent the routine implementation of such campaigns. In Chad, in 2005, the government spent the equivalent of US$9 per capita on health (calcu-lated using standard exchange rates) [23].
The two main owner-stated reasons for not vacci-nating dogs were lack of money and not having been informed of the campaign. In households with un-vaccinated dogs, 25 % of owners stated that lack of money was the reason for non-participation in the vaccination campaign. During the household survey we asked the owners a question regarding the fee that they would be willing to pay for vaccination [22]. To reach 70 % vaccination coverage, a maximum of
FCFA 400–700 (US$0.83–1.45) could be charged, which would not cover the vaccination campaign’s cost [22].
Despite the pre-campaign efforts to inform owners, 26 % of owners of unvaccinated dogs claimed not to have been informed about the campaign. Comparing the estimated number of dogs per zone and per households with our earlier study [14], we do not believe that the number of dogs changed ‘ notably ’ be-tween the two campaigns. Since we achieved a 64–84 % vaccination rate in the 2002 (free campaign for dog-owners) [14], the number of dogs that were not vaccinated because owners stated that they were ‘ not informed ’ was far greater in 2006 than in 2002. This higher proportion of owners claiming not to have been informed could be owners using this reason be-cause they were uncomfortable about admitting the actual reason for non-participation, i.e. lack of money.
It is remarkable that only 4 % of respondents in-dicated dog-handling difficulties as a reason for non-vaccination of the dog. In the previous free campaign, 19–35 % of respondents indicated this was the reason for non-participation. Although only 3 % of the in-terviewed persons indicated that they expected a door-to-door campaign, this method could be more effective in urban settings. However, in the previous free campaign, a high level of coverage was achieved with the vaccination point method. Ownerless dogs Table 3. Owner-stated reasons for non-participation in the campaign
Reason Persons Previous study (%) (n) % Lack of money 82 25 — Not informed 84 26 11–26*
Other owner-related reasons 51 16
Lack of time 15 5
No interest 17 5
Expected a door-to-door campaign 11 3
Thought vaccination only for aggressive dogs 1 0
Against the campaign 7 2
Dog-related reasons 88 27 18–35#
Recently vaccinated 60 18 10–17
Less than 3 months old 12 4
Illness ; ‘ too old ’ 3 1
Dog not manageable 13 4 19–35
Unknown reason 23 7
Total 328 100
* Owner-specific reasons (not informed and lack of time).
# Dog-specific reasons (age, recent birth of puppies, illness, escape from home on vaccination day).
are inaccessible for parenteral vaccination, but they are estimated to be, on average, <15% of the total dog population.
Study limitations
The biggest limitation of this study is that we were unable to link the costs of vaccination campaign to
any human public health benefit. Indeed, with only 25 % vaccination coverage, it is possible that this (se-cond) campaign did not produce any reduction in risk of human rabies. Vaccination coverage was estimated by a Bayesian model (see Appendix 1, online), which explicitly considers uncertainties of questionnaire information such as dog confinement and the esti-mation of percentage ownerless dogs.
Table 4. Campaign cost comparisons : owner-charged vs. free vaccination
Owner charged (new study)* Free vaccination (previous study)* Prices in FCFA# % of total societal cost Prices in FCFA# % of total societal cost Public sector
Vaccine, syringe, certificate, collar, receipt 223 460 0.06 1 731 218 0.31
Human pre-prophylaxis vaccination$ 291 700 0.08 291 700 0.05
Equipment of vaccination point 564 291 0.15 368 300 0.07
Salaries· 1 687 200 0.46 897 500 0.16
Transport 404 000 0.11 400 000 0.07
Information 326 000 0.09 330 000 0.06
Income from animal owners x786 000 x0.21 0 0.00
Total public sector 2 710 651 0.73 4 018 718 0.73
Private sector
Working loss and transport 196 500 0.05 1 500 000 0.27
Vaccination cost 786 000 0.21 0 0.00
Total private sector 982 500 0.27 1 500 000 0.27
Societal cost"
Total 3 693 151 5 518 718
Number of animals vaccinated 393 3000
Average cost per animal vaccinated
Public sector 6897 1340
Private sector 2500 500
Societal cost 9397 1840
Total cost (US$)
Public sector 5595 8295
Private sector 2028 3096
Societal cost 7623 11 391
Cost per animal vaccinated
Public sector 14.24 2.76
Private sector 5.16 1.03
Societal cost per vaccinated animal (US$) 19.40 3.80
Incremental cost per extra animal vaccinated in free vaccination campaign||
1.45
* Owner-charged campaign had 10 vaccination points and ran for a total of 9 days ; free vaccination campaign had 8 vaccination points and ran for a total of 5 days.
# 1000 FCFA=US$2.064 (http://www.oanda.com/convert/classic). $ All 20 vaccination workers received three doses each.
· Daily cost per vaccination point 22 440 FCFA in the owner-charged campaign, 18 750 FCFA in the free vaccination campaign.
" Societal cost=public cost+private cost.
|| Incremental cost-effectiveness ratio calculated as increased costs (costs in free campaign minus costs of owner-charged) divided by the increase in number of animals vaccinated (number vaccinated during free campaign minus number vaccinated during owner-charged campaign).
Although the two campaigns were organized using the same principles and in the same districts, there were several differences between the two (e.g. in area covered, number of vaccination points, and duration of the campaigns). However, since the dog and human population densities, were about the same for both campaigns, the impact of the two campaigns can be directly compared. Another difference between the campaigns is that the 2006 campaign spent about twice the amount of the first campaign on salaries. The increased salaries were due to the different number of vaccination points and working days during the campaign (Table 4, se-cond note). The equipment costs for the 2006 cam-paign were also greater than the previous camcam-paign. Future campaigns have the potential of reducing costs by more closely monitoring the number of vac-cination points, workers hired and salaries paid. Another limitation in extrapolating these results to future campaigns is that, in both campaigns, vaccine was valued ‘ at cost ’ (without a profit margin for the wholesalers). Vaccines may cost more in future cam-paigns.
This study, and the previous free vaccination study, each only measured the costs and impacts from one vaccination campaign. Since rabies in African countries is often endemic in animal populations other than dogs, and rabies vaccine provides time-limited protection (y1 year), there is always a danger of a rapid re-introduction of rabies in dog popu-lations if vaccination rates fall below the WHO re-commended rate of 70 %. Thus, in Africa, there is a need to have annual dog rabies vaccination cam-paigns to ensure the WHO recommendation is met. This study did not measure the costs associated with conducting routine annual vaccination cam-paigns.
Owner participation in this vaccination campaign may have been influenced by the previous free vacci-nation campaign that was held in the same area (albeit 4 years earlier). This earlier campaign could have increased (higher disease awareness or recog-nition of the benefits of vaccination) or decreased (people expect free vaccination) participation. We were unable to measure or account for such effects.
C O N C L U S I O N S
Dog vaccination is a feasible and comparatively cheap method to control rabies in endemic countries
[15, 24]. However, this study showed that relying on campaigns in which owners are charged for each ani-mal vaccinated will probably result in vaccination rates much lower than the WHO recommended rate of 70 %.
The results from this study can be used in future economic analyses examining the costs and benefits of dog vaccination campaigns. Such studies should explicitly take into account the reduction in human rabies cases resulting from increased dog rabies vac-cination rates. The differences between this campaign and the previous campaign in fixed costs, such as sal-aries, transport and equipment, illustrate that it is es-sential that methods be developed to adequately control fixed costs. If fixed costs are not successfully controlled, then potentially cost-effective methods, such as ‘ free vaccination for dog-owners campaigns ’, of achieving vaccination coverage rates of 70 % will not be affordable for government budgets. Without a political commitment, leading to rabies elimination, rabies will remain endemic in African cities, leaving millions of people in fear of exposure, and often without the hope of access to effective post-exposure treatment.
A P P E N D I X A
Table A1. Prior distribution for recapture and confinement probabilities in the two vaccination zones
Zone 1* Zone 2 Zone 3
Recapture probabilities pt(i)# 0.056–0.54 0.084–0.54 Coverage (Ci) 0.089–0.60 0.133–0.60 Encountering (Ei) 0.70–0.90 0.70–0.90 Recording (Ri) 0.90–0.99 0.90–0.99
Confinement of owned marked dogs, c1(i)$ Beta (a, b)(i)
a 5.554 6.740
b 13.866 14.127
Confinement of owned unmarked dogs, c2(i)$ Beta (a, b)(i)
a 2.893 3.498
b 11.866 12.549
* Due to flooding following torrential rain, we were unable to survey dogs, and thus estimate vaccination coverage, in zone 1.
# pt(i)=Ci* Ei* Ri.
$ c1 for marked dogs, c2 for unmarked dogs, a and b reflect shape parameter of the beta-distribution with mean=a/(a+b).
Table A2. Comparison of the posterior mean estimates of recapture and confinement parameters of the two campaigns : owner charged(new) and free vaccination (previous), respectively*
Zone 2# Zone 3 Owner charged (new study) Free vaccination (previous study) Owner charged (new study) Free vaccination (previous study) Recapture probabilities pt(i)$
t1 0.15 (0.07–0.23) 0.29 (0.22–0.38) 0.14 (0.10–0.20) 0.32 (0.24–0.41)
t2 0.22 (0.10–0.33) 0.23 (0.19–0.31) 0.21 (0.15–0.28) 0.29 (0.23–0.37)
t3 0.23 (0.11–0.34) 0.25 (0.20–0.34) 0.22 (0.16–0.30) 0.24 (0.22–0.30)
t4 0.22 (0.10–0.33) 0.22 (0.19–0.29) 0.17 (0.12–0.24) 0.32 (0.24–0.41)
Confinement probabilities of owned dogs·
c1(i)· 0.53 (0.22–0.73) 0.47 (0.47–0.60) 0.30 (0.15–0.46) 0.48 (0.37–0.60) c2(i)· 0.15 (0.03–0.36) 0.46 (0.29–0.63) 0.29 (0.11–0.48) 0.38 (0.22–0.55) Values in parentheses are 95 % credibility intervals.
* Detailed explanation for parameters see Appendix 1 (available online). # Transect for the cost campaign not done in zone 1.
$ i=zone, t=transect line, higher probability equates higher chance to see the dogs.
· c1 for marked dogs, c2 for unmarked dogs ; higher confinement probabilities equate with better rabies control.
N O T E
Supplementary material accompanies this paper on the Journal’s website (http://journals.cambridge.org/ hyg).
A C K N O W L E D G E M E N T S
We thank all international institutions, collaborators and campaign workers who contributed to this study and ensured its success through teamwork. We also thank the reviewers for their constructive comments that improved the manuscript. We thank the study sponsors : The Swiss Federal Veterinary Office, the Wolfermann-Na¨geli Foundation, the Commission for Research Partnership with Developing Countries and the Emilia Guggenheim-Schnurr Foundation. We ac-knowledge the Swiss National Centre of Competence in Research (NCCR) North-South for co-funding the study supervisor (J.Z.). Merial donated the doses of canine antirabies vaccine, for which we are grateful. The findings and conclusions in this paper are those of the authors and do not necessarily represent the views of the Centers for Disease Control and Prevention.
D E C L A R A T I O N O F I N T E R E S T None.
R E F E R E N C E S
1. Knobel DL, et al. Re-evaluating the burden of rabies in Africa and Asia. Bulletin of the World Health Organization2005 ; 83 : 360–368.
2. Wandeler AI, et al. The ecology of dogs and canine rabies : a selective review. Revue Scientifique et Tech-nique(International Office of Epizootics) 1993 ; 12 : 51–71. 3. World Health Organization (WHO). WHO expert con-sultation on rabies. Database (http://www.who.int/ rabies/trs931_%2006_05.pdf). 2005.
4. Cleaveland S, et al. Estimating human rabies mortality in the United Republic of Tanzania from dog bite in-juries. Bulletin of the World Health Organization 2002 ; 80 : 304–310.
5. Babe`s V. Traite de la Rage [Trekatise on rabies]. Paris : J. V. Baillie`re et Fils, 1912, pp. 81–119.
6. Willoughby RE Jr, et al. Survival after treatment of rabies with induction of coma. New England Journal of Medicine2005 ; 352 : 2508–2514.
7. Coleman PG, Dye C. Immunization coverage required to prevent outbreaks of dog rabies. Vaccine 1996 ; 14 : 185–186.
8. Flamand A, et al. Eradication of rabies in Europe. Nature1992 ; 360 : 115–116.
9. Zanoni R, et al. Rabies-free status of Switzerland fol-lowing 30 years of rabies in foxes. Schweizerisches Archiv fu¨r Tierheilkunde 2000 ; 142 : 423–429.
10. Cleaveland S, et al. Canine vaccination – providing broader benefits for disease control. Veterinary Micro-biology2006 ; 117 : 43–50.
11. Takayama N. Rabies control in Japan. Japanese Journal of Infectious Diseases2000 ; 53 : 93–97.
12. Centers for Disease Control and Prevention (CDC). Notice to readers : world rabies day – September 8,
2007. Morbidity and Mortality Weekly Report 2007 ; 56 : 915.
13. Du¨rr S, et al. Rabies diagnosis for developing countries. PLoS Neglected Tropical Diseases2008 ; 2 : 206. 14. Kayali U, et al. Coverage of pilot parenteral vaccination
campaign against canine rabies in N’Djamena, Chad. Bulletin of the World Health Organization 2003 ; 81 : 739–744.
15. Kayali U, et al. Cost-description of a pilot parenteral vaccination campaign against rabies in dogs in N’Djamena, Chad. Tropical Medicine & International Health2006 ; 11 : 1058–1065.
16. Kaare M, et al. Rabies control in rural Africa : Evaluating strategies for effective domestic dog vacci-nation. Vaccine 2009 ; 27 : 152–160.
17. Edelsten RM. Epidemiology and control of rabies in Malawi. Tropical Animal Health and Production 1995 ; 27 : 155–163.
18. Division of Health Information System. Annual Health Statistics for Chad, 2001 [in French].
19. Mindekem R, et al. Impact of canine demography on rabies transmission in N’Djamena, Chad [in French]. Me´dicine Tropicale2005 ; 65 : 53–58.
20. Mindekem R. The geography of risk factors of rabies transmission in urban settings : the case of N’Djame´na, Chad [in French] (Dissertation). Montpellier, France : Universite´ Paul-Valery, U.F.R. III, 2003.
21. Caughley G. Petersen estimate. In : Caughley G, ed. Analysis of Vertebrate Populations. New York : J. Wiley & Sons, 1979, pp. 141–145.
22. Du¨rr S, et al. Owner valuation of rabies vaccination of dogs, Chad. Emerging Infectious Diseases 2008 ; 14 : 1650–1652.
23. World Health Organization (WHO). National Health Accounts database (http://www.who.int/nha/country/ en/index.html), 2007.
24. Bo¨gel K, Meslin FX. Economics of human and canine rabies elimination : guidelines for programme orien-tation. Bulletin of the World Health Organization 1990 ; 68 : 281–291.