Creating the Wholesale Market for Electricity in Japan: What Should Japan Learn from Major Markets in the United States
and Europe?
by
01-005 July 2001
Takahide Hori
Creating the Wholesale Market for Electricity in Japan: What Should Japan
Learn from Major Markets in the United States and Europe?
Takahide Hori
1June 2001
Abstract
The movement of deregulation in Japan’s electric power industry started in 1995 with the revision of the Electric Utility Industry Law. During these past over five years, levels of various discussions have been made in Japan, but remarkable changes of market structure have not appeared except for so far little utilized provision allowing large industrial customers to be supplied by suppliers other than 10 incumbent Electric Power Companies (EPCOs). The big problem confronting deregulation in Japan is the potential market power of these vertically integrated, regionally franchised utilities. This paper proposes the first step to deregulate Japan’s electric power industry at the wholesale level in Japan and of policy lessons from four major deregulated markets: California, PJM, England and Wales, and Norway.
1
Electric Power Development Co., Ltd., and a visiting researcher at the Center for Energy and Environmental Policy Research at the Massachusetts Institute of Technology. The author would like to express deepest thanks to Dr. A. Denny Ellerman for his support and helpful discussions.
1. Introduction
Retail competitive bidding for the direct electricity supply to the office building of the Ministry of International Trade and Industry (MITI, now the Ministry of Economy, Trade, and Industry, or METI) took place on August 10, 2000—the first time competitive bidding was used at the retail level in the history of the Japanese electric utility industry. Although the revised Electric Utility Industry Law was enacted to implement direct access to large industrial customers on the 21st of March, 2000, it was not until almost five months later that this first contract under the new system came under agreement. Three companies—Tokyo Electric Power Co. (TEPCO), Tohoku Electric Power Co. (ToEPCO), and Diamond Power Corporation—offered bids. Diamond Power Corporation, an affiliate of Mitsubishi Corporation, was awarded the contract for approximately $245,400 for 14,650 MWh ($50,600 per month of demand charge, and 11.7 cents per kilowatt-hour of electricity charge).2 That price was reported to be 4% lower than the previous contracted price with TEPCO. The tone of newspaper articles after the bidding seemed in general to welcome this result.
However, as many analysts have pointed out, many controversial issues remain in this case. In fact, Itochu Corporation and Tokyo Gas Company had to forego bidding in the above instance because of the high transmission access charge and strict safety regulations on assets’ specifications. And the mere 4% price reduction achieved may be said to have been far from both customer’s and the regulators’ expectations for direct access.
Generally speaking, the price of electricity cannot be reduced satisfactorily simply by opening third parties’ direct access to the transmission network, for several main reasons: 1) the market is completely monopolized by EPCOs within the franchise area, 2) the number of market players is fundamentally very small, 3) transmission access is restricted in terms of preserving the transmission network’s reliability, especially. More importantly, Japan technically has no electric power “market,” as yet. Rather, vertically integrated utilities manage (or completely control, in most cases) the overall electricity supply. I believe that the first step to accelerate deregulation properly and to promote competition in Japan’s electric utility industry is to find a way to create substantial, well-functioning energy markets, which will involve mitigating the formidable market power exercised by vertically integrated utilities.
2
In terms of market structure, competition in the electric power sector may be of two sorts: wholesale competition and retail wheeling competition.3 In most cases around the world, restructuring at the wholesale level to open direct access to the transmission network has been the first step in deregulation, followed by retail wheeling restructuring. I therefore concentrate on the wholesale level in my discussions of deregulation here, as a logical entry point to the debate for Japan. Throughout this report, therefore, “market” should be assumed to mean “wholesale market,” except as noted otherwise.
This report consists of two sections. The first briefly describes and analyzes four major deregulated markets in the United States and Europe: California, the Pennsylvania–New Jersey–Maryland Interconnection (PJM), the United Kingdom, and Norway.4 These analyses of actual deregulated markets can offer clues to the Japanese electric utility industry, which has just begun to deregulate, about how best to do so, through careful consideration of the successes and errors of those who have gone before. Although deregulation was implemented much earlier in both Europe and the United States than in Japan, the regulatory authorities in those countries are still struggling to come up with the optimal scheme for implementation. Japan can learn much from their successess and mistakes.
The second section of this report turns to Japan’s situation, starting with a summary of the existing electric power market, proceeding to an examination of what may be the best possible course for Japan’s deregulation to take, and concluding with a proposal of one possible way to create a competitive market in Japan, including concrete steps.
3
Brennan et al. (1996), p.40. 4
In this report, from this point forward, “the UK electric utility industry” and “the UK market” refer primarily to the industry in England and Wales.
2. Deregulation Policy Lessons from Major Electric Power Markets in the United States
and Europe
Countries’ primary goal in deregulating their electric power industries is to lower the price of electricity by maximizing use of the market function. Regulatory authorities and new market entrants expect deregulation to optimize the electricity market structure, functionalizing the market on the basis of free-trade market principles. Regulators also hope to mitigate the centralized market power of incumbent utilities to promote competition. Many countries that have decided to reform their electric power markets are struggling to install a new scheme to set up competitive, effective, and vital electric power markets by trial and error through various arrangements and adjustments between theory and practice, implementing corrections as deemed to be necessary.
Especially at the wholesale level, various electric power trading structures have appeared since the tsunami of deregulation and liberalization surged over countries’ electric power sector in the late 20th Century. Those market models are, in most countries, formed by a combination of the concepts power pool, bilateral
contracts over the short & long terms, power exchange (“PX,” or spot trading), and power derivatives
(primarily financial transactions).
It would be difficult for a paper such as this to address all the issues facing countries that are even yet seeking solutions, yet several important points can be made about deregulation. This chapter introduces four fairly typical market models operating in the United States and Europe, where the most aggressive structural changes are now occurring. For each market, endemic characteristics and problems encountered are outlined to suggest what may have happened and how countries have dealt with the challenges introduced by competition. The various markets have their own unique cultural and economic backgrounds and problems, so no clear solutions for other countries embarking on deregulating their electric power sector may seem to be indicated. I believe, however, that analyzing the more mature markets’ various issues offers understanding, providing countries such as Japan that are contemplating a move toward deregulation a better view of what might be expected from such a change.
1.1. California
1.1.a. Legislative Background5
The first legislation to open the door to wholesale market deregulation of the electric power sector in the United States was the Public Utility Regulatory Policies Act (PURPA) of 1978. The act is well known for creating a new category of power supplier, the qualifying facility (QF), promoting the supply of power from non-utilities, especially through cogeneration and renewable energy sources. After PURPA took effect, host utilities were required to purchase power supplies from qualifying facilities at avoidable cost and to integrate them into their incumbent systems.
But the regulations that substantially opened the market and expanded competition at the wholesale level were Orders 888 and 889, issued by the Federal Energy Regulatory Commission (FERC) on April 24th, 1996. These regulations put into effect the Energy Policy Act (EPACT) of 1992, which accelerated the deregulation that had been launched by PURPA.6 Order 888 required transmission owners to provide third parties access to their transmission network at cost-based maximum prices and under nondiscriminatory terms and conditions,7 through their own Open Access Transmission Tariff (OATT). To support implementation of Order 888, Order 889 was issued simultaneously, requiring all investor-owned utilities (IOUs) to participate in the Open Access Same-Time Information System (OASIS), an Internet-based database system.
On the basis of FERC Order 888, California enthusiastically and aggressively moved to restructure its electric utility industry. After several years of study under the direction of the California Public Utility Commission (CPUC), Assembly Bill 1890 (AB 1890) was enacted in California on September 23rd,1996.8 To implement competition in an electricity market system within the state, AB 1890 established a four-year transition period, then launched retail competition, allowing customers to shop for electric power in an open market as of March 31st, 1998. Since then, independent power producers (IPPs), out-of-state utilities, and others have competed as energy service providers (ESPs).
AB 1890 also allowed stranded costs to be recovered through competition transition charges (CTC) by adding to the Public Utilities Code a Section 368, which requires utilities to propose cost-recovery plans to the
5
This description is based on Department of Energy, Energy Information Administration (DOE/EIA) (2000a) and Joskow (2000), pp.79–91. 6 Brennan et al (1996), p.31. 7 Joskow (2000), p.28. 8
Public Utilities Commission (PUC) and directs the PUC to authorize such plans if certain criteria are met. At the same time, AB 1890 ordered the retail rates of regulated IOUs for industrial, large commercial, and agricultural customers to be frozen at the 1996 level. As for small commercial and residential customers, rates were reduced by 10 percent, where they were to remain until March 31, 2002, at the latest.
Through AB 1890 also, California’s three largest IOUs were required to divest their fossil-fuel generation assets to mitigate their market power. As a result, a large number of generation plants were sold, with a capacity of 20,187 MW. 9
1.1.b. Market Structure10
While the California electricity market was still regulated, it was monopolized by the three largest IOUs: Pacific Gas and Electric Co. (PG&E), Southern California Edison (SCE), and San Diego Gas and Electric Co. (SDG&E), which are vertically integrated and regionally franchised. The primary goal for CPUC when issuing AB 1890 to achieve full competition in the market was to mitigate the monopolistic market power of the three largest IOUs, vertically or horizontally, providing new market players equal opportunities to capture customers for their electricity supplies. Now, California's IOUs (PG&E, SCE, SDG&E) are local utility distribution companies (UDCs). The UDCs continue to provide regulated distribution service, but no longer control their transmission systems.
Power exchange11
To achieve its intended goal, described above, CPUC adopted a new market system that borrows heavily from the United Kingdom’s “pool model.” Under this system, the wholesale market in California consisted mainly of spot electricity trading through the California Power Exchange Market (CalPX) and a bilateral contracting market that was managed by scheduling coordinators (SCs). To encourage spot trading as well as bilateral contracts-based trading, a single-state-based PX market called the Western Electric Power Exchange (WEPEX) was formed. Unlike the United Kingdom’s pool model, the state of California detached functions of this generation spot market system from the California ISO (Ca-ISO) grid operation, and WEPEX handled the wholesale power spot market on a day-ahead basis only. Although new entrants were allowed bilateral contracts,
9
This capacity figure was taken from <http://www.energy.ca.gov/electricity/divestiture.html>. 10
The following description is based on Philipson and Willis (1998), the Ca-ISO web site, and the California Power Exchange web site.
11
the three largest UDCs were mandated by AB 1890 to both sell all their non-fossil-fuel generated power and to make all their power purchases through the newly created Power Exchange (PX) during a four-year transition period ending March 31, 2002.12
CalPX managed two exchange-based “spot” markets. As of fall 1999, approximately 70 entities from the United States and Canada were certified to trade through CalPX. In the Day-Ahead Market, participants bid supply and demand for the next day’s 24 hours. The Day-ahead Market started at 6 a.m. the day ahead of trading day, and closed at 1 p.m. the day ahead of trading day, when the ISO issued the final day-ahead schedule. The second CalPX market was the Day-of Market (originally introduced as the Hour-ahead Market). This market permitted participants to conduct energy transactions nearer to the delivery hour, when generation and energy use conditions may require changes in trading positions. The Day-of Market included 24 auctions conducted in three batches during the course of a day—at 6 a.m., noon, and 4 p.m.13
Independent system operator
At the same time CalPX was established, the California Independent System Operator (Ca-ISO), a fully independent, non-profit entity, was established to better ensure a reliable transmission network and mitigate any vertical market power exerted by the IOUs. Unencumbered by asset ownership, the ISO assumed from the transmission owners oversight of the power grid’s operations and responsibility for the transmission network’s reliability, and offered all potential market players equal access to the power grid. Under ISO, three types of supplemental open-competition markets help to maintain reliability of the grid: a Real-Time Imbalance Market, an Ancillary Service Market14, and a Congestion Management Market the last of which allocates physical power transmission to the various users to mitigate congestion.15
The ISO establishes protocols to certify parties as SCs, which are responsible for submitting schedules to the ISO for all buyers and sellers. Each market participant using the grid is required to designate a scheduling coordinator; prior to December 2000, the PX was the designated scheduling coordinator for the UDCs.
12
To deal with the energy crisis, in December 2000, FERC ordered remedies for California wholesale power markets, which eliminated the mandatory requirement that UDCs transact all the electricity through the CalPX.
13
The California Power Exchange White Paper, “The Basics: How the CalPX Works,” December 1996, is also available at the web site of CalPX, <http://www.calpx.com/news/publications/index.htm>.
14
There are four types of competitive, auction-based markets: regulation, spinning reserves, non-spinning reserves, and replacement reserves.
15
To facilitate this allocation, the Cal ISO accepts “adjustment bids” a day ahead and an hour ahead of when electricity is consumed. In the case that market participants do not make sufficient bids, congestion charge would be levied as long as the situation of the scheduled heavy use over the transmission capacity continues.
One distinguishing feature of California’s electric power market is that the system operator is completely separate from the PX market function. This system differs from that in other market areas such as Pennsylvania–New Jersey–Maryland Interconnection (PJM), as it was reached through political compromise and regulatory necessity rather than through agreements among market participants and regulatory authorities.16 A simplification of California’s market structure is shown in Figure 1.
Transmission pricing methodology
The Ca-ISO has adopted a “postage stamp” approach, with twenty-four adjustable congestion zones, as its pricing method to manage congestion. In an unconstrained situation, all congestion zones have the same rate without zonal charges. During congested periods, established prices within each zone supersede CalPX’s unconstrained market clearing price (UMCP), which is based on the aggregated energy supply and demand curves’ point of intersection for each hour.
16
1.1.c. California’s Energy Crisis: The Demise of Deregulation?
Turmoil in the California electricity market began in May 2000. During the summer, a series of misfortunes, including a heat wave, sharp economic growth, gas price spikes, and a water shortage struck California simultaneously in the “Perfect Storm,” and the wholesale price of electricity has remained abnormally high. Northern California has suffered periods of rolling blackouts because of serious energy shortages. California’s UDCs have also struggled against sizable gaps between retail rates frozen at low prices and high wholesale prices; an especially serious case precipitated the bankruptcy of one UDC in April 2001.
Since many other papers offer explanations of what has been happening in the California market, I do not detail the facts here. However, for countries that have recently introduced the California system of deregulation or that are on the verge of doing so, the reason why the California system collapsed should be seriously considered as a case study, not simply unwelcome news. Is the California system clearly doomed to fail? Does this case portend the demise of deregulation? If not, what should we learn from the crisis?
Figure 1. California's competitive electricity market structure
As already mentioned, California’s energy crisis may have been precipitated by the confluence of several very inopportune circumstances; alternatively, the crisis may have been inevitable because of a fatal flaw in the market system. California’s energy crisis has, in fact, been linked to three fundamental causes: 1) deficient generating capacity, 2) a market system that does not permit enough forward market trading to manage the risks of supply and demand, and 3) insufficient customer response to high prices.17 Among these factors, California’s energy-deficient market, generating only 75% of the total capacity of electricity consumed, is especially crucial: In the words of Wilson (2001), “in real world electricity market, when supplies are tight, conditions are often not competitive, and bids and prices are typically very high.”18 In other words, given adequate supply, a market becomes competitive to some degree, no matter what sort of system is employed.
Besides the insufficiency of California’s energy generation, inconsistent price regulation must be considered another failure of the California system. Since wholesale prices are regulated with price caps while retail rates remained frozen, price signals weren’t sent properly to customers, severely limiting the function of the market mechanism. To make matters worse, the UDCs whose retail rates were frozen suffered an intolerable rate gap with wholesale prices, to the point of insolvency. Some electric power suppliers chose not to supply power to these unfortunate UDCs for fear of non-payment, essentially pouring oil on the flames of California’s energy deficit.
As a consequence, California’s case is not proof that an electric utility industry cannot adjust to deregulation policy. Rather, this crisis has had endemic causes. Deregulation can succeed only in a properly functioning market, one in which market signals are correctly reflected to both suppliers and consumers, the electricity supply is sufficient to meet demand, and the system can be expected to operate reliably.
17
DOE/EIA (2000a). 18
1.2. Pennsylvania–New Jersey–Maryland Interconnection L.L.C.(PJM)
1.2.a. Brief History of PJM and Pennsylvania Legislation19
PJM was formed by three companies in 1927 as the world’s first power pool. It has evolved over seven decades on a “tight” power pool model, functioning as one control area20. In July 1993, the PJM Interconnection Association was established under the administration of the PECO Energy Company (PECO). In July 1996, soon after FERC Order 888 was issued, a majority of the member companies (called the “Supporting Companies”21 of the Association) filed interconnection agreements and a transmission tariff with FERC to restructure PJM, establishing a new competitive wholesale electricity market. The agreement specified that the Association would function as the ISO.
In April 1997, the PJM Interconnection Association became a limited-liability company, offering membership to all participants in the wholesale electricity industry and at the same time implementing Open Access Transmission Tariff (OATT) to begin operating the first bid-based electricity market in the United States. On November 25th, 1997, a restructuring plan of PJM as revised in July 1997, describing PJM as an ISO and manager of OATT, was approved by FERC.22 Becoming operational in January 1998, PJM-ISO became the first full-service and fully functioning ISO in the United States. In May 1999, it implemented the Fixed Transmission Rights (FTR) Auction.
Like California and Massachusetts, Pennsylvania, with the largest number of customers in the PJM operating area, “falls into the camp of relatively high-priced States that have been somewhat aggressive in restructuring”.23 In December 1996, Pennsylvania enacted HB 1509, called the “Electricity Generation Customer Choice and Competition Act.” The Act froze rates as of January 1997 and phased-in retail customer choice, such that 33% of customers could choose their electricity supplier by January 1998, another 33% could do so by January 1999, and the remaining 34% could do so by January 2000. All customers in Pennsylvania can now choose their generators and expect to realize savings of more than 10% of what they paid in the past.
19
The following description is based on PJM Annual Report (1997, 1998, and 1999), PJM training materials, DOE/EIA (2000a), pp.88-89, Mansur (2001), and Williams (1997).
20
For the definition of “tight” and “loose” power pool, see <http://www.ncouncil.org/pubs/pool.html> 21
Supporting Companies comprise the following: Atlantic City Electric Company (Atlantic City Electric), Baltimore Gas and Electric Company (BG&E), Delmarva Power & Light Company (Delmarva), Pennsylvania Power & Light Company (PP&L), Potomac Electric Power Company (PEPCO), Public Service Electric and Gas Company (PSE&G), and GPU, Inc. (GPU, which consists of Jersey Central Power & Light Company (JCP&L), Metropolitan Edison Company (Met Ed), and Pennsylvania Electric Company (Penelec)).
22
PJM-OATT was most recently amended and approved by FERC on March 1st, 2000. 23
This retail-level restructuring took place first in Pennsylvania, then in Delaware, New Jersey, and Maryland, consecutively.
In terms of stranded-cost recovery, the PUC is authorized to determine the level of stranded costs that each utility is permitted to recover. The PUC set a maximum period of nine –years for CTC collection, also permitting PUC approval of an alternative time frame, in contrast to the four-year period set in California.
1.2.b. Market Overview
PJM is the oldest and largest centrally dispatched “tight” power pool in the United States, and the third largest in the world, with a pooled generating capacity of over 57,000 megawatts transmitted over an 8,000-mile extra high voltage (EHV) transmission network. Geographically, it supplies electricity to Pennsylvania, Maryland, New Jersey, Virginia, Delaware, and the District of Columbia, and handles approximately 8% of the country’s electric power, via a centralized market. It is unique in that only one control area (containing six-state jurisdictions) falls in a region served by the North American Electric Reliability Council (NERC).
PJM adopted a sort of Poolco system, with functions of both ISO and PX combined, unlike Ca-ISO, because “the pool infrastructure to operate a competitive energy market already exists here and the separation proposed would be inherently less efficient and reliable”.24 PJM comprises four markets: a capacity credits market (CCM), an energy market, a financial transmission entitlements market, and an ancillary services market.
Capacity credits market (CCM)25
Capacity obligations play a critical role in both maintaining reliability and contributing to the PJM energy market’s effective, competitive functioning
. C
apacity obligations require load-serving entities (LSE)26 to purchase sufficient capacity resources to cover their peak load plus a reserve margin to better ensure system reliability. Retail restructuring allowed new market entrants to compete against incumbent utilities if the new entrants can offer sufficient capacity to meet loads gained through the competitive process.27 Incumbent utilities must sell capacity that is no longer need if any of their loads are lost to new competitors. The PJM24
Williams (1997). 25
The following description is based on Bowring and Gramlich (2000) and Stoft (2000). 26
An LSE is any utility that sells power at retail to loads within the PJM control area. 27
According to Bowring and Gramlich (2000), capacity resources may be obtained in three ways: by building or purchasing generation assets, through the bilateral market, and through the PJM CCM.
CCM balances capacity supply and demand not met by the bilateral market or self-supply.
Energy market
PJM adopts various flexible options for physical energy transactions, supported by a variety of financial contracts separate from the physical market. PJM energy markets combine a bilateral contracting market, physical spot market, and financial energy contracting market. In PJM markets, most electricity is supplied by vertically integrated utilities as self-supplied energy (about 55%) and through bilateral trading (30%). LSEs meet only 10 to 15 percent of demand in the spot markets28, while CPUC in California, in contrast, requires all UDCs’ electricity purchases to be made through the PX market.
PJM also differs from California’s market by permitting forward transactions to any of its market players. Such transactions occur through the New York Mercantile Exchange. And to enhance the robust, competitive market in the PJM control area, two settlement markets are provided: a Day-ahead Market, based on scheduled hourly quantities and day-ahead hourly prices, and a Real-time Energy Market that is based on actual hourly quantity deviations from the day-ahead scheduled hourly quantities and real-time prices.
Financial transmission entitlements market
PJM introduced an auction-based Financial Transmission Rights (FTRs) market on May 1st, 1999. To protect “firm” transmission customers from increased costs due to transmission congestion, PJM established the FTR, a financial contract entitling the holder to a stream of revenues based on the hourly energy price differences across the path of transmission.
Ancillary services market
In the PJM area, only a frequency regulation market has been implemented as an ancillary service since June 1st, 2000. Unlike the case in California, market interactions for ancillary services have not yet been determined for the PJM area. PJM is responsible for such other services as real-time imbalance settlement and voltage control.
1.2.c. Pricing Methodology in the PJM Control Area
Locational marginal pricing (LMP), also known as locationally based marginal pricing (LBMP), is the
28
pricing method adopted by PJM. LMP determines the marginal cost of supplying the next increment of electricity demand at a specific location (node) on the electric power network, taking into account both generation marginal cost and the transmission system’s physical aspects. Thus, the PJM energy market can include thousands of different locational prices at a given time. PJM LMP is calculated by the following formula:
• LMP = marginal cost (MC) + transmission congestion cost (TCC)29
Under unconstrained conditions, the price of energy in bilateral contracts can be determined by simply charging a flat transmission fee on the generation charge. In the spot market, the LMP equals the bid price of the highest increment of generation that is requested for operation.30
1.2.d. Is PJM the Most Successful Electricity Market?
The biggest state within the PJM control area, Pennsylvania, was ranked No.1 in the nation for the success of electricity deregulation on 7th February 2001. More than a little credit is due to its well-functioning PJM grid operator. Because of PJM, the market has worked well and phase-in to customer choice has been implemented successfully.
PJM is now considered to be one of the best competitive electricity markets in the world. The Herfindahl-Hirschman Index (HHI) of only 1,124 suggests that a good, homogeneous market containing several firms of similar size is unlikely to exhibit market power31; remarkably, the six largest utilities in PJM account for only ten to twenty percent of the market’s capacity. Furthermore, as represented by Pennsylvania PUC, PJM is confident that its area will not suffer from a severe energy crisis analogous to that in California because PJM holds much more electricity capacity than is consumed, states in the PJM control area were not required to divest their generation assets, and participating utilities are not prohibited from committing to long-term contracts. This very positive situation enabled PUC Chairman John M. Quain to say, “Before electric choice, Pennsylvania electric rates were 15 percent above the national average, and now our rates are 4.4 percent below the national average. And state government is saving taxpayers money, too, by shopping for power.”
29
Strictly speaking, the cost of marginal loss (COML) must be added to (MC + TCC), but this is not currently implemented. 30
Vactor (2000). 31
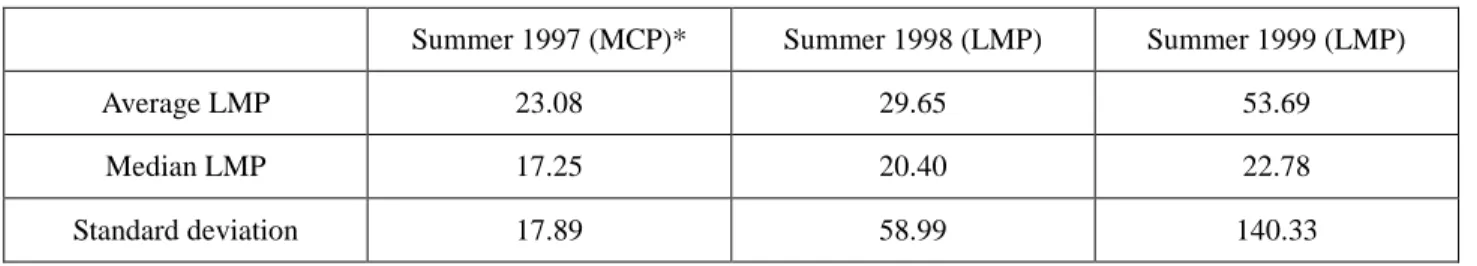
However, a few points must be kept in mind. According to Market Monitoring Units (MMU) (2000), LMP increased between 1997 and 1999. Tables 1, 2, and 3 show that LMP did increase slightly. After careful analysis, MMU concluded that scarcity could be responsible for some of this price increase, but market power also played a part; the relative proportions of these two factors are unclear.32 Regarding market power, Dalton (1997) observed that frequent auctions for a homogeneous product under similar demand and supply conditions tend to facilitate collusion. The present case shows that price spikes caused by either scarcity or market power may occur even in PJM markets. The MMU data also suggests that some firms may have exercised market power to raise the price of electricity.
Generally eastern markets, especially PJM, are said to be successful. PJM, however, may only “have had better luck than California with regard to demand growth, fuel mix, and capacity availability. …all of these regions now face a potentially tight supply situation during the peak summer season this year.”33 Awarding PJM a blue ribbon at this point may thus be premature. In fact, PJM still experiences problems with market power and price spikes on its spot market. I think that taking a little more time to gather data is warranted to determine whether PJM markets are truly successful.
Table 1. Average Daily LMP Summary Statistics ($/MWh)
Source: MMU (2000)
Summer 1997 (MCP)* Summer 1998 (LMP) Summer 1999 (LMP)
Average LMP 23.08 29.65 53.69
Median LMP 17.25 20.40 22.78
Standard deviation 17.89 58.99 140.33
* MCP = market clearing price
Table 2. April-March, 1998-1999 and 1999-2000 LMPs ($/MWh)
Source: MMU (2000) 1998–1999 1999–2000 % Increase Average LMP 22.04 29.53 33.99 Median LMP 16.93 18.37 8.49
32 MMU (2000), p.18. 33 Joskow (2001).
Standard deviation 31.38 72.64 131.52
Table 3. April–March, 1998–1999 and 1999–2000 Fuel Cost Adjusted LMPs ($/MWh)
Source: MMU (2000)
1998–1999 1999–2000 % Increase
Average LMP 22.04 28.64 29.95
Median LMP 16.93 17.37 2.57
1.3. United Kingdom: England and Wales
1.3.a. From an Era of Nationalization to Privatization34
Restructuring of the electric power sector in the United Kingdom (UK) is explained in the context of the UK’s overall privatization of national enterprises. Privatization was carried out during Prime Minister Margaret Thatcher’s conservative administrations, as part of the economic policy to introduce competition to the electricity market and simultaneously minimize the role of government in the national economy.
The regulatory reform itself as well as the process of nationalizing, privatizing, and then introducing major reforms to the electric utility industry in the UK—especially in England and Wales, in this case—offer quite an interesting model for deregulation. Not only was the UK the first country to privatize its electricity industry, but it has also become one of the most aggressive and ambitious countries in the world, in terms of restructuring. In fact, several countries in Latin America and Australia have followed the UK’s example.
In 1882, the UK’s electric utility industry commenced operations under the Electricity Lighting Act. In 1889, through an expansion of the 1882 Act, the first legislative framework was constructed for an electricity supply business intended for customers in a specific region. The UK government passed the resultant Electricity Act in 1926, establishing the central government’s authority in electricity matters through a Central Electricity Board (CEB). The Act required the CEB to build and operate a national transmission grid to coordinate a nationwide transmission network and establish a set of common technological standards.
In 1947, a national electric power utility was founded to integrate the electric utility industries in England, Wales, and South Scotland under the Labor administration, and the British Electricity Authority assumed responsibility for generation and transmission. Distribution was controlled and managed by 12 semi-autonomous regional distribution boards (area boards) in England and Wales, two vertically integrated companies in Scotland, and one vertically integrated company in Northern Ireland. To expand the role of central government in electricity, the Electricity Act of 1957 was enacted, establishing the Central Electricity Generating Board (CEGB). The act created a firm foundation for government initiatives in the electric utility industry that lasted over thirty years.
The Electricity Act of 1983 opened the central electricity grid to IPPs, and became the first step to privatizing and restructuring the electric utility industry in the UK, functioning similarly to PURPA (1978) in
34
The descriptions in Sections a and b are based on Philipson and Willis (1998), pp.319–324, Thomas (1997), Newburry and Green (1996), Bergman et al. (1999), pp.89–115, Yajima (1998), pp.50–63, JEPIC (1991, 1993, and 1998), EIA (1997), and Electricity Association (2001).
the United States. The act obliged CEGB to open the transmission network to private generators and purchase electricity from self-generators, but proved unsuccessful in opening the market.
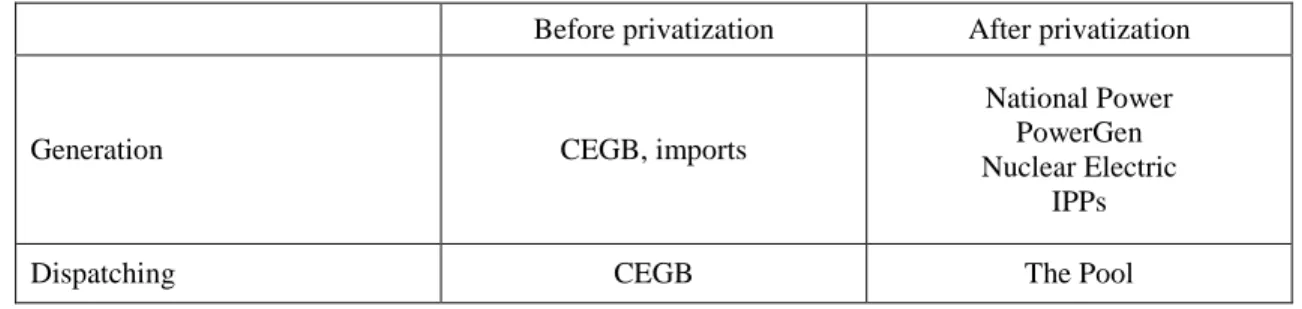
Six years after the Act of 1983, the Electricity Act of 1989 was enacted, implementing full-scale privatization. By this Act, CEGB was split into four companies: the National Grid Company (NGC), PowerGen, National Power, and Nuclear Electric; the 12 area boards also became regional electricity companies (RECs). Among these new companies, transmission facilities and functional operation of the grid were transferred to NGC; generation assets were transferred to the other three firms. The Office of Energy Regulation (OFFER) was organized as the UK electricity industry regulator in April 1990, to perform functions analogous to FERC and states’ PUCs in the United States.
On January 1st, 1999, the roles of OFFER and the Office of Gas Supply merged in the formation of the Office of Gas and Electric Markets (Ofgem). Under the new authority, the New Electricity Trading Arrangements (NETA) were adopted, fundamentally changing the wholesale trading of electricity in England and Wales to promote competition so that lower prices might prevail. The NETA went live on 27th March 2001.
1.3.b. Power Pool Model after the Electricity Act of 1989
The creation of a “power pool” system was the most significant institutional change made in the UK. The UK’s form of restructuring differs fundamentally from that observed in the United States in terms of “privatization.” The focus in California or in PJM is on the efficient separation of the generation and transmission functions or of the transmission and distribution functions; assets are vertically owned by private entities, in most cases. In contrast, the UK government (under the Thatcher administration) was able to draw up a blueprint for a new structure on a clean slate through its process of privatization. The administration decided
to completely separate ownership of generation, transmission, and distribution, and to form a “pool Before privatization After privatization
Generation CEGB, imports
National Power PowerGen Nuclear Electric
IPPs
Dispatching CEGB The Pool
Table 4. Components in the UK’s Electric Utility Industry
Transmission CEGB NGC
Distribution and supply 12 area boards
12 RECs Licensed generators* Other licensed suppliers* * Licensed generators and other licensed suppliers are allowed only for non-franchised supply.
system,” operated by the nationwide, privately owned transmission company, NGC.
Under the Act of 1989, as a competitive market was being created at the wholesale level, generating assets of CEGB were transferred to three established generators: National Power, PowerGen, and Nuclear Electric. Forty conventional generating plants with a combined capacity of 30 GW were transferred to National Power, and another 23 stations with 20 GW of capacity were transferred to PowerGen. Twelve nuclear power stations were transferred to Nuclear Electric, and the high-tension grid plus 2 GW of pumped storage generation plants were transferred to NGC. These four companies became public limited companies on 31st March 1990 as the first step for wholesale trading to become feasible in the UK.
The Act of 1989 requires every electric power supplier to obtain a license to provide service. Generation licenses were given to National Power and PowerGen. Nuclear Electric holds a license that is more specific in terms of safety, and IPPs obtain individual licenses. Licenses were also provided for transmission companies and NGC; public electricity supply (PES) licenses were made available for RECs, and second-tier (private electricity service) licenses were made available to other suppliers within authorized PES areas.35
One remarkable point should be made, about the UK market’s “mandatory pool” system run by the NGC: the so-called “Poolco system.” All generators whose capacity exceeds 100 megawatts are required to submit their generation units for dispatch by the NGC, but there is no demand-side bidding. Following the demand forecast calculated by Poolco operators from load forecasts made by the RECs, generators bid competitively on a day-ahead, non-discriminatory auction basis. Bidding is managed by NGC’s GOAL program, which sets the price as the market-clearing price (MCP)—the cost per kilowatt-hour of the final bid taken.
35
Great Britain’s electricity market structure under the pool system is shown schematically in Figure 2. 1.3.c. Pricing Mechanism in the Pool
The MCP, in other words, might be considered to be the electric industry’s marginal cost, or system marginal price (SMP), as given by the bid amount for a marginal unit in an unconstrained schedule. On the basis of the SMP, the Pool purchase price (PPP) at which the Pool buys power from generators is determined. The actual PPP is calculated with some consideration for the value of lost load (VOLL) and the loss of load probability (LOLP) in addition to SMP,36 to take into account financial incentives for preserving peak load
36
The VOLL attempts to measure the system cost of not producing enough electricity to meet peak load. The LOLP simply
Figure 2. Structure of the electricity industry in the UK (including Scotland)
Source: Digest of UK Energy Statistics, Chapter 5, online,http://www.dti.gov.uk/EPA/05.pdf
* Major power producers at the end of 1999 were: AES Electric Ltd., Anglian Power Generation, Barking Power Ltd., BNFL Magnox, Coolkeeragh Power Ltd, Corby Power Ltd, Derwent Co-generation Ltd, Edison, Mission Energy Ltd, Fellside Heat and Power Ltd, Fibrogen Ltd, Fibropower Ltd, Fibrothetford Ltd, Fife Power Ltd, Humber Power Ltd, Lakeland Power Ltd, Medway Power Ltd., Midlands Power (UK) Ltd, National Power plc, NIGEN, Nuclear Electric, Peterborough Power Ltd, PowerGen plc, Premier Power Ltd, Regional Power Generators Ltd, Rocksavage Power Company Ltd, Sita Tyre Recycling Ltd, Scottish Power plc, Scottish and Southern Energy plc, Seabank Power Ltd, SELCHP Ltd, South Western Electricity, Sutton Bridge Power Ltd, Teesside Power Ltd, and TXU Europe Power Ltd.
capacity in the event that actual consumption exceeds demand forecasts. Generally speaking, the price paid to generators, or pool input price (PIP), can be calculated as SMP + {VOLL × LOLP - max(SMP, bid price)}. In contrast, the price paid by purchasers, or pool output price (POP), is equivalent to PIP plus incremental charges to cover ancillary services, demand forecasting error, transmission congestion, and marginal plant adjustments.
In the UK Pool system, “electricity prices in England and Wales electricity pool have proven to be very volatile and subject to manipulation.”37 Thus, to hedge the risk of price volatility, a contract for differences (CfD) method has developed. This market allows bilateral or multilateral contracts negotiated between generators and customers to settle the differences between contracted prices and actual prices of the time of trade, bypassing the pool market. Currently, most transactions are handled through this CfD method, solely through financial contracts. Therefore, the pool has “somewhat questionable value as an efficient price-setting mechanism.”38
For retail pricing, the UK government rejected ratemaking on the basis of rate of return, adopting instead a sort of price cap regulation method, calculating the price cap as the retail price index minus expected future productivity gains, X: RPI - X.
1.3.d. Implementation of the New Electricity Trading Arrangement (NETA)39
From its inception, the UK’s Poolco market system has exhibited some problems. For example, price cap regulation’s employment of RPI - X as the transmission price control, as mentioned above, has stimulated much controversy, such as regarding which figure should be adopted for the X factor, or whether RPI is a suitable index for regulation. Joskow (2001) has identified two more problems: 1) wholesale prices have been excessive, associated with market power being exerted by the two largest generating companies created at the time of privatization, and 2) too few benefits have reached customers in the form of lower prices. Also, the single market allows no market-to-market basis competition.
To make the market more functional and competitive so that it reflects benefits properly to customers in a
measures the probability that supply will be insufficient to meet demand at a particular point in time.
37
DOE/EIA (1997). 38
Brower (1997). 39
transparent manner, avoiding market power, NETA went live on March 27, 2001. Under NETA, suppliers, purchasers, and probably marketers, too, can transact voluntarily, primarily through forwards and futures contracts in the absence of regulation except for the Balancing Settlement Code (BSC), which governs NETA’s basic function as an imbalance settlement and Balancing Mechanism (BM). All generators, transmission companies, distribution companies, and other electricity service providers must sign up with the BSC to be BSC Parties licensed to offer service at each level. BSC is managed by a separate company, ELEXON.
NETA Functions I: Imbalance Settlement
Imbalance settlement is the procedure for pricing and settling surpluses and deficits between the contractual volume of generation (or demand) and the physical or metered volume of generation (or demand). It is not the process for pricing and settling bulk purchases and sales of electricity. Under NETA, all metered data is available on a half-hourly basis, so Imbalance Settlement also functions half-hourly. That is, imbalance volumes and prices are calculated every half hour, and settled daily.
The Imbalance Settlement comprises several basic concepts. Gate Closure is the time limit that occurs 3 1/2 hours prior to the start of every half hour of actual operation. A Balancing Mechanism unit (BM unit) is a basic operating unit participating in BM whose capacity exceeds 50MW. The system operator (SO) is that entity which is responsible for transmission operation.40 Initial Physical Notification (IPN) and Final Physical
Notification (FPN) are information to be communicated from BM units to the SO about the volume of
operation proposed and the demand expected. In addition to IPN and FPN, BSC parties must submit contracted volumes to a Central Settlement (CS) through a single agent. This contract-based information notification system is termed Energy Contract Volume Notification (ECVN). The agent that submits such information to the central settlement on behalf of trading parties is the Energy Contract Volume Notification Agent (ECVNA), and the Central Settlement that accepts ECVN is the Energy Contract Volume Aggregation Agent (ECVAA).
Imbalance settlement proceeds as follows. By 11:00 a.m. the day before the half-hour of concern, BM units are required to submit IPN, providing the anticipated supply and demand volumes to the SO. Simultaneously, ECVN must be submitted to the ECVAA through the ECVNA. To ensure that the SO has
40
According to Ofgen (2000), the system operator undertakes four activities that pertain to its responsibilities under the Balancing and Settlement Code: 1) accepting balancing mechanism actions to offset energy imbalances, 2) accepting balancing mechanism actions to accommodate transmission system requirements and limitations, and to facilitate the provision of ancillary services, 3) providing Balancing Mechanism data to the Balancing Mechanism Reporting System and Settlements, 4) installing metering to appropriate standards at the boundary between the transmission system concerned and an external transmission system.
locationally specific information identifying the total proposed volumes of operation and demand, as well as the proposed levels of generation and demand during a particular half hour, FPN is submitted with minute-by-minute profiles by Gate Closure. An Imbalance Settlement price is reached by comparing ECVN to the actual load or demand.
After Gate Closure, adjustment bids and offers are implemented to balance differences between FPN and any changes that are determined afterward. This procedure serves as the Balancing Mechanism (BM) to increase network reliability, as described below.
NETA Functions II: Balancing Mechanism (BM)
The Balancing Mechanism (BM) operates in a “pay-as-bid” (PAB) manner to adjust the levels of
production by individual generators and of consumption, or demand. Even after FPN, generators
or suppliers may wish to reduce or increase the volume level from that which was communicated
to the SO. In this case, they can submit offers and bids to BM; offers indicate a willingness to
increase the level of operation or reduce the demand, and bids indicate a willingness to reduce the
level of generation or increase the level of demand. The SO may accept particular offers and bids
placed by BM units in order to balance the national and local levels of generation and demand.
Balancing Mechanism units that cannot deliver the aggregated level of offers or bids will be subject to a non-delivery charge.
Imbalance Charges
Two types of imbalances are considered: information imbalances and energy imbalances.
An information imbalance is the difference between electricity usage as metered at the point of use and FPNs that are modified by offers and bids. An information imbalance charge is set to give BM units incentive to accurately meet the sum total of FPNs, offers, and bids; the charge is calculated based on the number of MWh of deficits or surpluses from modified FPNs during each half-hour period.
Energy imbalance is the net difference between all metered quantities of electricity and the volumes that had been contracted. Energy imbalance prices, which settle energy imbalance surpluses or deficits, may be one of two types: the system buy price (SBP) is charged for deficits so that BSC parties must pay; the system sell
1.3.e. UK Market Evaluation
The UK market model has attracted international attention, being the first dramatic attempt to restructure an electric utility industry. The pool system has generated tremendous interest and expectations, and many countries have adopted the model. Pool-based markets have spurred the installation of combined-cycle gas turbines (CCGT) by market entrants, and such technological improvements have contributed to reduced generation costs and better competition in the market. In some ways, the UK model has achieved the results desired from competition: “despite persistent market power problems, wholesale electricity prices have declined as the competitive wholesale market has matured over the last decade.”41
However, one of the most serious factors obstructing fair competition in the pool system has been the existence of market power, exerted by National Power and Power Gen. The UK government has allowed these two utilities to hold a substantial number of critical generation assets, thereby enabling price-setting. Even though this problem has been identified in some papers, it has not been resolved, even after installation of the new trading arrangement, NETA. Especially in the pool, “the complexities of price formation gave the generators more market power than a normal commodity market.”42 Consequently, whether the NETA succeeds or not ultimately depends on whether an open marketplace can be set up that does not suffer from any sort of “market power.”
1.4. Norwegian Market43
1.4.a. Electric Utility Industry Structures in Norway and Other Scandinavian Countries
The Scandinavian countries have formed quite well-functioning, effective electricity markets. With their abundant water resources, they have been able to deploy hundreds of low-cost hydropower plants to supply a great portion of their annual power demand. For these countries, especially Norway, hydropower resources are much more than either the power source at peak times or ancillary supplies. In Norway, hydropower plants account for almost 99 percent of the power generated.
Scandinavian markets in general (not just the Norwegian market) exhibit a unique character in ways beyond those stated above. These countries have formed highly cooperative markets, like those observed in
41 Joskow (2000), p.106. 42 Newbery (1999) 43
The following description is based on Hjalmarsson (1996), Midttum (1997), Philipson and Willis (1998), Bergman et al. (1999), pp.117–146, JEPIC (1991, 1993, and 1998), the Nord Pool web site <http://el-ex.fi/eng99/thisis/thisis.html>, and the Norwegian Water Resources and Energy Directorate (NVE) (2000a, 2000b).
NORDEL, which was organized by the five countries of Sweden, Denmark, Norway, Finland and Iceland44. Since an undersea connection line joined Sweden and Denmark in 1915, the international transmission network has expanded widely over these five countries. It is also remarkable that government initiatives for deregulation have been very low-key, unlike in the UK and California, where regulatory authorities became strongly committed to deregulation. Most importantly, Scandinavian markets, especially that managed by NordPool, are quite liquid and flexible, although bilateral contracts can take the credit for much of this good result.
1.4.b. Norway’s Major Electricity Reform in 1991
Norway’s electric utility industry, before the Energy Act in 1991, consisted of many small municipal utilities and government- owned grid companies; many utilities held vertically integrated systems.
On 1st January 1991, the Energy Act was passed to introduce competition into the industry. The Act had three main objectives: 1) increase the industry’s economic efficiency, 2) increase security of the nation’s energy supply, and 3) equalize electricity prices nationwide. The Act required public utilities to be vertically unbundled without transferring their ownership to the private sector, and provided third parties open access to the transmission and distribution network (“third-party access,” TPA).
As of 1992, Statkraft, the largest publicly owned utility, became a state-owned generating company; its former responsibility for grid operation and maintenance was assumed by a new vested ”state limited liability” company, Statnett. Statnett now owns 70% of the Norwegian transmission grid, and also serves as system operator (SO). A natural monopoly remains in the network, but a foundation for complete competition has been laid in the generating and retail wheeling sectors.
1.4.c. Market Structure
The biggest issue in restructuring the Nordic electricity wholesale market may have been the creation of a pool market, Nord Pool ASA. Nord Pool ASA—The Nordic Power Exchange—is the world's only multinational exchange for trading electric power. Established in 1993, Nord Pool is owned by the two national grid companies, Statnett SF in Norway (50%) and Affärsverket Svenska Kraftnät in Sweden (50%).45
The Norwegian power pool was first established in 1971 as the result of five regional power pools
44
Among NORDEL countries, Iceland solely forms one independent market. 45
merging. During the initial period of deregulation under the Energy Act of 1991, transactions at the wholesale level were conducted mostly on a bilateral trading basis.46 As deregulation proceeded, however, percolating through the whole industry after Statnett Marked was founded to operate the power exchange, Nord Pool was established as a multinational power exchange, a joint venture by the national grid companies of Norway and Sweden.
The Norwegian wholesale market structure contains some rather remarkable characteristics. First, transactions in the power exchange market are generally conducted in a fully voluntary manner by both suppliers and purchasers. Second, they have transmission congestion only occasionally, due to strong network fundamentals. Third, the market is wide open to neighboring countries, making transactions very liquid.
Nord Pool has five main markets: Elspot, Elbas, Eltermin, Eloption, and Elclearing. Because of these markets’ circumstances, Nord Pool seems to be functioning quite well among European markets. Nord Pool independently operates the power exchange market, organizing both physical products—the power delivered physically under day-ahead or hourly-basis contracts—and financial products—the power trades in terms of risk management and hedging. Nord Pool also provides a clearing service, organizing the supplemental markets of physical and financial trading that control real-time balancing.
Operating in conjunction with the five markets operated by Nord Pool is an imbalance settlement market, the Regulating Power Market, managed by Statnett, the Norwegian grid operator. The various markets are briefly outlined below.
Elspot Market
The Elspot Market is Nord Pool’s physical, day-ahead spot market, which operates on an hourly basis. To allow competitive bidding while avoiding a shortage of grid capacity, the market is usually divided into several areas geographically. Bids for purchases and sales must be met in each market zone. The market clearing price, in units of NOK/MWh, is calculated in each zone for each hour of the day ahead. The market’s administration by zone in some ways resembles California’s congestion-pricing mechanism.
Elbas Market
The Elbas Market is an hour-ahead market for hourly-based transactions conducted up to two hours prior
46
to actual delivery. This market is operated by the Finnish Power Exchange, FLEX, and is based on an electronic trading system. Elbas has two market zones, in Finland and Sweden; Norway does not currently participate in this market.
Eltermin Market
Market participants can hedge their transaction’s price risks up to three years ahead of delivery through the Eltermin Market. Eltermin provides financial (both forward and future) contracts; forward contracts are settled at the end of the contract period, while future contracts are settled daily. The Eltermin Market allows two types of physical contracts: one for base-load power, and the other for peak load.
Eloption Market
Nord Pool also provides option trading for power in financial markets. The Eloption Market
derived from the Eltermin Market in 1999, and electric Power options traded at Eloption market
include European-style options, with Futures Market forward contracts as underlying
instruments, and Asian-style options, for which settlement depends on the Spot Market system
price.
Elclearing Market
The Nordic Electricity Clearing (NEC) Market offers clearing services for contracts made in either the Elspot or the Eltermin Market, to reduce financial counterparts’ risks. For clearing, Nord Pool serves as a broker in contracts to meet the buys and sells of trading contracts obtained from the Elspot and Eltermin markets, to clear the trading counterparts’ contracts.
Regulating Power Market
The Regulating Power Market is operated by Statnett to cover unpredictable imbalances between actual generation and consumption demand at the time of use.
1.4.d. Transmission Pricing
In Norway, a demand-distance pricing method was adopted before restructuring went into effect. However, the old transmission pricing method was replaced by a “point-of-connection” system in most parts of
the network (that is, a sort of “postage stamp” system based on nodal pricing). Under the postage stamp system, transmission owners must define connection points at which power trading takes place; tariffs charged at each connecting point are determined individually, reflecting only those costs that may be associated with an individual’s use of the network. Customers can therefore see and compare a particular node’s tariff, facilitating their choice of electric power companies with which to shop.
To set a tariff, four pieces of information are considered: the energy charge (the cost of incremental network load), capacity charge (revenue collected in excess of that generated under normal operating conditions, through congestion management), connection charge (the estimated cost to maintain network reliability), and power charge (the cost of connected generation capacity net of load, or maximum load net of embedded generation).
1.5. Conclusions
While deregulation and liberalization have become worldwide trends for the 21st Century, the way to approaching them reflects the wide diversity of countries’ circumstances, both politically and economically. For some countries, privatization of national electric power companies must be the top priority; for others, dissolution of generation assets, especially for privately owned and vertically integrated utilities, could be the major concern. Whenever governments have tried to deregulate their nations’ electric power markets, whether in the United States, Europe, or elsewhere around the world, certain discussions have seemed inevitable, relating, for example, to functional unbundling (or “separation”), transmission pricing methodology, and market power.
Market power issues tend to be the toughest challenge facing electric power markets. Electric power markets have historically developed as people have come to accept the phenomenon of natural monopolies, and as centralized, vertically integrated electric utilities have arisen. The first step in creating a competitive electricity market should be to mitigate the market power exercised by specific electricity suppliers (which, in most cases, are incumbent utilities) by installing a new scheme for electric power transactions. From another angle, once deregulation is implemented to reduce electricity prices, companies usually work to maximize their own profits. In other words, deregulation simply gives companies incentive to profit through competition, and price reductions may result from such profit-maximizing behavior in competitive situations. As seen even in the four electricity markets that are considered in this paper, companies are strongly motivated by competition to exercise market power to survive in their markets. Therefore, new market mechanisms should be instituted with a watchful eye toward the possibility that market power may at some point be exercised.
The markets described in this chapter are all unique and, in some ways, well developed in terms of deregulation. However, no one would be able to offer with certainty a set of universally satisfactory solutions for the proposition of deregulating a given country’s electric utility industry. Within each nation’s own unique circumstances, regulatory authorities and market participants are now struggling to succeed in a competitive environment. To learn from their experience, careful analysis and evaluation are essential.
Table 5. Comparison of Selected Restructured Systems
Pool NETA
Regulatory authority PUC and FERC PUC and FERC OFFER Ofgen NVE System operation (SO)
type ISO and PX a sort of Poolco Poolco (NGC) Poolco (NGC)
Poolco (Nord Pool) SO organization Nonprofit Nonprofit For-profit
Private
For-profit Private
For-profit Public
Functional unbundling Yes Yes Separation Separation Separation
Generation divestiture Required
Not required, but strongly encouraged
Not required Not required Not required
Wholesale market PX spot market & bilateral PJM spot, bilateral, and financial energy markets Mandatory pool Negotiated spot market with balancing settlement Spot, financial, imbalance, & bilateral markets
Buyers bidding Yes Yes No Yes Yes
Operation of Centralized Power Market Separate from ISO Combined with ISO Combined with ISO Separated from ISO Separated from ISO Transmission pricing
method Postage stamp LBMP Zonal Zonal
Postage stamp + LBMP
Congestion management Zonal LMBP Contracts Contracts Zonal
2. The Wholesale Electricity Market in Japan
different areas and the country has been commonly believed to be the most appropriate and effective system in Japan. Utilities have operated to achieve “economies of scale” in the franchised areas, and pricing regulation has been employed to offset the adverse effects of monopolistic and exclusive business practices. This “common-sense regulation” encouraged the establishment of gigantic firms called EPCOs. Under regulation, EPCOs have achieved their mission to provide high-quality, universal service, simultaneously supporting national energy security policy. So far, the highly regulated Japanese market system has worked quite well in some respects, suiting the orderly, tractable disposition of the Japanese people well.
However, as the Japanese economy has been increasingly buffeted by recent swirls of globalization, responding to global market competition has become unavoidable. Such regulated industries as oil, rail transportation, and telecommunication have had to restructure to rectify their high-cost structures, liquidating human resources and reducing disparities between domestic and foreign prices of commodities to compete internationally. No exception, the electric utility industry, too, is being exposed to world trends in restructuring. As a result, the Electric Utility Industry Law was revised in 1995, as described in Section 3.2..
As mentioned earlier, the purpose of the present report is to examine the appropriate goal of Japan’s deregulation, especially at the wholesale level. Chapters 1 and 2 introduced the world’s major market examples to bring specific controversial issues facing each market into sharp relief. Chapters 3, 4 and 5 offer some conclusions regarding Japan’s wholesale deregulation, based on the earlier chapters’ analysis. Japan might be considered to have a great advantage and opportunity in commencing its deregulation process at a time when much can be learned from so many forerunners’ successes and errors.
This chapter is organized into two parts: the first two sections explain Japan’s current market structure and legal situation, and the final two sections analyze the market. Following a discussion of the current Japanese market’s primary issues, the chapter concludes by answering the question of whether Japan really needs to deregulate its energy sector.
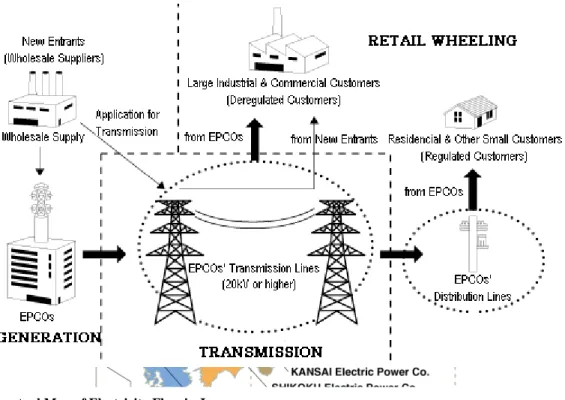
Japan’s electric utility industry today comprises ten vertically integrated utilities (the electric power companies, or EPCOs), three wholesale utilities, and other wholesale electric suppliers, including independent power producers (IPPs).47 The country is divided into ten regions (one being Okinawa Island), each of which provides one EPCO with a mandatory franchise for its electricity supplies (Figure 3). All transmission and distribution lines are owned by EPCOs, except for some transmission lines that are owned by the Electric Power Development Company, Ltd. (EPDC); thus, EPCOs are obligated to deliver all electricity generated to retail customers, no matter who generated it(Figure 2).
Since the 1995 revision of the Electric Utility Industry Law (hereafter, “the Law”), the number of IPPs in Japan has soared, and certain companies (e.g., in the steel and oil industries) that hold self-generating assets
47
According to the Electric Utility Industry Law, “wholesale utilities” are defined as regulated suppliers with 2,000Gw or more total assets’ capacity. They are Electric Power Development Corporation (EPDC), Japan Atomic Power Company (JAPC), and Joh-etsu Cooperated Power Company. Other non-regulated wholesale suppliers are called "wholesale electric suppliers”, including 19 joint-ventured thermal power companies, 34 municipal hydropower plants, and other independent power producers (IPPs).
Figure 3. Encompassing All of Japan – 10 EPCOs by Service Areas
Source: The Federation of Electric Power Companies Japan web site, http://www.fepc.or.jp/erj/chap02.html
Figure 4. Conceptual Map of Electricity Flow in Japan
Source: The Federation of Electric Power Companies Japan web site, http://www.fepc.or.jp/ryoukin/index.html (Japanese only, translated by author)
have made wholesale contracts with EPCOs through competitive bidding. For four years, from 1995 through 1998, IPPs were awarded a total of 6,660 GW of wholesale supplies.48 After the 1999 revision of the Law, in which direct access to large industrial customers49 by non-EPCO generators was allowed, certain numbers of generators appeared as new market participants. Nine generators are now licensed for large industrial supply. Most of the total electricity supply, however—approximately 75%—still depends on the ten EPCOs, or “general electric utilities”; 13% of the remainder is covered by self-generators, 6% by wholesale utilities, and the final 6% by wholesale electric suppliers.50
3.2. Recent Regulatory Circumstances51
In 1995, substantial deregulation of the electric power sector began in Japan. The Electric Utility Industry Law was fundamentally revised for the first time in thirty years, since its issuance in 1964, to implement deregulation, creating a competitive market in the electric utility industry that would respond to the pressures for electricity price reductions that were being exerted by public opinion domestically in response to cheaper prices overseas. This revision was notable in three respects. First, licensing regulation on wholesale electric suppliers was removed to create a wholesale market, in principle, and widen the range of suppliers. A competitive bidding system was implemented for the first time, targeting newly installed, mid- and small-scale thermal power plants. EPCOs at first determined the amount of electricity that could be purchased from IPPs, then invited the IPPs to bid for the supply and finally signed long-term contracts with those suppliers who offered the lowest price per kilowatt-hour. Second, partial direct access to large industrial customers by the new category of supplier, “special electric utilities,”52 was institutionalized. Third, the pricing system was switched from a cost-of-service ratemaking method to yardstick ratemaking, establishing incentives for EPCOs to reduce costs, and encouraging increased business efficiency.
While this legislative movement was proceeding, in July 1997, the Electric Utility Industry Council (EUIC), a consultative committee of the Ministry of International Trade and Industry, MITI (now the Ministry
48
Web site of The Federation of Electric Power Companies Japan, http://www.fepc.or.jp/ryoukin/kaisei.html. 49
Large industrial customers defined as the customers receive electricity by more than 20,000V with more than 2,000kW of the maximum usage.
50
Handbook of Japan’s Electric Power Industry (1998) 51
Description based on Agency of Natural Resources and Energy (1999) and Navarro (1996) 52
Only generators with self-generation assets, who supply electricity to specific consumers under specific conditions (nearby location, financially related, no adverse effect on the general electric utilities business, etc.) are allowed direct access. These generators are called as special electric utilities.