HAL Id: inserm-01736587
https://www.hal.inserm.fr/inserm-01736587
Submitted on 18 Mar 2018
HAL is a multi-disciplinary open access
archive for the deposit and dissemination of
sci-entific research documents, whether they are
pub-lished or not. The documents may come from
teaching and research institutions in France or
abroad, or from public or private research centers.
L’archive ouverte pluridisciplinaire HAL, est
destinée au dépôt et à la diffusion de documents
scientifiques de niveau recherche, publiés ou non,
émanant des établissements d’enseignement et de
recherche français ou étrangers, des laboratoires
publics ou privés.
the national French SUMER survey
Isabelle Niedhammer, Thomas Lesuffleur, Géraldine Labarthe, Jean-François
Chastang
To cite this version:
Isabelle Niedhammer, Thomas Lesuffleur, Géraldine Labarthe, Jean-François Chastang. Role of
work-ing conditions in the explanation of occupational inequalities in work injury: findwork-ings from the national
French SUMER survey. BMC Public Health, BioMed Central, 2018, 18 (1), pp.344.
�10.1186/s12889-018-5254-7�. �inserm-01736587�
R E S E A R C H A R T I C L E
Open Access
Role of working conditions in the
explanation of occupational inequalities
in work injury: findings from the national
French SUMER survey
Isabelle Niedhammer
1,2*, Thomas Lesuffleur
1,2, Géraldine Labarthe
3and Jean-François Chastang
1,2Abstract
Background: Social inequalities in work injury have been observed but explanations are still missing. The objectives of this study were to evaluate the contribution of working conditions in the explanation of social inequalities in work injury in a national representative sample of employees.
Methods: The study was based on the cross-sectional sample of the national French survey SUMER 2010 including 46,962 employees, 26,883 men and 20,079 women. The number of work injuries within the last 12 months was studied as the outcome. Occupation was used as a marker of social position. Psychosocial work factors included various variables related to the classical job strain model, psychological demands, decision latitude, social support, and other understudied variables related to reward, job insecurity, job promotion, esteem, working time and hours and workplace violence. Occupational exposures of chemical, biological, physical and biomechanical nature were also studied. Weighted age-adjusted Poisson regression analyses were performed.
Results: Occupational gradients were observed in the exposure of most psychosocial work factors and occupational exposures. Strong occupational differences in work injury were found, blue-collar workers being more likely to have work injury. Chemical, biological, physical and biomechanical exposures contributed to explain the occupational differences in work injury substantially. Noise, thermic constraints, manual materials handling, postural/articular constraints and vibrations had significant contributions. Psychosocial work factors also contributed to explain the differences especially among women.
Conclusion: Prevention policies oriented toward chemical, biological, physical, biomechanical and psychosocial work exposures may contribute to reduce the magnitude of occupational differences in work injury.
Keywords: Work injury, Social inequalities in health, Working conditions, Occupational exposures, Psychosocial work factors Background
Work injury represents a major burden for the society and companies because of their substantial costs and re-lated absenteeism and disability [1, 2]. Studies reported that low-skilled and manual workers were more likely to
have work injury [3–6]. These findings are in line with the results provided by social epidemiology studies that underlined social inequalities in various health outcomes [5], including injury in general [6]. Nevertheless, the lit-erature appears sparse on the topic of social inequalities in work injury specifically and still more seldom on the factors that may contribute to explain these inequalities.
Working conditions play an important role in the oc-currence of work injury. However, the contribution of working conditions and occupational exposures to social inequalities in work injury has been studied very rarely to date. One exception may be one of our previous
* Correspondence:isabelle.niedhammer@inserm.fr
1INSERM, U1085, Research Institute for Environmental and Occupational Health
(IRSET), Epidemiology in Occupational Health and Ergonomics (ESTER) Team, Faculté de Médecine, 28 rue Roger Amsler, CS 74521, F-49045, Angers Cedex 01, France
2University of Angers, Epidemiology in Occupational Health and Ergonomics
(ESTER) Team, Angers, France
Full list of author information is available at the end of the article
© The Author(s). 2018 Open Access This article is distributed under the terms of the Creative Commons Attribution 4.0 International License (http://creativecommons.org/licenses/by/4.0/), which permits unrestricted use, distribution, and reproduction in any medium, provided you give appropriate credit to the original author(s) and the source, provide a link to the Creative Commons license, and indicate if changes were made. The Creative Commons Public Domain Dedication waiver (http://creativecommons.org/publicdomain/zero/1.0/) applies to the data made available in this article, unless otherwise stated.
studies that explored work injury among other health-related outcomes and was not focused on work injury exclusively [7]. It is thus difficult to evaluate the role of working conditions and occupational exposures in the explanation of social inequalities of work injury.
According to Eurostat, a large part of nonfatal work injuries result from physical and biomechanical expo-sures at the workplace [2]. Etiological studies identified a number of occupational exposures that increase the risk of work injury, such as for example physical demands [8, 9], noise [10, 11], heat [12], shift/night work and long working hours [13]. Psychosocial work factors may also play a role in work injury. These factors have been defined using theoretical models, the most used being the job strain model [14] composed of three main dimensions: psychological demands, sion latitude, including both skill discretion and deci-sion authority, and social support from colleagues and supervisors. The combination of high psychological demands and low decision latitude (job strain) may have adverse effects on health, and these effects may be increased by low social support (iso-strain). Another model, the effort-reward imbalance model, defines the im-balance between high effort spent at work and low reward received (in terms of esteem, job promotion and job security) [15]. Other psychosocial work factors have emerged more recently in the literature: workplace vio-lence such as physical viovio-lence, sexual harassment, verbal abuse and bullying, predictability as well as demands for responsibility. Studies showed that high psychological demands, low decision latitude, low social support and/or job strain were associated with work injury [16–22]. A few studies found significant associations between low reward [19], workplace violence/conflicts [16, 19, 21–23] and work injury.
As poor working conditions and occupational expo-sures were found to be associated with work injury and as these conditions and exposures may be more preva-lent among low-skilled and manual workers [7,24], they may be considered as pertinent explanations of social in-equalities in work injury. Work injury is an avoidable outcome, consequently information on this topic may be crucial to prevent work injury and reduce social inequal-ities in this outcome.
This study aimed at exploring occupational differences in work injury and at evaluating the contribution of a large number of occupational exposures of psychosocial, chemical, biological, physical and biomechanical nature in the explanation of these differences.
Methods
Study population
The SUMER survey is a periodic national cross-sectional survey from two departments of the French ministry of
labour conducted every seven years. Its objective is to evaluate occupational exposures among the national working population of employees, in order to define pre-ventive strategies and research priorities in France. The SUMER survey is based on a network of voluntary occu-pational physicians, in charge of compulsory medical ex-aminations of employees, who collect the data for a random sample of their employees. Each occupational physician selected 30 employees of the population of employees seen during the period of collection using a random method (one employee of 10 or 20 for example). Occupational medicine is mandatory for all employees in France; consequently, every employee has a medical examination with an occupational physician periodically. SUMER 2010, the last survey conducted in 2010, in-cluded around 50,000 employees interviewed about their physical, biological, chemical, biomechanical, organizational and psychosocial exposures by 2400 occupational physi-cians. The survey included two questionnaires: a main questionnaire and a self-administered questionnaire. The occupational physicians filled in the main questionnaire mainly about physical, biological, chemical, biomechanical and organizational exposures for each employee. Employees filled in a self-administered questionnaire in which their re-sponses were collected about psychosocial work factors and health outcomes. Several articles have already been pub-lished by our team using these survey data [19,25–29].
Work injury
The information about work injury was collected in the self-administered questionnaire. Work injury was mea-sured by the number of injuries (0, 1, 2, 3 or more), which required a medical treatment and at least one day of absence within the last 12 months. We used the num-ber of work injuries within the last 12 months as the outcome of our study.
Psychosocial work factors
Psychosocial work factors were constructed using the data collected in the self-administered questionnaire.
Job strain model dimensions were constructed using the validated French version of the questionnaire [30,31]: de-cision latitude (9 items, Cronbach alpha = 0.78, including 6 items for skill discretion and 3 items for decision author-ity), psychological demands (9 items, Cronbach alpha = 0.80) and social support (8 items, Cronbach alpha = 0.82, including 4 items for social support from colleagues and 4 items for social support from supervisors). The scores were constructed according to the recommendations by Karasek and dichotomized at the median of the total sam-ple. Job strain was defined by the combination of high de-mands and low latitude, and isostrain by the combination of job strain and low support.
Reward (11 items, Cronbach alpha = 0.85, including 5 items for esteem, 2 items for job security and 4 items for job promotion) from the effort-reward imbalance model was measured using the validated French version of this questionnaire [32]. Reward and its sub-dimensions were dichotomized at the median of the total sample.
Five working time variables were studied: long working hours (1 item, ≥48 h/week following the European dir-ective on working time), night work (1 item, working be-tween 12 and 5 am ≥1 night/week), shift work (1 item, either permanent or alternating/rotating shifts), unsoci-able work days (1 item, working on Sunday or Saturday ≥1 day/week), and predictability of schedules (4 items: information about time schedules for the next day, week, month and the next three months).
Three factors were related to workplace violence: physical violence or sexual assault (2 items), bullying (9 items) and verbal abuse (2 items). Exposure was defined by at least one situation of workplace violence for each factor.
Demands for responsibility (4 items: a mistake in work may lead to serious consequences for product/service quality, to serious financial losses for the company, to dangerous consequences for the safety of people or one-self, and to wage/work/job sanctions for oneself ) was di-chotomized at the median of the total sample.
Other occupational exposures
Other occupational exposures (physical, biomechanical, biological and chemical exposures) were measured by the occupational physicians using their expert evaluation and collected in the main questionnaire.
Physical exposure was defined by at least 20 h of ex-posure to noise, thermic constraints, radiations or con-trolled air/space within the previous week.
Biomechanical exposure was defined by at least 20 h of exposure to manual materials handling, postural/ar-ticular constraints, vibrations or driving within the previ-ous week.
Biological exposure was defined by at least one bio-logical exposure within the previous week.
Chemical exposure was defined by at least one chem-ical exposure within the previous week.
The questionnaires and the evaluation of all occu-pational exposures were built using national and European guidelines and a full description may be found elsewhere [21].
Occupation
Occupation was coded using the French national classifi-cation of occupations (PCS by INSEE) that is close to the International Standard Classification of Occupation (ISCO), and was used as a measure of social position and included at the first level of the classification four
categories of employees: professionals/managers used as the reference category, associate professionals/techni-cians, clerks/service workers, and blue-collar workers. Occupation was used as a marker of social position as it characterizes adult social position, is available for all workers, and may reflect occupational exposures better than education or other markers [33,34].
Statistical methods
The data were weighted to provide estimates which were nationally representative of the French working popula-tion of employees (i.e. 22 millions of employees repre-senting 92% of the total national population of employees in France, excluding the public sector of edu-cation and some ministries). The method for the calcula-tion of weights performed by the DARES of the French ministry of labour had different objectives: to control for the potential bias related to volunteering of occupational physicians by taking into account their characteristics in comparison with the characteristics of the national population of occupational physicians, to control for the potential bias related to the differential periodicity of medical examinations (highly exposed employees have more frequent medical examinations), to control for the potential bias related to non-response to the survey, and finally to provide final weights using a calibration on margins to take the characteristics of the national French population of employees into account. These final weights were calculated using the following cali-bration variables: gender, age, nationality, working time (full or part time), occupation, company size, and eco-nomic activity. All analyses were performed using weighted data.
Major differences in work injury are usually observed between gender and age groups, the prevalence of work injury is lower among women than among men, and may decrease with age [2]. Men and women were analyzed sep-arately and age was taken into account in all models.
The statistical analysis included three steps:
Firstly, the study sample was described and the differences between occupations for all variables were tested using Rao-Scott Chi-Square test to take the weights into account.
Secondly, the associations between occupation and work injury were studied using weighted Poisson regression analysis, work injury being the dependent variable. The contributions of psychosocial work factors and other occupational exposures to occupational inequalities in work injury were calculated for the three occupational groups: associate professionals/technicians, clerks/service workers and blue-collar workers in comparison to professionals/managers. The contribution
of each work factor (or a set of work factors) to the explanation of the occupational differences was estimated by the Karlson, Holm and Breen method (KHB) [35,36], that allows to compare the estimated coefficients of two nested nonlinear probability models. Positive contributions (%) indicated rate ratio (RR) reductions and negative contributions indicated RR increases. A 95% confidence interval was calculated for each contribution using the Jackknife method to provide the significance of each contribution.
Several models were performed:
– A first model included only occupation and age as independent variables (model 0).
– Each psychosocial work factor or occupational exposure was added separately to model 0 (extended model 0). – All the psychosocial work factors that displayed
significant positive contributions for at least one gender or occupational group were added simultaneously to model 0 as independent variables in model 1 and model 2.
– Similarly, all the occupational exposures that displayed significant positive contributions for at least one gender or occupational group were added simultaneously to model 0 as independent variables in model 3 and model 4.
– Finally, all work factors that displayed significant positive contributions for at least one gender or occupational group were added simultaneously to model 0 as independent variables in model 5 and model 6.
Models 1, 3 and 5 included the main dimensions of psychosocial work factors and occupational exposures and models 2, 4 and 6 included their sub-dimensions.
Additional analyses were performed to disentangle the respective contribution of each factor in models 1–6 using the KHB decomposition method that provides un-biased decompositions in the context of nonlinear prob-ability models [37].
Thirdly, the associations between occupational exposures and work injury were explored. The results for the associations between psychosocial work factors and work injury were presented in a previous paper and showed that high psychological demands, low social support (especially from supervisors), low reward and its sub-dimensions, low predictability, physical violence, bullying and verbal abuse were associated with work injury [19]. The associations between the other occupational exposures and work injury were derived from the models above and presented in the present study.
All statistical analyses were performed using SAS and STATA.
Results
Of the 53,940 employees asked to participate to the SUMER survey in 2010, 46,962 employees, 26,883 men and 20,079 women, agreed. The response rate was 87%. The description of the sample among men and women may be found elsewhere [19,25–29]. Almost all psycho-social work factors displayed significant occupational gradients (Table1), with a higher prevalence of exposure among low-skilled occupational groups (clerks/service workers and/or blue-collar workers): low decision lati-tude, low social support, job strain, isostrain, low reward (for men only), night work, shift work, unsociable work days, low predictability, the different forms of workplace violence and demands for responsibility (these two last factors especially for men). Two psychosocial work fac-tors displayed inverse occupational gradients; high psy-chological demands and long working hours were more prevalent among professionals/managers. Marked occu-pational gradients were observed for the other occupa-tional exposures. Blue-collar workers were more likely to be exposed to physical, biomechanical and chemical posures and service workers were more likely to be ex-posed to biological exposures. The Rao-Scott Chi-Square values showed that the magnitude of the occupational differences may be stronger for these exposures than for psychosocial work factors. There was a strong occupa-tional gradient in the prevalence of work injury; blue-collar workers were more likely to have work injury, and the differences between occupations were particularly marked among men.
Table 2 presents the association between occupation and work injury (after adjustment for age). Significant associations were found between occupation and work injury with strong occupational gradients. The RR of work injury associated with the occupation of blue-collar workers was 10 for men and 5 for women compared to professionals/managers. The stronger asso-ciation between occupation and work injury among men than among women was confirmed by a significant inter-action test among the whole sample (interinter-action test com-paring blue-collar workers to professionals/managers between men and women significant atp = 0.024).
Table3 presents the associations between the occupa-tional exposures of chemical, biological, physical and biomechanical nature and work injury. When each ex-posure was studied separately (extended models 0), all exposures increased the risk of work injury except radia-tions and controlled air/space for both genders, vibra-tions for women and driving for men. When all occupational exposures were studied simultaneously (models 3 and 4), biological, physical and biomechanical
Table 1 Prevalence of psychosocial work factors, other occupational exposures and work injury according to occupational groups
Professionals, managers
Associate professionals, technicians
Clerks, service workers Blue-collar workers Chi-2 value p-value Men (N) 5082 6408 3574 11,819
Prevalence (%)
Low decision latitude 20.3 38.0 62.1 56.8 929*** Low skill discretion 21.9 38.1 63.6 55.7 797*** Low decision authority 41.2 54.7 70.0 69.0 517*** High psychological demands 65.6 50.5 37.7 36.7 515*** Low social support 38.6 40.7 43.4 44.2 19*** Low social support (from supervisors) 40.5 40.1 42.7 44.1 13** Low social support (from colleagues) 64.8 66.2 65.8 66.3 1 Job strain 13.6 19.9 24.8 22.0 83*** Isostrain 9.1 13.2 16.5 14.5 47*** Low reward 44.9 51.4 53.4 48.8 29*** Low esteem 42.8 46.9 50.1 46.0 19*** Job insecurity 44.7 44.0 41.6 44.4 4 Low job promotion 36.7 46.4 48.4 43.0 59*** Long working hours 25.2 9.0 5.1 4.1 798*** Night work 1.2 3.4 8.8 8.0 205*** Shift work 3.5 12.0 23.7 23.0 489*** Unsociable work days 13.5 14.7 32.1 17.8 304*** Low predictability 31.3 31.4 36.4 33.3 14** Physical violence 0.8 1.4 5.6 1.3 166*** Bullying 19.8 22.6 25.1 21.7 16** Verbal abuse 16.1 22.9 34.5 14.4 378*** Demands for responsibility 49.2 52.3 45.0 61.4 173*** Biological exposure 6.7 14.2 28.7 15.2 345*** Chemical exposure 6.9 24.9 26.5 60.6 2321*** Physical exposure 21.1 41.6 45.4 78.3 2144*** Noise 14.8 31.4 29.9 65.4 1913*** Thermic constraints 6.1 19.7 30.2 44.5 1040*** Radiations 3.1 5.0 2.1 5.7 48*** Controlled air/space 30.3 19.7 18.5 10.0 428*** Biomechanical exposure 27.1 36.4 44.7 74.0 1727*** Manual materials handling 8.0 29.1 36.7 68.6 2556*** Postural/articular constraints 49.6 63.1 77.0 90.3 1169*** Vibrations 1.3 8.1 8.0 39.6 2020*** Driving 37.6 46.2 35.6 56.7 324*** Work injury 195*** 0 99.0 96.2 92.6 89.0 1 1.0 3.1 6.7 9.7 2 0.0 0.7 0.6 1.1 > =3 0.0 0.0 0.1 0.2 Women (N) 2811 5666 9311 2291 Prevalence (%)
exposures were significantly associated with work injury. Among the sub-dimensions of physical and biomechan-ical exposures, the associations of noise and manual materials handling with work injury were significant for
both genders, and the associations of thermic constraints and vibrations were significant for men.
Tables4and 5present the change in the RRs for each occupational group after inclusion of each factor/exposure
Table 1 Prevalence of psychosocial work factors, other occupational exposures and work injury according to occupational groups (Continued)
Professionals, managers
Associate professionals, technicians
Clerks, service workers Blue-collar workers Chi-2 value p-value Low skill discretion 27.3 47.1 68.7 78.3 944***
Low decision authority 42.4 62.8 74.1 80.3 497*** High psychological demands 65.7 50.4 41.5 36.6 255*** Low social support 37.6 39.9 40.0 49.4 33*** Low social support (from supervisors) 38.8 41.9 39.3 46.4 19*** Low social support (from colleagues) 61.6 63.7 63.4 70.6 19*** Job strain 16.7 24.7 28.7 30.0 84*** Isostrain 10.6 15.6 17.7 21.7 57*** Low reward 46.6 51.1 49.1 50.4 6 Low esteem 43.2 45.2 42.9 44.8 4 Job insecurity 42.1 42.8 37.0 44.9 33*** Low job promotion 39.1 46.9 47.3 44.2 22*** Long working hours 11.8 2.5 1.6 1.7 265***
Night work 0.6 2.1 2.3 3.5 30***
Shift work 3.1 14.7 14.8 27.6 265*** Unsociable work days 8.3 15.9 19.2 19.0 83*** Low predictability 24.4 28.5 33.6 30.4 43*** Physical violence 0.7 3.6 1.7 0.9 45***
Bullying 22.7 22.1 22.5 23.7 1
Verbal abuse 25.7 31.0 26.2 13.3 94*** Demands for responsibility 35.1 38.1 29.2 32.3 62*** Biological exposure 12.1 30.6 34.5 25.7 228*** Chemical exposure 5.6 20.1 31.3 52.0 744*** Physical exposure 16.6 23.2 25.6 48.6 221*** Noise 10.8 17.7 20.0 37.0 276*** Thermic constraints 4.7 4.7 7.8 22.2 101*** Radiations 1.4 3.2 1.1 1.3 65*** Controlled air/space 28.7 21.4 16.0 14.4 135*** Biomechanical exposure 27.1 32.6 42.6 51.8 214*** Manual materials handling 5.8 22.6 32.8 47.4 605*** Postural/articular constraints 55.3 64.3 78.6 92.7 474*** Vibrations 0.4 0.6 1.3 8.0 319*** Driving 20.1 19.7 11.9 15.2 104*** Work injury 52*** 0 98.8 97.3 95.6 93.9 1 1.2 2.5 3.9 5.7 2 0.0 0.2 0.4 0.4 > =3 0.0 0.0 0.1 0.0
Rao-Scott chi-square test
*:p < 0.05, **: p < 0.01, ***: p < 0.001 %: weighted %
(extended models 0). The following factors displayed sig-nificant contributions in the explanation of occupational differences in work injury: low reward, low esteem, low job promotion, workplace violence factors, and demands for responsibility among men, low decision latitude, low decision authority, low job promotion, shift work, unsoci-able work days, low predictability and physical violence among women, and low social support, low support from supervisors, job strain and isostrain for both genders. High psychological demands had significant but negative contri-butions and contributed to increase occupational differ-ences in work injury. When psychosocial work factors with significant and positive contributions were consid-ered simultaneously in models 1 and 2, significant contributions were found for models 1 among women (11–19%), and for models 2 for both genders (4–5% for men and 10–20% for women). These contributions were significant for clerks/service workers and technicians/as-sociate professionals among both genders and for blue collar workers among women. In the models including each exposure separately (extended models 0), chemical, biological, physical and biomechanical exposures had sig-nificant contributions to the explanation of occupational differences in work injury. Noise, thermic constraints, manual materials handling and postural/articular con-straints for both genders, and vibrations for men contrib-uted to explain these differences. Controlled air/space had significant contributions among men, but this variable dis-played significant protective associations with work injury (Table3), and was not included in the final models. When the exposures with significant contributions were included simultaneously in models 3 and 4, their contribution was significant for all three occupational groups and for men (11–26%) and women (18–31%). When finally all factors and exposures with significant contributions were in-cluded in models 5 and 6, the contributions were signifi-cant for men (11–26%) and women (27–43%) and all three occupational groups.
The results from the KHB decomposition method showed that some factors played a significant role in the global contribution of the factors in models 1–6 (not showed): reward, esteem, physical violence, thermic con-straints, and vibrations among men, predictability, and postural/articular constraints among women, and shift work, verbal abuse, biological exposure, physical expos-ure, noise, biomechanical exposure and manual mate-rials handling for both genders, confirming the results from extended models 0.
Discussion
Main results
Strong occupational differences in work injury were ob-served for both genders, and still stronger for men than for women. Almost all psychosocial work factors and
Table 2 Association between occupation and work injury
Men (N = 26,432)
Women (N = 19,678) RR (95% CI) (model 0)
Associate professionals, technicians 4.0 *** (2.5; 6.5) 2.4 *** (1.5; 3.8) Clerks, service workers 6.9 *** (4.6; 10.4) 3.9 *** (2.5; 6.1) Blue-collar workers 10.5 *** (7.2; 15.4) 5.2 *** (3.2; 8.3)
RR adjusted for age (weighted Poisson regression analysis) Professionals/managers: reference group
**:p < 0.05, **: p < 0.01, ***: p < 0.001
Table 3 Associations between occupational exposures and work injury: results from weighted Poisson regression analysis
Men RR (95% CI) Women RR (95% CI) Extended models 0 (each factor separately)
Biological exposure 1.4 ** (1.1; 1.8) 2.0 *** (1.6; 2.4) Chemical exposure 1.2 * (1.0; 1.4) 1.7 *** (1.4; 2.1) Physical exposure 1.8 *** (1.5; 2.3) 1.8 *** (1.5; 2.3) Noise 1.6 *** (1.3; 2.0) 1.7 *** (1.3; 2.1) Thermic constraints 1.6 *** (1.3; 1.9) 1.9 *** (1.4; 2.5) Radiations 1.1 (0.7; 1.6) 1.2 (0.6; 2.3) Controlled air/space 0.8 * (0.6; 0.9) 0.9 (0.7; 1.2) Biomechanical exposure 1.4 *** (1.2; 1.7) 1.6 *** (1.3; 1.9) Manual materials handling 1.7 *** (1.4; 2.1) 2.3 *** (1.8; 2.9) Postural/articular constraints 1.7 *** (1.3; 2.3) 1.5 ** (1.1; 2.1) Vibrations 1.6 *** (1.3; 1.9) 1.4 (0.8; 2.3) Driving 1.2 (1.0; 1.4) 1.3 * (1.0; 1.7) Models 3 Biological exposure 1.3 * (1.0; 1.7) 1.6 *** (1.3; 2.1) Chemical exposure 1.0 (0.8; 1.2) 1.2 (0.9; 1.6) Physical exposure 1.7 *** (1.4; 2.1) 1.6 *** (1.2; 2.0) Biomechanical exposure 1.3 ** (1.1; 1.6) 1.4 ** (1.1; 1.7) Models 4 Biological exposure 1.3 * (1.0. 1.6) 1.5 ** (1.2; 1.9) Chemical exposure 0.9 (0.7; 1.1) 1.1 (0.8; 1.5) Noise 1.3 ** (1.1; 1.6) 1.4 ** (1.1; 1.8) Thermic constraints 1.3 *** (1.1; 1.6) 1.4 (1.0; 1.9) Manual materials handling 1.5 *** (1.2; 1.7) 1.8 *** (1.4; 2.3) Postural/articular constraints 1.3 (1.0; 1.7) 1.0 (0.7; 1.4) Vibrations 1.3 ** (1.1; 1.5) 0.9 (0.6; 1.6)
RR adjusted for age and occupation Bold RR: significant at 5% *:p < 0.05, **: p < 0.01, ***: p < 0.001
Model 3: Biological exposure + chemical exposure + physical exposure + biomechanical exposure
Model 4: Biological exposure + chemical exposure + noise + thermic constraints + manual material handlings + postural/articular constraints + vibrations
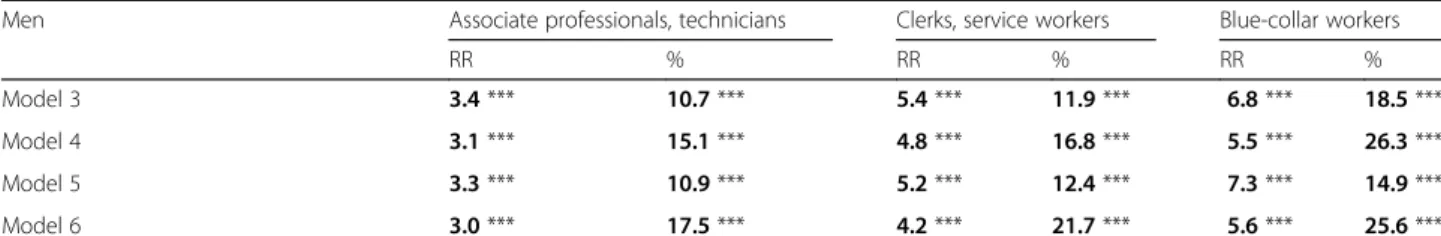
Table 4 Contribution (%) of work factors to occupational inequalities in work injury: results for weighted Poisson regression analysis among men
Men Associate professionals, technicians Clerks, service workers Blue-collar workers
RR % RR % RR %
Extended models 0 (each factor separately)
Low decision latitude 4.0 *** 0.3 6.8 *** 0.5 10.4 *** 0.4 Low skill discretion 4.0 *** 0.2 6.9 *** 0.3 10.4 *** 0.2 Low decision authority 4.0 *** 1.2 6.7 *** 1.9 10.2 *** 1.5 High psychological demands 4.2 *** −4.1 ** 7.5 *** −5.5 ** 11.7 *** −4.7 *** Low social support 3.9 *** 0.7 6.5 *** 1.1 * 9.9 *** 1.1 ** Low social support (from supervisors) 4.0 *** 0.0 6.6 *** 0.7 10.2 *** 0.8 ** Low social support (from colleagues) 3.9 *** 0.1 6.9 *** 0.1 10.2 *** 0.1 Job strain 4.0 *** 1.3 * 6.6 *** 1.6 ** 10.2 *** 1.0 ** Isostrain 3.9 *** 0.8 6.6 *** 1.0 * 10.0 *** 0.6 * Low reward 3.9 *** 2.4 ** 6.5 *** 2.4 ** 10.2 *** 1.1 ** Low esteem 3.9 *** 1.6 ** 6.6 *** 2.1 ** 10.3 *** 0.9 ** Job insecurity 4.0 *** 0.0 6.8 *** −0.3 10.5 *** 0.2 Low job promotion 4.0 *** 2.6 ** 6.8 *** 2.4 ** 10.7 *** 1.2 ** Long working hours 4.1 *** −1.8 7.0 *** −1.6 10.7 *** −1.4 Night work 3.5 *** −0.4 7.1 *** −0.9 10.8 *** −0.6 Shift work 4.2 *** −0.6 7.2 *** −1.1 11.1 *** −0.9 Unsociable work days 4.0 *** 0.0 6.8 *** 0.2 10.5 *** 0.0 Low predictability 4.0 *** −0.1 6.8 *** 0.5 10.4 *** 0.0 Physical violence 4.0 *** 0.3 6.4 *** 1.7 ** 10.4 *** 0.1 Bullying 4.0 *** 0.9 * 6.7 *** 1.2 ** 10.4 *** 0.4 Verbal abuse 3.8 *** 2.8 ** 6.1 *** 5.4 *** 10.5 *** −0.3 Demands for responsibility 4.0 *** 0.6 6.9 *** −0.5 10.2 *** 1.2 * Model 1 3.8 *** 1.8 6.4 *** 1.9 10.6 *** −1.3 Model 2 3.8 *** 3.5 * 6.0 *** 4.7 * 10.4 *** 0.8 Extended models 0 (each factor separately)
Biological exposure 3.9 *** 1.9 ** 6.3 *** 4.0 ** 10.1 *** 1.2 ** Chemical exposure 3.9 *** 2.4 6.6 *** 1.8 * 9.5 *** 4.2 * Physical exposure 3.5 *** 8.9 *** 5.9 *** 7.3 *** 7.5 *** 14.5 *** Noise 3.7 *** 5.7 ** 6.4 *** 3.6 *** 8.2 *** 10.3 *** Thermic constraints 3.7 *** 4.6 *** 6.1 *** 5.8 *** 8.6 *** 7.6 *** Radiations 4.0 *** 0.1 6.9 *** 0.0 10.5 *** 0.1 Controlled air/space 3.9 *** 2.0 * 6.7 *** 1.7 * 10.0 *** 2.3 * Biomechanical exposure 3.9 *** 2.3 * 6.5 *** 3.1 ** 8.9 *** 6.9 ** Manual materials handling 3.5 *** 8.3 *** 5.8 *** 8.0 *** 7.4 *** 14.1 *** Postural/articular constraints 3.8 *** 5.1 ** 6.0 *** 7.5 ** 8.7 *** 9.2 ** Vibrations 3.9 *** 2.0 ** 6.7 *** 1.2 ** 8.7 *** 7.1 *** Driving 4.0 *** 1.0 6.9 *** 0.0 10.2 *** 1.3
other occupational exposures displayed occupational gradients. The role of psychosocial work factors in explaining occupational differences in work injury was significant mainly for associate professionals/technicians and clerks/service workers and this role was stronger for women than for men. Differences between men and women were found for the contributing factors. The other occupational exposures of chemical, bio-logical, physical and biomechanical nature contributed substantially to explain the occupational differences in work injury.
Limitations and strengths of the study
The study used a large representative sample of the na-tional French working population of employees, with weighted data and a good response rate, facilitating generalization of the findings. It can be noticed that the results were similar with or without including weights, although unweighted analyses led to more significant re-sults; the presentation of the weighted results may thus be considered as a cautious approach. Men and women were analyzed separately, which is important in occupa-tional epidemiology [38]. Indeed, in our study, there were differences in the prevalence of work injury and of exposure to work factors between genders. Furthermore, there were also differences in the magnitude of occupa-tional inequalities in work injury and in the contributing factors between men and women. Occupational inequal-ities in work injury were studied, and the role of working conditions and occupational exposures was formally ex-plored in the explanation of these inequalities, which is very rare in the literature. A large range of occupational factors and exposures was examined to provide a complete picture of working conditions. Well-established instruments were used to measure psychosocial work fac-tors: the validated French versions of the JCQ (job strain
model) and of the scale of reward (effort-reward imbal-ance model), facilitating comparisons with other studies. Other factors, understudied in the literature in this topic, such as job insecurity, workplace violence, working time and hours and demands for responsibility were also stud-ied. The study also included other occupational exposures, that were measured by occupational physicians using their expert evaluation. We studied the contribution of each psychosocial work factor and each occupational exposure in the explanation of occupational differences in work in-jury. Models were also performed including all factors/ex-posures that displayed significant contributions. Indeed, there may be complex interrelations between factors/ex-posures; some factors may be causes or consequences of other factors. Because of these interrelations, it was not possible to sum the individual contributions provided by extended models 0. Thus, models 1–6 were useful to pro-vide the global contribution of psychosocial work factors (models 1–2), of the other occupational exposures (models 3–4), and of all work factors together (models 5– 6). Furthermore, additional analyses were done to disen-tangle the respective contribution of each factor in models 1–6, i.e. when all factors were taken into account. However, these additional results may be considered conservative given the complex interrelations between factors, especially regarding psychosocial work factors. Sensitivity analyses were also performed to adjust for two additional variables, working full/part time and years of work experience, that may play a role in the association between occupation and work injury. These analyses provided similar results confirming the robustness of the results. Finally, we used sophisti-cated statistical analyses to include weights, and to calculate confidence intervals and the significance of the contributions, that helped to select the factors in the final models.
Table 4 Contribution (%) of work factors to occupational inequalities in work injury: results for weighted Poisson regression analysis among men (Continued)
Men Associate professionals, technicians Clerks, service workers Blue-collar workers
RR % RR % RR %
Model 3 3.4 *** 10.7 *** 5.4 *** 11.9 *** 6.8 *** 18.5 *** Model 4 3.1 *** 15.1 *** 4.8 *** 16.8 *** 5.5 *** 26.3 *** Model 5 3.3 *** 10.9 *** 5.2 *** 12.4 *** 7.3 *** 14.9 *** Model 6 3.0 *** 17.5 *** 4.2 *** 21.7 *** 5.6 *** 25.6 ***
Professionals/managers: reference group. RR indicates the RR of work injury for associate professionals/technicians (respectively clerks/service workers or blue-collar workers) in comparison with professionals/managers using various models
All models adjusted for age. Bold RR and contribution: significant at 5%. *:p < 0.05, **: p < 0.01, ***: p < 0.001
Model 1: Decision latitude + social support + reward + shift work + unsociable work days + predictability + physical violence + bullying + verbal abuse + demands for responsibility
Model 2: Decision authority + social support (from supervisors) + esteem + job promotion + shift work + unsociable work days + predictability + physical violence + bullying + verbal abuse + demands for responsibility
Model 3: Biological exposure + chemical exposure + physical exposure + biomechanical exposure
Model 4: Biological exposure + chemical exposure + noise + thermic constraints + manual material handlings + postural/articular constraints + vibrations Model 5: model 1 + model 3
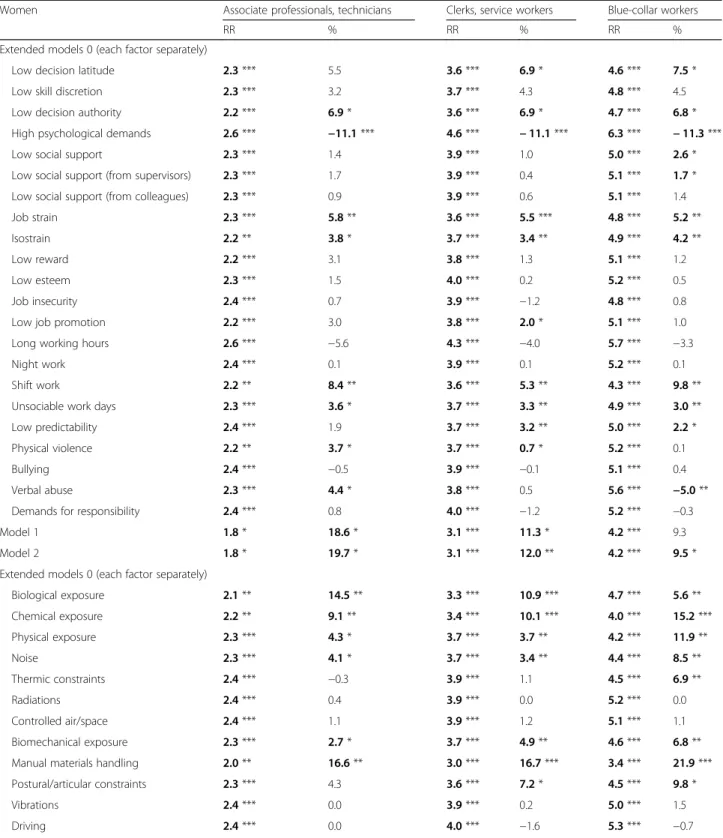
Table 5 Contribution (%) of work factors to occupational inequalities in work injury: results for weighted Poisson regression analysis among women
Women Associate professionals, technicians Clerks, service workers Blue-collar workers
RR % RR % RR %
Extended models 0 (each factor separately)
Low decision latitude 2.3 *** 5.5 3.6 *** 6.9 * 4.6 *** 7.5 * Low skill discretion 2.3 *** 3.2 3.7 *** 4.3 4.8 *** 4.5 Low decision authority 2.2 *** 6.9 * 3.6 *** 6.9 * 4.7 *** 6.8 * High psychological demands 2.6 *** −11.1 *** 4.6 *** − 11.1 *** 6.3 *** − 11.3 *** Low social support 2.3 *** 1.4 3.9 *** 1.0 5.0 *** 2.6 * Low social support (from supervisors) 2.3 *** 1.7 3.9 *** 0.4 5.1 *** 1.7 * Low social support (from colleagues) 2.3 *** 0.9 3.9 *** 0.6 5.1 *** 1.4 Job strain 2.3 *** 5.8 ** 3.6 *** 5.5 *** 4.8 *** 5.2 ** Isostrain 2.2 ** 3.8 * 3.7 *** 3.4 ** 4.9 *** 4.2 ** Low reward 2.2 *** 3.1 3.8 *** 1.3 5.1 *** 1.2 Low esteem 2.3 *** 1.5 4.0 *** 0.2 5.2 *** 0.5 Job insecurity 2.4 *** 0.7 3.9 *** −1.2 4.8 *** 0.8 Low job promotion 2.2 *** 3.0 3.8 *** 2.0 * 5.1 *** 1.0 Long working hours 2.6 *** −5.6 4.3 *** −4.0 5.7 *** −3.3 Night work 2.4 *** 0.1 3.9 *** 0.1 5.2 *** 0.1 Shift work 2.2 ** 8.4 ** 3.6 *** 5.3 ** 4.3 *** 9.8 ** Unsociable work days 2.3 *** 3.6 * 3.7 *** 3.3 ** 4.9 *** 3.0 ** Low predictability 2.4 *** 1.9 3.7 *** 3.2 ** 5.0 *** 2.2 * Physical violence 2.2 ** 3.7 * 3.7 *** 0.7 * 5.2 *** 0.1 Bullying 2.4 *** −0.5 3.9 *** −0.1 5.1 *** 0.4 Verbal abuse 2.3 *** 4.4 * 3.8 *** 0.5 5.6 *** −5.0 ** Demands for responsibility 2.4 *** 0.8 4.0 *** −1.2 5.2 *** −0.3 Model 1 1.8 * 18.6 * 3.1 *** 11.3 * 4.2 *** 9.3 Model 2 1.8 * 19.7 * 3.1 *** 12.0 ** 4.2 *** 9.5 * Extended models 0 (each factor separately)
Biological exposure 2.1 ** 14.5 ** 3.3 *** 10.9 *** 4.7 *** 5.6 ** Chemical exposure 2.2 ** 9.1 ** 3.4 *** 10.1 *** 4.0 *** 15.2 *** Physical exposure 2.3 *** 4.3 * 3.7 *** 3.7 ** 4.2 *** 11.9 ** Noise 2.3 *** 4.1 * 3.7 *** 3.4 ** 4.4 *** 8.5 ** Thermic constraints 2.4 *** −0.3 3.9 *** 1.1 4.5 *** 6.9 ** Radiations 2.4 *** 0.4 3.9 *** 0.0 5.2 *** 0.0 Controlled air/space 2.4 *** 1.1 3.9 *** 1.2 5.1 *** 1.1 Biomechanical exposure 2.3 *** 2.7 * 3.7 *** 4.9 ** 4.6 *** 6.8 ** Manual materials handling 2.0 ** 16.6 ** 3.0 *** 16.7 *** 3.4 *** 21.9 *** Postural/articular constraints 2.3 *** 4.3 3.6 *** 7.2 * 4.5 *** 9.8 * Vibrations 2.4 *** 0.0 3.9 *** 0.2 5.0 *** 1.5 Driving 2.4 *** 0.0 4.0 *** −1.6 5.3 *** −0.7
A few limitations deserve to be mentioned. The study had a cross-sectional design, and the conclusions about statistical associations may not be causal. A reverse causality between work injury and occupation may be possible and may be explained by a selection effect called social selection. Indeed, employees with a work injury might have been selected in low-skilled occupa-tions. However, social selection has been suggested to play a small role only in explaining social inequalities in other health outcomes [39]. A healthy worker effect may also be suspected in our study if low-skilled workers are more likely to have serious work injuries because of their working conditions that lead to death or exit from the labour market. This healthy worker effect may under-estimate the association between occupation and work injury, as well as the contribution of occupational expo-sures/factors in the explanation of occupational differ-ences in work injury. Work injury was self-reported and might not be as reliable as information from registers [40]. Psychosocial work factors were not all measured using validated questionnaires, and some factors may have been neglected. In addition, no information was available regarding duration of exposure, something that may lead to an underestimation of the contribution of occupational factors and exposures in social inequalities in health [41]. Finally, our study focused on occupational exposures in the explanation of occupational differences in work injury, and did not cover factors outside work.
Comparison with the literature
The prevalence of work injury was found to be higher for men than for women in our study, in agreement with results in Europe reporting a prevalence for men that is twice the prevalence for women [2]. Strong occupational differences in work injury were found, and these differ-ences were stronger for men than for women. In one of
our previous studies using the SUMER 2003 survey data, we observed that the ORs for work injury associated with blue-collar workers compared to professionals/ managers were 9.40 for men and 5.63 for women [7], which is consistent with the results found here using the SUMER 2010 data. Other studies underlined the strong social inequalities in work injury and showed that low-skilled or manual workers were more likely to have work injury [2–4]. Nevertheless, to our knowledge, there has been no previous study that evaluated the contribution of working conditions and occupational exposures in the explanation of these inequalities. One of our previous publications using the SUMER 2003 data explored the social inequalities in various health outcomes including work injury, but included a lower number of psycho-social work factors [7]. Its results showed that occupa-tional exposures of chemical, biological, physical and biomechanical nature contributed to explain the occupa-tional differences in work injury. The contributing phys-ical and biomechanphys-ical exposures were noise, thermic constraints, manual material handling, postural/articular constraints, vibrations and driving. The total contribu-tions of all these exposures, plus chemical and biological exposures, ranged from 6% to 33%, which is consistent with our present study based on the SUMER 2010 data. The contribution of psychosocial work factors (decision latitude, and especially decision authority, social support and workplace violence) accounted for 6–15% additional explained fractions. All these results are in agreement with the present results. The present study provided new findings regarding reward and its sub-dimensions, job promotion for both genders, and esteem for men, and working time and hours factors, shift work, unsoci-able hours and predictability, for women.
It may be worth noticing that the total contribution of working conditions and occupational exposures in
Table 5 Contribution (%) of work factors to occupational inequalities in work injury: results for weighted Poisson regression analysis among women (Continued)
Women Associate professionals, technicians Clerks, service workers Blue-collar workers
RR % RR % RR %
Model 3 1.9 ** 19.8 ** 3.0 *** 18.3 *** 3.4 *** 23.5 *** Model 4 1.8 * 25.5 ** 2.7 *** 23.4 *** 3.0 *** 30.8 *** Model 5 1.5 39.1 * 2.4 *** 28.1 *** 3.1 *** 27.2 *** Model 6 1.5 42.9 * 2.3 ** 30.3 *** 2.9 *** 30.7 ***
Professionals/managers: reference group. RR indicates the RR of work injury for associate professionals/technicians (respectively clerks/service workers or blue-collar workers) in comparison with professionals/managers using various models
All models adjusted for age. Bold RR and contribution: significant at 5%. *:p < 0.05, **: p < 0.01, ***: p < 0.001
Model 1: Decision latitude + social support + reward + shift work + unsociable work days + predictability + physical violence + bullying + verbal abuse + demands for responsibility
Model 2: Decision authority + social support (from supervisors) + esteem + job promotion + shift work + unsociable work days + predictability + physical violence + bullying + verbal abuse + demands for responsibility
Model 3: Biological exposure + chemical exposure + physical exposure + biomechanical exposure
Model 4: Biological exposure + chemical exposure + noise + thermic constraints + manual material handlings + postural/articular constraints + vibrations Model 5: model 1 + model 3
explaining occupational differences in work injury was found to be 11–43% in our study. As our study had a good cover of working conditions (the SUMER survey is dedi-cated to the evaluation of all occupational exposures), it is unlikely that major aspects of working conditions may be missing and may account for a substantial unobserved ex-plained fraction. Our study aimed at focusing on amend-able factors at the workplace, thus it is possible that other factors may play a role in explaining occupational differ-ences in work injury. For example, temporary employ-ment, that is more prevalent among low-skilled workers, was found to be associated with work injury, and studies provided insight into potential mechanisms underlying this association such as length of experience and know-ledge of workplace hazards [42]. Personal factors may also be contributing factors in social inequalities in work in-jury, such as for example chronic health problems [43], which also displayed strong social inequalities.
Conclusion
Our study underlined the strong occupational differ-ences in work injury and the still stronger differdiffer-ences among men. According to Eurostat, the most important risk factors of work injury are physical and biomechan-ical exposures at the workplace [2]. These exposures along with chemical and biological exposures may play a substantial role in explaining occupational differences in work injury. These types of exposures may contribute to these differences because they are risk factors for work injury and also because they display strong occupational gradients. Although most psychosocial work factors were found to be associated with work injury, their contribu-tion in the explanacontribu-tion of occupacontribu-tional differences in this outcome may be lower, maybe because the occupa-tional differences in these exposures were less marked. Comprehensive prevention policies oriented toward chemical, biological, physical, biomechanical and psy-chosocial work exposures may be useful to reduce the occurrence of work injury and the occupational differ-ences in this outcome. Special attention should be given to low-skilled and manual workers. More studies are needed to confirm our results and also to identify the other factors that may contribute to explain the occupa-tional inequalities in work injury.
Acknowledgements
The authors thank the members of the DARES (French ministry of labour), all the occupational physicians and‘médecins inspecteurs régionaux du travail’, and all the employees who participated to the SUMER survey and made this study possible.
Funding
This study was funded by the French ministry of labour (DARES, grant no 2200684049).
Availability of data and materials
The datasets used and analysed during the current study are available from the corresponding author on reasonable request.
Authors’ contributions
IN initiated the research project, wrote the study protocol, performed the literature search and drafted and revised the manuscript. IN, TL and JFC wrote the statistical analysis plan. TL and JFC performed the statistical analyses. TL, GL and JFC made contributions to the interpretation of the results and manuscript revisions. All authors read and approved the final manuscript.
Ethics approval and consent to participate
Ethical approval was granted by the Commission Nationale de l’Informatique et des Libertés and Conseil National de l’Information Statistique.
Consent for publication Not applicable Competing interests
The authors declare that they have no competing interests. Isabelle Niedhammer is a Section Editor for BMC Public Health.
Publisher’s Note
Springer Nature remains neutral with regard to jurisdictional claims in published maps and institutional affiliations.
Author details
1INSERM, U1085, Research Institute for Environmental and Occupational Health
(IRSET), Epidemiology in Occupational Health and Ergonomics (ESTER) Team, Faculté de Médecine, 28 rue Roger Amsler, CS 74521, F-49045, Angers Cedex 01, France.2University of Angers, Epidemiology in Occupational Health and Ergonomics (ESTER) Team, Angers, France.3Ministry of Labour, DARES, Paris,
France.
Received: 3 July 2017 Accepted: 2 March 2018
References
1. Concha-Barrientos M, Nelson DI, Fingerhut M, Driscoll T, Leigh J. The global burden due to occupational injury. Am J Ind Med. 2005;48(6):470–81. 2. Eurostat. Health and safety at work in Europe (1999–2007) - a statistical
portrait. Luxembourg: European Commission Statistical books; 2010. 3. Oh JH, Shin EH. Inequalities in nonfatal work injury: the significance of race,
human capital, and occupations. Soc Sci Med. 2003;57(11):2173–82. 4. Piha K, Laaksonen M, Martikainen P, Rahkonen O, Lahelma E. Socio-economic
and occupational determinants of work injury absence. Eur J Pub Health. 2013; 23(4):693–8.
5. Lundberg I, Hemmingsson T, Hogstedt C. Work and social inequalities in health in Europe. Brussells: P.I.E. Peter Lang SA; 2007.
6. Laflamme L, Burrows S, Hasselberg M. Socioeconomic differences in injury risks: a review of findings and a discussion of potential countermeasures. Copenhagen: World Health Organization; 2009.
7. Niedhammer I, Chastang JF, David S, Kelleher C. The contribution of occupational factors to social inequalities in health: findings from the national French SUMER survey. Soc Sci Med. 2008;67(11):1870–81. 8. Dembe AE, Erickson JB, Delbos R. Predictors of work-related injuries and
illnesses: national survey findings. J Occup Environ Hyg. 2004;1(8):542–50. 9. Melamed S, Yekutieli D, Froom P, Kristal-Boneh E, Ribak J. Adverse work and
environmental conditions predict occupational injuries. The Israeli cardiovascular occupational risk factors determination in Israel (CORDIS) study. Am J Epidemiol. 1999;150(1):18–26.
10. Cantley LF, Galusha D, Cullen MR, Dixon-Ernst C, Rabinowitz PM, Neitzel RL. Association between ambient noise exposure, hearing acuity, and risk of acute occupational injury. Scand J Work Environ Health. 2015;41(1):75–83. 11. Yoon JH, Hong JS, Roh J, Kim CN, Won JU. Dose - response relationship
between noise exposure and the risk of occupational injury. Noise Health. 2015;17(74):43–7.
12. Morabito M, Cecchi L, Crisci A, Modesti PA, Orlandini S. Relationship between work-related accidents and hot weather conditions in Tuscany (Central Italy). Ind Health. 2006;44(3):458–64.
13. Wagstaff AS, Sigstad Lie JA. Shift and night work and long working hours–a systematic review of safety implications. Scand J Work Environ Health. 2011; 37(3):173–85.
14. Karasek R, Brisson C, Kawakami N, Houtman I, Bongers P, Amick B. The job content questionnaire (JCQ): an instrument for internationally comparative assessments of psychosocial job characteristics. J Occup Health Psychol. 1998;3(4):322–55.
15. Siegrist J, Starke D, Chandola T, Godin I, Marmot M, Niedhammer I, Peter R. The measurement of effort-reward imbalance at work: European comparisons. Soc Sci Med. 2004;58(8):1483–99.
16. Hinkka K, Kuoppala J, Vaananen-Tomppo I, Lamminpaa A. Psychosocial work factors and sick leave, occupational accident, and disability pension: a cohort study of civil servants. J Occup Environ Med. 2013;55(2):191–7.
17. Julia M, Catalina-Romero C, Calvo-Bonacho E, Benavides FG. The impact of job stress due to the lack of organisational support on occupational injury. Occup Environ Med. 2013;70(9):623–9.
18. Kim HC, Min JY, Min KB, Park SG. Job strain and the risk for occupational injury in small- to medium-sized manufacturing enterprises: a prospective study of 1,209 Korean employees. Am J Ind Med. 2009;52(4):322–30. 19. Lesuffleur T, Chastang JF, Sandret N, Niedhammer I. Psychosocial factors at
work and occupational injury: results from the French national SUMER survey. J Occup Environ Med. 2015;57(3):262–9.
20. Nakata A, Ikeda T, Takahashi M, Haratani T, Hojou M, Fujioka Y, Swanson NG, Araki S. Impact of psychosocial job stress on non-fatal occupational injuries in small and medium-sized manufacturing enterprises. Am J Ind Med. 2006; 49(8):658–69.
21. Niedhammer I, Chastang JF, David S. Importance of psychosocial work factors on general health outcomes in the national French SUMER survey. Occup Med (Lond). 2008;58(1):15–24.
22. Swaen GM, van Amelsvoort LP, Bultmann U, Slangen JJ, Kant IJ. Psychosocial work characteristics as risk factors for being injured in an occupational accident. J Occup Environ Med. 2004;46(6):521–7.
23. Sabbath EL, Hurtado DA, Okechukwu CA, Tamers SL, Nelson C, Kim SS, Wagner G, Sorenson G. Occupational injury among hospital patient-care workers: what is the association with workplace verbal abuse? Am J Ind Med. 2014;57(2):222–32.
24. Kristensen TS, Borg V, Hannerz H. Socioeconomic status and psychosocial work environment: results from a Danish national study. Scand J Public Health Suppl. 2002;59:41–8.
25. Lesuffleur T, Chastang JF, Sandret N, Niedhammer I. Psychosocial factors at work and sickness absence: results from the French national SUMER survey. Am J Ind Med. 2014;57(6):695–708.
26. Lesuffleur T, Chastang JF, Cavet M, Niedhammer I. Psychosocial work factors and self-reported health in the French national SUMER survey. Sante Publique. 2015;27(2):177–86.
27. Niedhammer I, Lesuffleur T, Algava E, Chastang JF. Classic and emergent psychosocial work factors and mental health. Occup Med (Lond). 2015;65(2): 126–34.
28. Niedhammer I, Lesuffleur T, Coutrot T, Chastang JF. Contribution of working conditions to occupational inequalities in depressive symptoms: results from the national French SUMER survey. Int Arch Occup Environ Health. 2016;89(6):1025–37.
29. Niedhammer I, Lesuffleur T, Memmi S, Chastang JF. Working conditions in the explanation of occupational inequalities in sickness absence in the French SUMER study. Eur J Pub Health. 2017;
30. Niedhammer I. Psychometric properties of the French version of the Karasek job content questionnaire: a study of the scales of decision latitude, psychological demands, social support, and physical demands in the GAZEL cohort. Int Arch Occup Environ Health. 2002;75(3):129–44.
31. Niedhammer I, Chastang J, Gendrey L, David S, Degioanni S. Propriétés psychométriques de la version française des échelles de la demande psychologique, de la latitude décisionnelle et du soutien social du "Job Content Questionnaire" de Karasek : résultats de l'enquête nationale SUMER. Santé Publique. 2006;18(3):413–27.
32. Niedhammer I, Siegrist J, Landre MF, Goldberg M, LeClerc A. Psychometric properties of the French version of the effort-reward imbalance model. Rev Epidemiol Sante Publique. 2000;48(5):419–37.
33. Galobardes B, Shaw M, Lawlor DA, Lynch JW, Davey SG. Indicators of socioeconomic position (part 1). J Epidemiol Community Health. 2006; 60(1):7–12.
34. Galobardes B, Shaw M, Lawlor DA, Lynch JW, Davey SG. Indicators of socioeconomic position (part 2). J Epidemiol Community Health. 2006; 60(2):95–101.
35. Karlson KB, Holm A, Breen R. Comparing regression coefficients between same-sample nested models using logit and probit: a new method. Sociol Methodol. 2012;42:286–313.
36. Kohler U, Karlson KB, Holm A. Comparing coefficients of nested nonlinear probability models. Stata J. 2011;11(3):420–38.
37. Karlson KB, Anders H. Decomposing primary and secondary effects: a new decomposition method. Research in Social Stratification and Mobility. 2011; 29:221–37.
38. Niedhammer I, Saurel-Cubizolles MJ, Piciotti M, Bonenfant S. How is sex considered in recent epidemiological publications on occupational risks? Occup Environ Med. 2000;57(8):521–7.
39. Dohrenwend BP, Levav I, Shrout PE, Schwartz S, Naveh G, Link BG, Skodol AE, Stueve A. Socioeconomic status and psychiatric disorders: the causation-selection issue. Science. 1992;255(5047):946–52.
40. Burdorf A, Post W, Bruggeling T. Reliability of a questionnaire on sickness absence with specific attention to absence due to back pain and respiratory complaints. Occup Environ Med. 1996;53(1):58–62.
41. Monden CW. Current and lifetime exposure to working conditions. Do they explain educational differences in subjective health? Soc Sci Med. 2005; 60(11):2465–76.
42. Benavides FG, Benach J, Muntaner C, Delclos GL, Catot N, Amable M. Associations between temporary employment and occupational injury: what are the mechanisms? Occup Environ Med. 2006;63(6):416–21. 43. Palmer KT, Harris EC, Coggon D. Chronic health problems and risk of accidental
injury in the workplace: a systematic literature review. Occup Environ Med. 2008; 65(11):757–64.
• We accept pre-submission inquiries
• Our selector tool helps you to find the most relevant journal
• We provide round the clock customer support
• Convenient online submission
• Thorough peer review
• Inclusion in PubMed and all major indexing services
• Maximum visibility for your research Submit your manuscript at
www.biomedcentral.com/submit