HAL Id: hal-01908617
https://hal.archives-ouvertes.fr/hal-01908617
Submitted on 9 Apr 2019
HAL is a multi-disciplinary open access
archive for the deposit and dissemination of
sci-entific research documents, whether they are
pub-lished or not. The documents may come from
teaching and research institutions in France or
abroad, or from public or private research centers.
L’archive ouverte pluridisciplinaire HAL, est
destinée au dépôt et à la diffusion de documents
scientifiques de niveau recherche, publiés ou non,
émanant des établissements d’enseignement et de
recherche français ou étrangers, des laboratoires
publics ou privés.
An Intracerebral Exploration of Functional Connectivity
during Word Production
Amandine Grappe, Sridevi V. Sarma, Pierre Sacré, Jorge Gonzalez-Martinez,
Catherine Liegeois-Chauvel, Alario F.-X.
To cite this version:
Amandine Grappe, Sridevi V. Sarma, Pierre Sacré, Jorge Gonzalez-Martinez, Catherine
Liegeois-Chauvel, et al.. An Intracerebral Exploration of Functional Connectivity during Word Production.
Journal of Computational Neuroscience, Springer Verlag, 2019, 46 (1), pp.125-140.
�10.1007/s10827-018-0699-3�. �hal-01908617�
(will be inserted by the editor)
An intracerebral exploration of functional connectivity during
word production
Amandine Grappe · Sridevi V. Sarma · Pierre Sacr´e · Jorge Gonz´alez-Mart´ınez · Catherine Li´egeois-Chauvel · F.-Xavier Alario
Received: date / Accepted: date
Research supported by grants ANR-11-LABX-0036 (BLRI), ANR-16-CONV-0002 (ILCB), by the Excel-lence Initiative of Aix-Marseille University (A∗MIDEX), and by a Kavli Neuroscience Discovery Institute postdoctoral fellowship awarded to P.S.
Amandine Grappe
Interfaculty Institute of Bioengineering, Ecole Polytechnique F´ed´erale de Lausanne, Lausanne, Switzerland Institute for Computational Medicine, Johns Hopkins University, Baltimore, MD, USA
Sridevi V. Sarma
Institute for Computational Medicine, Johns Hopkins University, Baltimore, MD, USA Pierre Sacr´e
Institute for Computational Medicine, Johns Hopkins University, Baltimore, MD, USA ORCID: 0000-0002-7228-1628
Jorge Gonz´alez-Mart´ınez
Cleveland Clinic Neurological Institute, Epilepsy Center, Cleveland, OH, USA Catherine Li´egeois-Chauvel
INS, Inst Neurosci Syst, Aix Marseille Univ, INSERM, Marseille, France Cleveland Clinic Neurological Institute, Epilepsy Center, Cleveland, OH, USA F.-Xavier Alario
Abstract Language is mediated by pathways connecting distant brain regions that have diverse functional roles. For word production, the network includes a ventral pathway, con-necting temporal and inferior frontal regions, and a dorsal pathway, concon-necting parietal and frontal regions. Despite the importance of word production for scientific and clinical pur-poses, the functional connectivity underlying this task has received relatively limited atten-tion, and mostly from techniques limited in either spatial or temporal resolution. Here, we exploited data obtained from depth intra-cerebral electrodes stereotactically implanted in eight epileptic patients. The signal was recorded directly from various structures of the neo-cortex with high spatial and temporal resolution. The neurophysiological activity elicited by a picture naming task was analyzed in the time-frequency domain (10–150 Hz), and func-tional connectivity between brain areas among ten regions of interest was examined. Task related-activities detected within a network of the regions of interest were consistent with findings in the literature, showing task-evoked desynchronization in the beta band and syn-chronization in the gamma band. Surprisingly, long-range functional connectivity was not particularly stronger in the beta than in the high-gamma band. The latter revealed meaning-ful sub-networks involving, notably, the temporal pole and the inferior frontal gyrus (ventral pathway), and parietal regions and inferior frontal gyrus (dorsal pathway). These findings are consistent with the hypothesized network, but were not detected in every patient. Further research will have to explore their robustness with larger samples.
Keywords speech · language · dorsal stream · ventral stream · stereo-electroencephalography · functional connectivity
Tel.: +33413550972
E-mail: francois-xavier.alario@univ-amu.fr ORCID: 0000-0002-8627-5034
1 Introduction
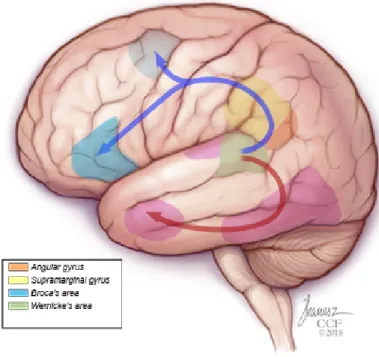
Contemporary views about language processing have evolved from the classic ideas devel-oped by Broca (1861), Wernicke (1969), Lichtheim (1885), or Geschwind (1970), to models and descriptions that are substantially more specific and complex (Tremblay and Dick 2016). Classic models highlighted a distinction between language comprehension and production, with corresponding specializations in the posterior temporal cortex and the inferior frontal gyrus of the language-dominant hemisphere. Today, language processing is understood as a distributed global network of neural structures that are devoted to diverse sub-processes (Price 2012), functionally organized in multiple processing streams (Poeppel et al 2012) through dorsal and ventral anatomical pathways (Fig. 1; e.g. Petrides 2014).
Anatomo-functional divisions
In this context, consider a word production task in which pictured objects are named out-loud (Snodgrass and Yuditsky 1996), and many regions of the language network are re-cruited (e.g. Hickok 2012; Roelofs 2014; Ueno et al 2011). Early visual processing stages recruit occipital and temporal regions (e.g., fusiform gyrus and the medial temporal gyrus; Goodale and Milner 1992; Grill-Spector and Weiner 2014). Semantic processing recruits the temporal pole and the angular gyrus (Binder and Desai 2011; Lambon-Ralph et al 2016). Word processing is often associated with middle temporal lobe (reviewed in Indefrey 2011), with a possible role of medial temporal lobe regions (e.g., hippocampus) in visual word re-trieval (Hamam´e et al 2014; Llorens et al 2016; see also Covington and Duff 2016; Moscov-itch et al 2016; Piai et al 2016). Phonological and articulatory processes are associated to parietal and prefrontal regions (e.g., Dell et al 2013; Fridriksson et al 2016; Rogalsky et al 2015; Schwartz et al 2012; Han et al 2016).
Fig. 1: Schematic representation of dorsal (blue) and ventral (pink) streams involved in language processing.
Network pathways
Such regions are connected through various anatomical pathways (details in Petrides 2014). The visual ventral pathway connects occipital regions to inferior temporal regions, onwards to the temporal pole and mesial areas (Clarke and Tyler 2015). Temporal and frontal areas are connected dorsally, through parietal areas, by the middle longitudinal fasciculus (Catani et al 2005), and by the arcuate fasciculus, thought to play a crucial role, since the classic Geshwind model, in connecting superior temporal regions with prefrontal areas (Catani and Mesulam 2008). The areas in the parietal lobe (e.g. Angular Gyrus and Supra-Marginal
Gyrus) are differentially connected to sub-regions within the prefrontal area (Catani and Mesulam 2008; Petrides 2014; Parlatini et al 2017) by the major branches of the superior longitudinal fasciculus, which is not always distinguished from the arcuate fasciculus cited earlier. Finally, anterior temporal areas are also anatomically connected to the different sub-regions in inferior frontal gyrus by an alternative ventral pathway that includes the uncinate fasciculus and the extreme capsule fasciculus (Makris and Pandya 2009; Papagno 2011).
Task-related functional connectivity
The evidence for the pathways described above comes from comparative studies in macaque monkeys (e.g., Petrides and Pandya 2009), and, in humans, from metrics derived from struc-tural diffusion tensor imaging (DTI) connectivity and from functional magnetic resonance imaging (fMRI) resting-state connectivity (e.g., Margulies and Petrides 2013; Fuertinger et al 2015; Saur et al 2008; Sheldon et al 2016; Sheldon and Moscovitch 2012; Uddin et al 2010). Comparatively, there are relatively few studies in which functional connectivity anal-ysis are directly derived from word production tasks. These studies are highly diverse (Ta-ble 1), leaving many open questions regarding functional connectivity during word produc-tion. Of particular interest to our own study are previous explorations based on intracerebral recordings, which provide neurophysiological signals with high spatial and temporal resolu-tions (see also Llorens et al 2011). These have shown that the network dynamic structure is substantially modulated by broad task requirements (e.g., visual vs. auditory input, or spo-ken vs. signed output: Korzeniewska et al 2011; Collard et al 2016), while still reflecting the expected language pathways described above (Flinker et al 2015), and sometimes refining them (Rolston and Chang in press).
T able 1: A sample of pre vious explorations of functional connecti vity during w ord production based on neuroph ysiological signals. Refer ence Signal analysis F requency Co gnitive focus Main findings Interpr etation Ew ald et al (2012) EEG: Coherenc y, W eighted minimum norm estimate demix ed with Minimum Ov erlap Component Analysis (MOCA) ∼ 7 Hz ( θ band) Contrast between tw o le xico-semantic conditions Modulation of the imaginary part of coherenc y. Fronto-temporal netw ork link ed to w ord retrie v al processes. Hassan et al (2015) EEG: W eighted minimum norm, phase locking v alues, clustering algorithm 30–45 Hz ( γ low band) T ask netw ork Netw ork starts occipital, then propag ates to occitipito-temporo-frontal re gions and then temporo-frontal. Dif ferent sequential brain states can be related to specific processing stages. Liljestr ¨om et al (2015) MEG: Cross-spectral density v alues, source localized with ev ent-related Dynamic Imaging of Coherent Sources 25–32 Hz ( β band) and v arious bands within 30– 90 Hz T ask netw ork, contrasting o v ert vs. co v ert naming Early , enhanced connecti vity between parieto-temporal re gion and medial frontal cortices. Later , enhanced connecti vity between sensorimotor and motor corte x with middle and inferior temporal gyri T ask netw ork reconfigurations in the time-range of a fe w hundred milliseconds. K orze-nie wska et al (2011) ECoG: ev ent-related causality , electrical stimulation 70–115 Hz ( γ high band) Spok en vs. signed production T ask netw ork modulated by modality of output: peri-sylvian language areas functionally connected to either the mouth, tongue areas vs. hand, motor areas of motor corte x. Highlights the sub-netw ork that is necessary for task performance. Flink er et al (2015) ECoG: Granger causality 70–150 Hz ( γ high band) T ask netw ork, w ord vs. pseudo-w ord reading T emporal or g anization of acti v ation in nodes of the left dorsal stream. Cascade of acti v ations from sensory to articulatory representations, “Broca’ s” re gion silent during articulation. Collard et al (2016) ECoG: Identification of functional netw ork components 70–110 Hz ( γ high band) T ask netw ork, contrasting visual vs. auditory naming Meaningful time-resolv ed functional subnetw orks can be identified across tasks, and within single trials First step to w ards mapping dynamic cortical interactions during language tasks. Rolston and Chang (in press) ECoG: Imaginary coherence between sites 8–15 Hz ( α band) & other frequenc y bands P articularities of sites that disrupt task performance through ECS Sites that disrupt language performance sho w higher functional connecti vity than non-eloquent sites T ask disruption may stem from netw ork propag ation rather than local interference. Dubarry et al (2017) SEEG: T emporal o v erlap of single trial acti v ations 70–150 Hz ( γ high band) P arallel processing in the task netw ork Simultaneous acti v ation of re gions in single trials w as not frequent. Limited evidence for cogniti v e parallel processing. Note 1 EEG: ElectroEncephaloGraph y; MEG: MagnetoEncephaloGraph y; ECoG: ElectroCorticoGraph y; ECS: Electrocortical stimulation; SEEG: Stereo-tactic EEG; Hz: Hertz.
The current study
The hypothesis tested here is that the structural pathways reviewed above are dynamically operational during cognitive language tasks. If such is the case, the dynamic functional ac-tivity elicited during a word-production task should reveal statistical dependencies between brain regions. Based on our past research, we were particularly interested in identifying re-gions that were simultaneously and similarly active during the task (Dubarry et al 2017). Given this goal, our exploration purposely avoided exploring metrics that involve delays be-tween regions. Instead of focusing on a particular frequency band, as was done there, here we explored separately the similarity of functional activity between pairs of brain structures in the β band (12–30 Hz) and the γhighband (70–150 Hz) on a trial-by-trial basis.
Electrophys-iological oscillations in different frequency bands co-occur with perceptual, cognitive and sensory-motor tasks, and it is acknowledged that they can correlate with different cognitive states (Wang 2010). The specific roles of these oscillations in language remains largely an open question. The γhighband was a focus of this study because it has been associated with
language processing, particularly in intracerebral recordings (discussed in Lachaux et al 2012; see also Gaona et al 2011). The β band was another focus of this study because it has been previously associated with various linguistics processes, including retrieval and senso-rimotor processes (e.g., Liljestr¨om et al 2015; Piai et al 2015). Low-frequency oscillatory activity has been claimed to be the key mechanism for long-range neuronal interaction and information transfer (Donner and Siegel 2011). β and γhighsynchronization might be
dif-ferentially involved in top-down vs. bottom-up processes within certain cognitive processes (Fries 2015).
In short, we sought to quantify similar co-activations among brain regions during word production across frequency bands.
Fig. 2: Anatomical sampling in the study.
The sampling covers a substantial part of the regions involved in word production. Different arbitrary colors are used to highlight different regions. The numbers indicate contact and patient sampling in each region (number of contacts/patients). The abbreviations are as in Table 3.
2 Materials and Methods
The experiment was performed at the Epilepsy Center of Cleveland Clinic, Ohio, United States of America. It had been approved by the local Institutional Review Board with ap-proval number 16-466. All participants gave their informed written consent before being enrolled.
2.1 Participants
The participants were eight epileptic patients (3 men, 5 women; 42.5 ± 11.5 years old) that did not respond to standard drug treatments and that had been implanted with intracerebral electrodes for pre-surgical diagnostic purposes. The choice of electrode location had been based on a pre-implantation patient management conference and was made independently of the present study. Criteria for patients undergoing SEEG implantation were reviewed by clinicians to determine patient eligibility for enrollment in the current study. If the patient met study criteria, research staff not involved in the surgery implantation or post-surgical care contacted the patient for potential participation in the study. Participation in the study did not alter the patients’ clinical care, particularly it had strictly no influence on the orig-inally planned SEEG procedure (Johnson et al 2014). The participants demographics are presented on Table 2.
2.2 Behavioral task
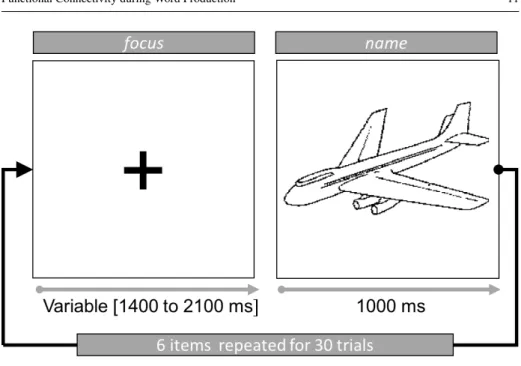
The cognitive experiment was based on a previous study performed by Llorens et al (2014). Word production was elicited in a picture naming task involving 36 pictures of common objects (Fig. 3). Following a common practice in cognitive studies of language production (Bock 1996, p. 407), participants were first familiarized with the pictures; they named them one by one and received oral corrective feedback when they provided unexpected responses, in order to reduce the diversity of possible responses. During the experimental testing itself, participants were instructed to name each object as fast as possible and to remain silent if they did not recognize the picture or could not name it. The pictures in a block were either from a single semantic category (e.g., vehicles; semantically homogeneous block) or from the 6 different semantic categories (semantically heterogeneous block). No attempt
Table 2: Demographic and clinical data information for each patient.
Hand., Handedness; LDH, Language-Dominant Hemisphere; DOE, Duration Of Epilepsy; CEZ, Clinically-annotated Epileptogenic Zone; MTL, Mesial Temporal Lobe; FTL, Fronto Temporal Lobe; TSR, Temporo-sylvian Region; TpsR, Temporo-perisylvian Region; TPR, Temporo-parietal Region; L, Left; R, Right.
ID Age [yr.]
Sex Hand. LDH DOE [yr.]
CEZ
1 35 female right left 23 L MTL 2 45 male right N/A 44 R MTL 3 61 female right left 11 L TSR 4 53 female right left 18 R FTL 5 48 female left left 4 L MTL 6 27 male right left 19 L TpsR 7 40 female right left 23 L MTL 8 31 male right left 2 L TPR
was made to analyze the blocks separately (as done by Ewald et al 2012) in the current study, which remained focused on the task network rather than its modulations.
The experiment was controlled by the software E-Prime v2.0.1 (Psychology Software Tools, Pittsburgh, USA). For the duration of the procedure, an experimenter was sitting near the participant to monitor the task and take note of erroneous responses. In four participants, naming latencies were recorded with a microphone. When available (i.e., for half the pa-tients), these latencies were used to identify inappropriate recordings, defined as trials with a response time inferior to 200 ms (e.g., anticipations or noisy hesitations). In all participants,
Fig. 3: Trial structure in the experimental task.
Patients named pictures in various blocks of 30 trials each, constructed by repeating 6 dif-ferent items in a random order. The pictures were from Snodgrass and Vanderwart (1980).
inappropriate responses (errors, omissions, etc.) were identified online by the experimenter during the procedure. All inappropriate recordings and responses were excluded from the functional data analysis.
2.3 Neural recordings
During the task, continuous SEEG was recorded for all participants. For each participant, 8–13 stereotactically placed depth electrodes were implanted. The electrode contacts were 0.8 mm in diameter, 2 mm in length, and spaced 1.5 mm apart. Depth electrodes were in-serted in either orthogonal or oblique orientations using a robotic surgical implantation plat-form (ROSA, Medtech Surgical Inc., USA) allowing intracranial recording from lateral,
intermediate and/or deep cortical and subcortical structures in a three-dimensional arrange-ment (Johnson et al 2014). The day prior to surgery, volumetric pre-operative MRIs (T1, contrasted with Multihance 0.1 mmol kg−1) were obtained and used to pre-operatively plan electrode trajectories. All trajectories were evaluated for safety; any trajectory that appeared to compromise vascular structures was adjusted appropriately without affecting the sampling from areas of interest.
SEEG electrophysiological data was acquired using a conventional clinical electrophysi-ology acquisition system (Nihon Kohden 1200, Nihon Kohden America, USA) at a sampling rate of 1 kHz and 300 Hz anti-aliasing filter. Behavioral event data were simultaneously ac-quired during behavioral experiments along with the SEEG electrophysiology and stored for subsequent analysis. All signals were referenced to a contact affixed to the skull. Archived electrophysiological data was not filtered prior to offline analysis.
Each patient had electrode contacts characterized according to anatomical location. The anatomical locations of all contacts were identified through inspection of post-operative imaging, requiring agreement by two clinical experts.
2.4 Regions of interest
Ten anatomical regions of interest (ROIs) were selected out of the 83 regions available based on previous work on the word production network reviewed in the introduction. These ROIs comprised four regions of the left temporal lobe, two regions of the left parietal lobe, and four regions of the left frontal lobe, which are illustrated in Fig. 2 and detailed in Table 3. Even if none of the participants had recordings from all ten regions, it was checked that each one had at least one recording in the posterior temporal/parietal region or in the frontal zone, to provide for a sizable connectivity analysis.
Fig. 4: Robotic SEEG technique.
Planning SEEG trajectories using the robotic software and pre-operative volumetric con-trasted T1 sequence MRI.
2.5 Signal processing
Spectral analysis, artifact removal, and normalization. To remove electric line noise, fre-quencies around 60 Hz and their harmonics were attenuated using a Notch filter, specifically, a second-order IIR notch filter centered around 60 Hz with a bandwidth of 3 Hz and a band-width attenuation of 1 dB; the same parameters were then used to remove the first harmonic, i.e.centered around 120 Hz). The oscillatory power of each signal was then calculated using the Continuous Morlet Wavelet Transform (CWT) (Morlet 1983). Wavelet coefficients were
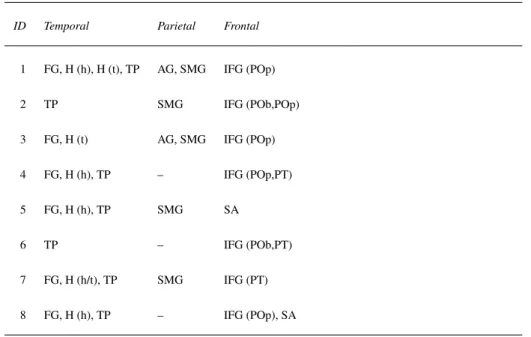
Table 3: Left hemisphere coverage in each patient.
AG, Angular Gyrus; FG, Fusiform Gyrus; H (h), Hippocampus (Head); H (t), Hippocampus (Tail); IFG (POb), Inferior Frontal Gyrus (Pars Orbitalis); IFG (POp), Inferior Frontal Gyrus (Pars Opercularis); IFG (PT), Inferior Frontal Gyrus (Pars Triangularis); SA, Subcentral Area; SMG, Supramarginal Gyrus; TP, Temporal Pole.
ID Temporal Parietal Frontal
1 FG, H (h), H (t), TP AG, SMG IFG (POp) 2 TP SMG IFG (POb,POp) 3 FG, H (t) AG, SMG IFG (POp) 4 FG, H (h), TP – IFG (POp,PT) 5 FG, H (h), TP SMG SA
6 TP – IFG (POb,PT) 7 FG, H (h/t), TP SMG IFG (PT) 8 FG, H (h), TP – IFG (POp), SA
calculated for each SEEG electrode contact at 33 different frequencies ranging from 10 to 155 Hz. Wavelet power time-series were computed by taking the square absolute value of these frequency coefficients, and smoothing them in time using a 100 ms window sliding at 25 ms steps. The wavelet method was chosen over the usual Fourier transform (Dumer-muth et al 1977) to preserve the time-course information of the SEEG signal. However, it is noteworthy that the temporal width of the wavelet varies as a function of the frequency (Herrmann et al 2005). The duration of the sliding window (100 ms) was selected to cover the entire width of the wider wavelet (i.e., the 10 Hz wavelet) which was of approximately 95 ms.
Extreme values of power, potentially related to artifacts, were identified and treated as follows. For every contact, the log of the power was computed for each of the 33 Morlet frequencies separately, to take into account the 1/ f distribution of power across f . Within each frequency, log-power values were sorted and divided in 100 percentiles. Values above and below 1.5 × IQR (IQR: interquartile range) were considered as outliers and excluded from the data. Later, after epoching (see below), trials were inspected for their proportions of such extreme power values. Trials in which at least 10 frequencies showed many extreme power values, defined as 75% or more excluded values, were removed from the analysis. This resulted in the exclusion of an average of 7.5 ± 5.9 trials per patient. Finally, the log-power time-series for each Morlet frequency was normalized by removing the mean and by dividing by the standard deviation of the pre-processed data.
Cluster-based nonparametric statistical test. The next step of the analysis sought to iden-tify contacts in the ROIs for which neural activity was significantly different between the baseline and the stimulus periods, i.e., which contacts contained task-relevant information. To do so, the normalized signal (see previous section) was segmented into 1500 ms epochs containing the fixation point and the picture display for every trial. Each of these epochs was further separated in two distinct periods to be compared: the baseline period and the stimulus-response period.
Baseline periods were time-locked to the onset of the fixation point and lasted 500 ms. Stimulus-response periods were time-locked to the onset of the picture and lasted 1000 ms. Because baseline periods were half the duration of picture periods (21 time-points vs. 41), the mean value of the log power across the 21 time windows was computed and replicated to reach a total duration of 41 time windows (i.e., baseline periods were represented by their log-power average across time). This choice was made after verifying that the
base-line appeared rather stable across time for the whole duration of each epoch, with minimal deviations from the mean (SD/mean ' 0.0015).
The statistical analysis explored the contrast between baseline vs. stimulus periods across all time-points and frequency values using independent two-sample t-tests. To deal with the multiple comparisons problem across time and frequency, a cluster-based non-parametric statistical test was used (Maris and Oostenveld 2007; Maris 2012), adapted here for in-tracerebral data. For each contact, a surrogate distribution of cluster values was created by permuting the condition labels (i.e., baseline vs. stimulus period) between trials. Within each of the 2000 random partition, t-statistics were computed for each time and frequency combi-nation using an independent two-sample t-test. The resulting p-values were stored in a new p-value map (2000 × time × frequency). Significant samples (p-value < 0.05) that were adjacent either in frequency or in time in this map were grouped in clusters. Cluster-level statistics were calculated by taking the sum of all the t-statistics within each cluster; the maximum value across the clusters of each permutation were included in the surrogate dis-tribution. By putting the 2000 random partitions together to form a new null-distribution at the cluster-statistic level, it was now possible to compare the observed cluster-level statis-tics resulting from the real comparison between the two conditions and to compute their final cluster-statistic significance (p-value < 0.05). With this method, effects that are strong, long-lasting, and/or involving several frequencies are more likely to be significant than lo-calized transient effects. Contacts in which no significant cluster was found were removed from further analysis.
The statistical clustering procedure was computed for the whole time-frequency plane, which was then inspected in more detail. Based on this examination, and on our interest for the β and the γhigh band (see Introduction), the significant clusters were cropped to their
intersection with the frequency bands of interest: the β band (12–30 Hz), and the γhighband
(70–150 Hz).
2.6 Connectivity analysis
The operationalization of the hypothesis to be tested was that two brain regions are func-tionally connected if their trial-by-trial correlation in a specified frequency band was signif-icantly positive or negative when compared to a null-distribution.
Within each patient. To test the hypothesis, we first computed two signals for each task-relevant contact and for each trial: β power and γhighpower time-series. Then, for every
task-relevant pair of contacts (i.e., with significant task-evoked activity), we computed the Pearson’s correlation coefficient between the time-series of single trials within each fre-quency band. This correlation has a value of 1 for total positive linear correlation, 0 for no linear correlation, and −1 for total negative linear correlation (Fig 5a). The inter-regions pairwise correlations form a distribution for which we computed the 5% and 95% confidence bounds. Every pair of task-relevant contacts that fell below the 5thpercentile or above the 95thpercentile were designated as significantly functionally connected. Finally, we created
a patient-specific connectivity matrix whose (i, j) entry was the proportion of (i, j) contacts-pairs that were both task-relevant and functionally connected above threshold, among all the (i, j) contacts-pairs sampled in the patient (Fig 5b).
Group analysis. Beyond the quantification of intra-patient connectivity as single cases, a group analysis was computed to derive a more general picture of the word production net-work while dealing with the inevitable variability of brain signal across patients. Specifi-cally, the binary (thresholded) connectivity matrices for each frequency band were added
and a percentage matrix was computed by dividing each summed number by the actual total number of available connectivities.
3 Results
3.1 Behavioral results
A summary of behavioral performance across participants can be found in Table 4; when available, naming latencies are included. The rate of correct response was fairly good com-pared to other patients of the same population. As expected, the available naming latencies appeared highly variable from trial to trial within the 600–1400 ms range, a range which is typical also of healthy speakers (Snodgrass and Yuditsky 1996). Based on these values, a window duration of 1000 ms following picture onset was hypothesized to encompass most of the language production processes across participants and trials. The signal processing procedure described above (e.g. definition of time-window of interest) took into account this observation and was applied to correct trials only.
3.2 Task activity
The satellite map (Fig 6) displays an overview of the activities elicited by the task in the fre-quency domain, for all brain areas of interest, across all patients. Regarding this task activity, the most remarkable result is the high consistency within and across patients of the responses observed in FG: a positive cluster with an early latency in higher frequencies, and a negative cluster in lower frequencies. A comparable pattern, delayed in latency, is observed in IFG Pars Opercularis, although here high frequency negative clusters prevail on some contacts. A somewhat similar pattern of activity, but much more variable across contacts and patients,
IFG (PT) IFG (POp) FG H (H) TP IFG (PT) IFG (POp) FG H (H) TP -1 -0.8 -0.6 -0.4 -0.2 0 0.2 0.4 0.6 0.8 1
(a) Trial-by-trial Pearson Correlation Matrix. Red values (Pearson’s correlation coefficient near 1) indicate nearly total positive linear correlation, white values (Pearson’s correlation coefficient near 0) indicate no linear correlation, and blue values (Pearson’s correlation coefficient near −1) is nearly total negative linear correlation. Regions sampled in this patient, abbreviations as in Table 3.
IFG (POb)IFG (PT) IFG (POp)SA SMG AG FG H (H) H (T) TP IFG (POb) IFG (PT) IFG (POp) SA SMG AG FG H (H) H (T) TP 0 0.1 0.2 0.3 0.4 0.5 0.6 0.7 0.8 0.9 1
(b) Summarized Pearson Correlation Matrix. The Pearson’s correlation coefficients have been summarized across contacts within each region, see text for details on the procedure. Regions sampled in all patients, abbreviations as in Table 3.
Fig. 6: Overview of task activity on all the recording contacts.
Each column represents a region. Each panel represents a bi-polar recording montage (dif-ference between adjacent contacts), and depicts the baseline corrected power across the fre-quency plane (0–150 Hz), during the stimulus-response interval (0–1 s). The time-frefre-quency clusters circled in black were revealed by the non-parametric significance test. The color border of each panel codes patient identity.
Table 4: Behavioral performance across the patients.
ID Number of trials
Correct / Other Response time [ms] (mean± SD) 1 240 240 / 0 NA 2 240 240 / 0 NA 3 240 233 / 7 849 ± 229 4 240 212 / 28 999 ± 415 5 240 240 / 0 NA 6 120 120 / 0 NA 7 240 240 / 0 753 ± 179 8 180 153 / 27 1137 ± 381
was detected in the other sub-areas of IFG, Pars Triangularis and Pars Orbitalis, as well as in the parietal ROIs SMG and AG. SA activation, when detected, is clearly present later, around the time where vocalization begins (700–850 ms). This late response is observed in three contacts out of seven, all in one patient, as would be expected if the activation where very focal. Finally, between one third and one half of the contacts in Hippocampus (head and tail) and TP showed positive or negative clusters in high frequencies. Most of the clus-ters, however, were observed in low frequencies. There was great variability of the activation pattern within these latter ROIs. This could be expected for the large definition of region TP, and was more surprising for the much smaller sub-regions within hippocampus. Again, this is suggestive of rather focal responses, not detected on all contacts.
As a complementary information, the cells on the diagonal of the β and γhighpercentage
specif-ically, above-threshold within-patient correlations between the different recording contacts in each region. Within-patient consistency was always high, with the possible exception of IFG Pars Orbitalis.
3.3 Functional connectivity results
Group connectivity matrices (Fig. 7) quantify the similarity of task related neurophysiolog-ical activity across the brain areas of interest, now at the level of the population studied. These matrices indicate, for each pair of regions, the proportion of patients showing supra-threshold connectivity, based on the single-trial correlation of activities between the two regions (see Methods for details). Such proportion is always computed against the sub-population for which each pair of regions was simultaneously sampled (i.e., between 1 and 5 patients; sampling details in Table 3). The matrices on Fig. 7 are further summarized in Fig. 8.
The most visible observation is that, within the sub-lobar frontal, temporal, and parietal regions (Table 3), connectivity was by and large similarly detected in the γhighand β bands.
Between lobe connectivity is much more discrete. Parieto-frontal and fronto-temporal net-work connectivity are more often detected in γhighthan in β band, while the parieto-temporal
network reveals largely similar connections in the two frequency bands. We review in turn each of these nodes, and then each of the sub-networks.
Frontal regions. There were significant correlations between all three IFG regions, although such pairs were sampled only on one patient each. SA showed no correlation IFG Pars Opercularis.
Parietal regions. The two regions were consistently connected (in 2 out of 2 patients) in the β band, but less consistently so (1 out of 2 patients) in the γhighband.
Temporal regions. Among temporal regions, the clearest functional connectivity was ob-served within hippocampus, between its head and tail, in the β band (and for 1 out of 2 patients in the γhighband). There were reliable connections between FG, TP, and the head
of hippocampus. More specifically, FG and TP activity were correlated in the β band, and slightly less reliably in the γhighband; FG and the head of hippocampus also showed
corre-lated activity, again more reliable in the β band; finally, TP and the head of hippocampus were correlated in both frequency bands. We note that temporal regions were those that were most often sampled in this studied (higher patient numbers for each region, visible in the diagonal cells), hence providing the more robust test within the ventral pathway.
Parieto-frontal network. SMG was connected with IFG Pars Triangularis in the γhighband,
more reliably than to IFG Pars Opercularis. AG, in turn, was connected (in 1 out of 2 pa-tients) to IFG Pars Opercularis. The other connections, particularly in β , were either not-significant or not sampled.
Parieto-temporal network. Connectivity was observed (in 1 out of 2 patients) between AG and FG in both frequency bands. The connections between SMG and temporal regions were less reliable.
Fronto-temporal network. The fronto-temporal network is visible in a subset of the patients, never more than 2 out of 4. IFG Pars Triangularis and FG were correlated in the β band, but not in the γhighband. IFG Pars Opercularis was correlated to TP and the tail of hippocampus,
temporal pole (TP) and was present in 1 out of 2 patients. SA did not show any consistent connectivity with the temporal regions.
4 General Discussion
Previous research has established the existence of various pathways connecting language regions, often on the basis of animal models, or human functional connectivity at rest. Only a few studies have resorted to neurophysiological signals recorded during word production tasks have also been analyzed. These have used a variety of processing methods, and high-lighted quite diverse conclusions (Table 1). Given this diversity, more research is needed to understand the functional connectivity underlying the primary ability of word production.
In the current study, we explored whether the posited language processing pathways could be identified in neurophysiological signals during a cognitive language production task. We resorted to bipolar stereo-tactic EEG (SEEG) measures, allowing a very precise location of activities recorded with high temporal resolution. We combined a cluster-based non-parametric statistical test, to identify task-active regions, with a frequency-specific cor-relation measure, to assess functional connectivity between recording contacts across re-gions. Our exploration was focused on frontal, parietal and temporal regions, which have been previously associated in various models with semantically driven word production (e.g. during picture naming: Hickok 2012; Roelofs 2014; Ueno et al 2011).
4.1 Minor differences in the β and γhighnetworks
In language research, particularly about language production, the specific roles played by oscillations occurring at different frequencies remain largely an open question. The β and
2 1 1 0 1 0 0 0 0 2 1 3 1 0 1 0 2 2 1 3 1 1 5 1 3 2 4 3 2 4 0 0 1 2 1 0 2 2 0 2 1 1 3 1 5 2 4 3 3 4 0 0 2 0 2 2 2 1 2 1 0 2 4 2 4 2 6 5 3 5 0 2 3 2 3 1 5 5 2 5 0 1 2 0 3 2 3 2 3 2 2 3 4 2 4 1 5 5 2 7 IFG (POb)IFG (PT) IFG (POp)SA SMG AG FG H (H) H (T) TP IFG (POb) IFG (PT) IFG (POp) SA SMG AG FG H (H) H (T) TP 0 10 20 30 40 50 60 70 80 90 100
(a) β Percentage Matrix.
2 1 1 0 1 0 0 0 0 2 1 3 1 0 1 0 2 2 1 3 1 1 5 1 3 2 4 3 2 4 0 0 1 2 1 0 2 2 0 2 1 1 3 1 5 2 4 3 3 4 0 0 2 0 2 2 2 1 2 1 0 2 4 2 4 2 6 5 3 5 0 2 3 2 3 1 5 5 2 5 0 1 2 0 3 2 3 2 3 2 2 3 4 2 4 1 5 5 2 7 IFG (POb)IFG (PT) IFG (POp)SA SMG AG FG H (H) H (T) TP IFG (POb) IFG (PT) IFG (POp) SA SMG AG FG H (H) H (T) TP 0 10 20 30 40 50 60 70 80 90 100
(b) γhighPercentage Matrix.
Fig. 7: Whole Population Connectivity Analysis in the Picture Naming Task, Distinguishing the β and γhighBands.
The colour scale indicates the percentage of patients with supra-threshold connectivity be-tween each pair of ROIs. The number in each block indicates the total number of participants in which the pair of ROIs was sampled. Grey cells correspond to pairs of regions that were not sampled simultaneously within any patient. Region name abbreviations are as in Table 3.
Fig. 8: Summary of the functional connectivity observed during word production across two frequency bands.
The left and right columns are for β and γhighfrequency bands, respectively. (Top) Schematic
representation on a saggital view of the left hemisphere of the functional connections be-tween the ten regions of interest. (Bottom) Network representation of the same data. Color represents the proportion of patients showing supra-threshold connectivity, as in Fig-ure 7. Line thickness represents the number of patients in the sample. Region abbrevia-tions are for: AG, Angular Gyrus; FG, Fusiform Gyrus; H (h), Hippocampus (head); H (t), Hippocampus (tail); IFG (POb), Inferior Frontal Gyrus (Pars Orbitalis); IFG (POp), Infe-rior Frontal Gyrus (Pars Opercularis); IFG (PT), InfeInfe-rior Frontal Gyrus (Pars Triangularis); SA, Subcentral Area; SMG, Supramarginal Gyrus; TP, Temporal Pole.
γhighbands were distinguished here because they have been linked to various language
pro-duction processes in different contexts (see Intropro-duction).
Based on current frameworks (Donner and Siegel 2011), we expected that lower fre-quency oscillations would play a prominent role in long-range communication and infor-mation transfer. Surprisingly, this was not the case A possible interpretation of the regional (i.e. within lobe) β network we observed would be a better efficiency of top-down modula-tion conveyed by the β rhythms (Engel and Fries 2010). Overt picture naming task requires the integration of lexico-semantic, and phonological information, via selection processes, which can be linked to the temporal, parietal and frontal lobes, respectively (Indefrey 2011). A reasonable speculation is that the local connectivity in the beta band within these re-gions reflects the dominance of endogenous top-down influences for a faster and accurate response. Because the connectivity in both frequency bands was not markedly different, we will not systematically distinguish β and γhighconnectivity in the discussion, as originally
planned, only acknowledge that the findings more often concerned γhigh. Still, given the
pos-tulated contrast between the roles of the two frequency bands inter-areal communication, it would be important that future work on functional connectivity during word production ex-plores neural activation beyond the more popular γhighband (e.g., Llorens et al 2016; Piai
et al 2015).
4.2 Functional sub-networks revealed
Parieto-frontal network. Regions in the left parietal lobe (AG and SMG) were connected in some patients to different sub-regions in the frontal area. This is in broad agreement with previous findings in structural connectivity (Catani and Mesulam 2008; Petrides 2014), as well as resting state functional connectivity (Margulies and Petrides 2013; Parlatini et al
2017). These regions are linked by the superior longitudinal fasciculus and the arcuate fas-ciculus, whose damage entails conduction aphasia. We note however that our results did not reveal more fine grained distinctions that could have been expected (Margulies and Petrides 2013; see also Petrides and Pandya 2009). For example, we expected that SMG would show preferential connectivity to Pars opercularis, but instead we observed more reliable connec-tivity to Pars Triangularis. In contrast, Pars Opercularis was significantly connected to AG in one patient. The exploratory nature of our analysis, particularly the thresholding proce-dure, warrants further assessments of the differential strengths of the connections in these contrasts. We come back to this point below.
Parieto-temporal network. We highlight the connectivity between both parietal regions (supra-marginal gyrus, SMG, and angular gyrus, AG), and the fusiform gyrus FG. The AG-FG connection is consistent with Uddin et al (2010), and could presumably be sustained by the temporo-parietal white matter bundle connecting these regions (Wu et al 2016).
Fronto-temporal network. Significant functional connectivity was detected in some patients between the temporal pole and the three IFG subdivisions. These regions are anatomically connected by the uncinate fasciculus and the extreme capsule (Catani et al, 2005). The im-portance of this ventral pathway for semantically driven word production has been debated, with arguments in favor (Ueno et al 2011) and against it (Roelofs 2014). While these results do not establish the direct connectivity, let alone anatomical connections, they give some support to the model in which semantically driven word production does involve a ventral pathway (Ueno et al 2011). This conclusion does not exclude the possibility of the dorsal pathway mediated by AG, but we did not detect here any significant AG-TP connectivity (sampled in one patient).
The IFG has been frequently attributed roles in selection processes and in formulating an articulatory code during word production (Indefrey 2011; for evidence based on intra-cranial γhigh, see: Flinker et al 2015; Ri`es et al 2017). Consistent with a hierarchical structure of
functions across the three sub-parts of IFG (see Bourguignon 2014, for review) in IFG, the significant connectivity between temporal areas and IFG was detected most often with Pars Opercularis in our picture naming task. The hippocampus tail displayed reliable connectiv-ity with Pars Opercularis in 1 out of 2 patients. If confirmed, such hippocampal-prefrontal functional connectivity during word retrieval would add some credence to the involvement of hippocampus in visual word retrieval (Hamam´e et al 2014; Llorens et al 2016; see also Covington and Duff 2016; Piai et al 2016; Sheldon et al 2016).
In contrast, we did not observe any significant connectivity between Pars Opercularis and SA, which is part of the ventral sensory motor cortex (Conant et al 2018; Conant et al for an earlier review, see 2014). This is in contrast with the reliable γhighfunctional
connec-tivity, quantified with the Granger causality metric, reported by Flinker et al (2015) between “Broca’s” and motor areas. The connectivity we used is not time-resolved, and is computed with zero-lag, therefore it only reveals similar simultaneous activation across regions (see next section).
4.3 The choice of a connectivity metric
The connectivity metric we chose, correlation in the time-frequency domain for two fre-quency bands (β and γhigh), was intended to reveal zero-lag similarity between regions
irrespective of their respective signal power. Zero-lag similarity captures, in broad lines, the cognitive hypothesis of simultaneous (parallel) processing (Dubarry et al 2017). While serving this purpose, the metric likely misses other relevant signal information. Beyond the
choice of a particular metric, the analysis also required deciding about significance thresh-olds and summarizing procedures for the group analysis. Clearly, some of these decisions were heuristic, and the choices made were rather conservative (95% threshold for the corre-lations). It would be appropriate, in future studies, to perform a more exhaustive exploration of the connectivity space, contrasting various metrics and thresholds (as in Wang et al 2014). This exploration should be guided by a conjunction of cognitive and neurophysiological principles regarding the different processes that conform word production (Friederici and Singer 2015).
4.4 Limitations
Our study has the usual limitations inherent to studies of intracerebral activity in epileptic patients (reviewed in detail in Lachaux et al 2012). While there was a fairly diverse spatial sampling across the patients, some key regions were not available (e.g. middle temporal gyrus, often linked to lexical processing). In terms of numbers, a fair count of patients was available for every ROI, although the counts for ROI pairs was inevitably inferior. Overall, 9 out of 55 ROI pairs were not sampled (16%), but we note that 36 of them were sampled in two patients or more (65%). More thorough investigations will certainly be needed, perhaps focusing on each pathway at a time, with larger number of patients for each ROI pair.
The limitations in spatial sampling were partially compensated by our classification of intra-cerebral contacts into broad regions, at the expense of the highly-specific anatomical details that are characteristic of each patient’s stereotactic implantation coordinates. This spatial smoothing does not allow exploring finer grained subdivisions within each region. Indeed, some of the inconsistencies between our data and the literature based on other
meth-ods might be resolved in the future by finer-grained anatomical classification of the patients’ contacts.
As noted in the previous section, the signal processing procedure included a number of arbitrary decisions (e.g. thresholding step for quantifying the functional connectivity mea-sure at the group level). This part of the procedure was exploratory, and we did not assess the impact of such thresholding decisions beyond some informal verifications.
4.5 Conclusion and perspectives
The neural regions recruited during word production are relatively well established. Despite their recent framing in network and processing stream models, their functional connectivity has rarely been explored during language production tasks. In the current study, we started with neurophysiological signal with the highest temporal and spatial resolution, sacrificed some of its temporal resolution (time-frequency transformation, connectivity estimates in 1 second long windows), and of its spatial resolution (grouping of contacts in broad meaning-ful regions) in the interest of a group level analysis quantifying similar simultaneous activity across regions.
The results demonstrate some properties of three functional sub-networks, between the areas sampled in the temporal, parietal, and frontal lobes. Unexpectedly, long-range connec-tivity patterns were relatively similar in the β and γhighbands, possibly even more reliable
in the γhighband. The observed functional connectivities were by and large consistent with
white matter tracts postulated for the language circuitry. Among the main observations was the functional connectivity between the temporal pole and the inferior frontal gyrus, compat-ible with a ventral processing, as well as the links observed in some patients between parietal
regions (SMG and AG) and Pars Opercularis and Pars Triangularis, compatible with a dorsal processing pathway (but not in the details).
We believe that future work on task related functional connectivity during word produc-tion will benefit from signal processing developments (e.g., exploring other metrics integrat-ing directionality or temporal lags, explorintegrat-ing significance threshold definitions), and from the spatial specificity of single-case explorations.
4.6 On-line supplementary materials
References
Binder JR, Desai RH (2011) The neurobiology of semantic memory. Trends in Cognitive Sciences 15(11):527–536, DOI 10.1016/j.tics.2011.10.001
Bock K (1996) Language production: Methods and methodologies. Psychonomic Bulletin & Review 3(4):395–421, DOI 10.3758/BF03214545
Bourguignon NJ (2014) A rostro-caudal axis for language in the frontal lobe : The role of executive control in speech production. Neuroscience and Biobehavioral Reviews 47:431–444, DOI 10.1016/j.neubiorev. 2014.09.008
Broca P (1861) Remarques sur le si`ege de la facult´e du langage articul´e, suivies d’une observation d’aph´emie (perte de la parole) [Remarks on the seat of the faculty of articulated language, followed by an observa-tion of aphemia (loss of speech)]. Bulletin et M´emoires de la Soci´et´e Anatomique de Paris 6:330–357, URL http://psychclassics.yorku.ca/Broca/aphemie-e.htm
Catani M, Mesulam M (2008) The arcuate fasciculus and the disconnection theme in language and aphasia: history and current state. cortex 44(8):953–961, DOI 10.1016/j.cortex.2008.04.002
Catani M, Jones DK, et al (2005) Perisylvian language networks of the human brain. Annals of neurology 57(1):8–16
Clarke A, Tyler LK (2015) Understanding what we see: how we derive meaning from vision. Trends in cognitive sciences 19(11):677–687, DOI 10.1016/j.tics.2015.08.008
Collard MJ, Fifer MS, Benz HL, McMullen DP, Wang Y, Milsap GW, Korzeniewska A, Crone NE (2016) Cortical subnetwork dynamics during human language tasks. Neuroimage 135:261–272, DOI 10.1016/ j.neuroimage.2016.03.072
Conant D, Bouchard KE, Chang EF (2014) Speech map in the human ventral sensory-motor cortex. Current opinion in neurobiology 24:63–67
Conant DF, Bouchard KE, Leonard MK, Chang EF (2018) Human sensorimotor cortex control of directly-measured vocal tract movements during vowel production. Journal of Neuroscience pp 2382–17, DOI 10.1523/JNEUROSCI.2382-17.2018
Covington NV, Duff MC (2016) Expanding the Language Network: Direct Contributions from the Hippocam-pus. Trends in Cognitive Sciences 20(12):869–870, DOI 10.1016/j.tics.2016.10.006
Dell GS, Schwartz MF, Nozari N, Faseyitan O, Branch Coslett H (2013) Voxel-based lesion-parameter mapping: Identifying the neural correlates of a computational model of word production. Cognition
128(3):380–396, DOI 10.1016/j.cognition.2013.05.007
Donner TH, Siegel M (2011) A framework for local cortical oscillation patterns. Trends in Cognitive Sciences 15(5):191–199, DOI 10.1016/j.tics.2011.03.007
Dubarry AS, Llorens A, Tr´ebuchon A, Carron R, Li´egeois-Chauvel C, B´enar CG, Alario FX (2017) Estimat-ing Parallel ProcessEstimat-ing in a Language Task UsEstimat-ing SEstimat-ingle-Trial Intracerebral Electroencephalography. Psychological Science 28(4):414–426, DOI 10.1177/0956797616681296
Dumermuth G, Gasser T, Germann P, Hecker A, Herdan M, Lange B (1977) Studies on EEG activities in the beta band. European Neurology 16(1-6):197–202, DOI 10.1159/000114900
Engel AK, Fries P (2010) Beta-band oscillationssignalling the status quo? Current opinion in neurobiology 20(2):156–165
Ewald A, Aristei S, Nolte G, Abdel-Rahman R (2012) Brain oscillations and functional connectivity during overt language production. Frontiers in Psychology 3, DOI 10.3389/fpsyg.2012.00166
Flinker A, Korzeniewska A, Shestyuk AY, Franaszczuk PJ, Dronkers NF, Knight RT, Crone NE (2015) Redefining the role of Broca’s area in speech. Proceedings of the National Academy of Sciences 112(9):2871–2875, DOI 10.1073/pnas.1414491112
Fridriksson J, Yourganov G, Bonilha L, Basilakos A, Den Ouden DB, Rorden C (2016) Revealing the dual streams of speech processing. Proceedings of the National Academy of Sciences 113(52):15,108–15,113, DOI 10.1073/pnas.1614038114
Friederici AD, Singer W (2015) Grounding language processing on basic neurophysiological principles. Trends in Cognitive Sciences 19(6):1–10, DOI 10.1016/j.tics.2015.03.012
Fries P (2015) Rhythms for Cognition: Communication through Coherence. Neuron 88(1):220–235, DOI 10.1016/j.neuron.2015.09.034
Fuertinger S, Horwitz B, Simonyan K (2015) The functional connectome of speech control. PLOS Biology 13(7):1–31, DOI 10.1371/journal.pbio.1002209
Gaona CM, Sharma M, Freudenburg ZV, Breshears JD, Bundy DT, Roland J, Barbour DL, Schalk G, Leuthardt EC (2011) Nonuniform High-Gamma (60-500 Hz) Power Changes Dissociate Cognitive Task and Anatomy in Human Cortex. The Journal of neuroscience : the official journal of the Society for Neuroscience 31(6):2091–2100, DOI 10.1523/JNEUROSCI.4722-10.2011
Geschwind N (1970) The organization of language and the brain. Science 170(3961):940–944, DOI 10.1126/ science.170.3961.940
Goodale MA, Milner AD (1992) Separate visual pathways for perception and action. Trends in Neurosciences 15(1):20–25, DOI 10.1016/0166-2236(92)90344-8
Grill-Spector K, Weiner KS (2014) The functional architecture of the ventral temporal cortex and its role in categorization. Nature Reviews Neuroscience 15(8):536–548, DOI 10.1038/nrn3747
Hamam´e CM, Alario FX, Llorens A, Li´egeois-Chauvel C, Tr´ebuchon-Da Fonseca A (2014) High frequency gamma activity in the left hippocampus predicts visual object naming performance. Brain and Language 135:104–114, DOI 10.1016/j.bandl.2014.05.007
Han Z, Ma Y, Gong G, Huang R, Song L, Bi Y (2016) White matter pathway supporting phonological encoding in speech production: a multi-modal imaging study of brain damage patients. Brain Structure and Function 221(1):577–589, DOI 10.1007/s00429-014-0926-2
Hassan M, Benquet P, Biraben A, Berrou C, Dufor O, Wendling F (2015) Dynamic reorganization of func-tional brain networks during picture naming. Cortex 73:276–288, DOI 10.1016/j.cortex.2015.08.019 Herrmann CS, Grigutsch M, Busch NA (2005) EEG oscillations and wavelet analysis. In: Handy TC (ed)
Event-related Potentials: A Methods Handbook, MIT Press, Cambridge, MA, pp 229–259
Hickok G (2012) Computational neuroanatomy of speech production. Nature Reviews Neuroscience 13:135– 45, DOI 10.1038/nrn3158
Indefrey P (2011) The Spatial and Temporal Signatures of Word Production Components: A Critical Update. Frontiers in Psychology 2:255, DOI 10.3389/fpsyg.2011.00255
Johnson MA, Thompson S, Gonzalez-Martinez J, Park HJ, Bulacio J, Najm I, Kahn K, Kerr M, Sarma SV, Gale JT (2014) Performing behavioral tasks in subjects with intracranial electrodes. Journal of Visualized Experiments: JoVE 92(e51947), DOI 10.3791/51947
Korzeniewska A, Franaszczuk PJ, Crainiceanu CM, Kuł R, Crone NE (2011) Dynamics of large-scale cortical interactions at high gamma frequencies during word production: Event related causality (ERC) analy-sis of human electrocorticography (ECoG). NeuroImage 56(4):2218–2237, DOI 10.1016/j.neuroimage. 2011.03.030
Lachaux JP, Axmacher N, Mormann F, Halgren E, Crone NE (2012) High-frequency neural activity and hu-man cognition: Past, present and possible future of intracranial EEG research. Progress in Neurobiology 98(3):279–301, DOI 10.1016/j.pneurobio.2012.06.008
Lambon-Ralph MA, Jefferies E, Patterson K, Rogers TT (2016) The neural and computational bases of se-mantic cognition. Nature Reviews Neuroscience 18:42–55, DOI 10.1038/nrn.2016.150
Lichtheim L (1885) On aphasia. Brain 7:433–484, DOI 10.1093/brain/7.4.433
Liljestr¨om M, Kujala J, Stevenson C, Salmelin R (2015) Dynamic reconfiguration of the language network preceding onset of speech in picture naming. Human Brain Mapping 36(3):1202–1216, DOI 10.1002/ hbm.22697
Llorens A, Tr´ebuchon A, Li´egeois-Chauvel C, Alario FX (2011) Intra-cranial recordings of brain activity during language production. Frontiers in psychology 2, DOI 10.3389/fpsyg.2011.00375
Llorens A, Tr´ebuchon A, Ri`es S, Li´egeois-Chauvel C, Alario FX (2014) How familiarization and repetition modulate the picture naming network. Brain and Language 133:47–58, DOI 10.1016/j.bandl.2014.03. 010
Llorens A, Dubarry AS, Tr´ebuchon A, Chauvel P, Alario FX, Li´egeois-Chauvel C (2016) Contextual modulation of hippocampal activity during picture naming. Brain and Language 159:92–101, DOI 10.1016/j.bandl.2016.05.011
Makris N, Pandya DN (2009) The extreme capsule in humans and rethinking of the language circuitry. Brain Structure and Function 213(3):343, DOI 10.1007/s00429-008-0199-8
Margulies DS, Petrides M (2013) Distinct Parietal and Temporal Connectivity Profiles of Ventrolateral Frontal Areas Involved in Language Production. Journal of Neuroscience 33(42):16,846–16,852, DOI 10.1523/ jneurosci.2259-13.2013
Maris E (2012) Statistical testing in electrophysiological studies. Psychophysiology 49(4):549–565, DOI 10.1111/j.1469-8986.2011.01320.x
Maris E, Oostenveld R (2007) Nonparametric statistical testing of EEG and MEG data. Journal of Neuro-science Methods 164(1):177–190, DOI 10.1016/j.jneumeth.2007.03.024
Morlet J (1983) Sampling theory and wave propagation. In: Chen C (ed) Issues in Acoustic Signal – Im-age Processing and Recognition, NATO ASI Series (Series F: Computer and System Sciences), vol 1, Springer, Berlin, Heidelberg, pp 233–261
Moscovitch M, Cabeza R, Winocur G, Nadel L (2016) Episodic memory and beyond: The hippocampus and neocortex in transformation. Annual Review of Psychology 67(1):105–134, DOI 10.1146/annurev-psych-113011-143733
Papagno C (2011) Naming and the role of the uncinate fasciculus in language function. Current neurology and neuroscience reports 11(6):553, DOI 10.1007/s11910-011-0219-6
Parlatini V, Radua J, Dell’Acqua F, Leslie A, Simmons A, Murphy DG, Catani M, de Schotten MT (2017) Functional segregation and integration within fronto-parietal networks. NeuroImage 146:367–375, DOI 10.1016/j.neuroimage.2016.08.031
Petrides M (2014) Neuroanatomy of Language Regions of the Human Brain. Academic Press, London, UK Petrides M, Pandya DN (2009) Distinct parietal and temporal pathways to the homologues of Broca’s area in
the monkey. PLoS biology 7(8):e1000,170, DOI 10.1371/journal.pbio.1000170
Piai V, Roelofs A, Rommers J, Maris E (2015) Beta oscillations reflect memory and motor aspects of spoken word production. Human Brain Mapping 36(7):2767–2780, DOI 10.1002/hbm.22806
Piai V, Anderson KL, Lin JJ, Dewar C, Parvizi J, Dronkers NF, Knight RT (2016) Direct brain recordings reveal hippocampal rhythm underpinnings of language processing. Proceedings of the National Academy of Sciences 113(40):11,366–11,371, DOI 10.1073/pnas.1603312113
Poeppel D, Emmorey K, Hickok G, Pylkk¨anen L (2012) Towards a new neurobiology of language. Journal of Neuroscience 32(41):14,125–14,131, DOI 10.1523/JNEUROSCI.3244-12.2012
Price CJ (2012) A review and synthesis of the first 20 years of PET and fMRI studies of heard speech, spoken language and reading. Neuroimage 62(2):816–847, DOI 10.1016/j.neuroimage.2012.04.062
Ri`es SK, Dhillon RK, Clarke A, King-Stephens D, Laxer KD, Weber PB, Kuperman RA, Auguste KI, Brun-ner P, Schalk G, Lin JJ, Parvizi J, Crone NE, Dronkers NF, Knight RT (2017) Spatiotemporal dynamics of word retrieval in speech production revealed by cortical high-frequency band activity. Proceedings of the National Academy of Sciences 114(23):E4530–E4538, DOI 10.1073/pnas.1620669114
Roelofs A (2014) A dorsal-pathway account of aphasic language production: The WEAVER++/ARC model. Cortex 59:33–48, DOI 10.1016/j.cortex.2014.07.001
Rogalsky C, Poppa T, Chen KH, Anderson SW, Damasio H, Love T, Hickok G (2015) Speech repetition as a window on the neurobiology of auditory-motor integration for speech: A voxel-based lesion symptom mapping study. Neuropsychologia 71:18–27, DOI 10.1016/j.neuropsychologia.2015.03.012
Rolston JD, Chang EF (in press) Critical language areas show increased functional connectivity in human cortex. Cerebral Cortex pp 1–8, DOI 10.1093/cercor/bhx271
Saur D, Kreher BW, Schnell S, Kummerer D, Kellmeyer P, Vry MS, Umarova R, Musso M, Glauche V, Abel S, Huber W, Rijntjes M, Hennig J, Weiller C (2008) Ventral and dorsal pathways for language. Proceed-ings of the National Academy of Sciences 105(46):18,035–18,040, DOI 10.1073/pnas.0805234105
Schwartz MF, Faseyitan O, Kim J, Coslett HB (2012) The dorsal stream contribution to phonological retrieval in object naming. Brain 135(12):3799–3814, DOI 10.1093/brain/aws300
Sheldon S, Moscovitch M (2012) The nature and time-course of medial temporal lobe contributions to se-mantic retrieval: An fmri study on verbal fluency. Hippocampus 22(6):1451–1466
Sheldon S, McAndrews MP, Pruessner J, Moscovitch M (2016) Dissociating patterns of anterior and poste-rior hippocampal activity and connectivity during distinct forms of category fluency. Neuropsychologia 90:148–158, DOI 10.1016/j.neuropsychologia.2016.06.028
Snodgrass JG, Vanderwart M (1980) A standardized set of 260 pictures: norms for name agreement, image agreement, familiarity, and visual complexity. Journal of Experimental Psychology: Human Learning and Memory 6(2):174, DOI 10.1037/0278-7393.6.2.174
Snodgrass JG, Yuditsky T (1996) Naming times for the Snodgrass and Vanderwart pictures. Behavior Re-search Methods 28(4):516–536, DOI 10.3758/BF03200540
Tremblay P, Dick AS (2016) Broca and Wernicke are dead, or moving past the classic model of language neurobiology. Brain and Language 162:60–71, DOI 10.1016/j.bandl.2016.08.004
Uddin LQ, Supekar K, Amin H, Rykhlevskaia E, Nguyen DA, Greicius MD, Menon V (2010) Dissociable connectivity within human angular gyrus and intraparietal sulcus: evidence from functional and struc-tural connectivity. Cerebral Cortex 20(11):2636–2646, DOI 10.1093/cercor/bhq011
Ueno T, Saito S, Rogers TT, Lambon Ralph MA (2011) Lichtheim 2: synthesizing aphasia and the neural basis of language in a neurocomputational model of the dual dorsal-ventral language pathways. Neuron 72(2):385–396, DOI 10.1016/j.neuron.2011.09.013
Wang HE, B´enar CG, Quilichini PP, Friston KJ, Jirsa VK, Bernard C (2014) A systematic framework for functional connectivity measures. Frontiers in neuroscience 8:405
Wang XJ (2010) Neurophysiological and computational principles of cortical rhythms in cognition. Physio-logical reviews 90(3):1195–1268, DOI 10.1152/physrev.00035.2008
Wernicke C (1969) The symptom complex of aphasia. In: Cohen R, Wartofsky M (eds) Proceedings of the Boston Colloquium for the Philosophy of Science 1966/1968, Springer, Dordrecht, vol 4, pp 34–97, URL https://link.springer.com/chapter/10.1007/978-94-010-3378-7_2
Wu Y, Sun D, Wang Y, Wang Y, Wang Y (2016) Tracing short connections of the temporo-parieto-occipital re-gion in the human brain using diffusion spectrum imaging and fiber dissection. Brain research 1646:152– 159, DOI 10.1016/j.brainres.2016.05.046