HAL Id: cea-02384282
https://hal-cea.archives-ouvertes.fr/cea-02384282
Submitted on 28 Nov 2019
HAL is a multi-disciplinary open access
archive for the deposit and dissemination of
sci-entific research documents, whether they are
pub-lished or not. The documents may come from
teaching and research institutions in France or
abroad, or from public or private research centers.
L’archive ouverte pluridisciplinaire HAL, est
destinée au dépôt et à la diffusion de documents
scientifiques de niveau recherche, publiés ou non,
émanant des établissements d’enseignement et de
recherche français ou étrangers, des laboratoires
publics ou privés.
Determination of zirconium isotope composition and
concentration for nuclear sample analysis using Thermal
Ionization Mass Spectrometry
Alexandre Quémet, Christophe Maillard, Alexandre Ruas
To cite this version:
Alexandre Quémet, Christophe Maillard, Alexandre Ruas. Determination of zirconium isotope
compo-sition and concentration for nuclear sample analysis using Thermal Ionization Mass Spectrometry.
In-ternational Journal of Mass Spectrometry, Elsevier, 2015, 392, pp.34-40. �10.1016/j.ijms.2015.08.023�.
�cea-02384282�
Determination of zirconium isotope composition and concentration for nuclear sample analysis using Thermal Ionization Mass Spectrometry
Alexandre Quemet*, Christophe Maillard and Alexandre Ruas
CEA, Nuclear Energy Division, RadioChemistry & Processes Department, F-30207 Bagnols sur Cèze, France
* Corresponding author. E-mail address: alexandre.quemet@cea.fr (A. Quemet)
Keywords: TIMS; zirconium; isotope ratio; isotope dilution; separation
Abstract:
A new Thermal Ionization Mass Spectrometer (TIMS) analytical procedure was developed to measure with high accuracy the zirconium isotope abundance and concentration without molybdenum correction in nuclear samples. A zirconium selective separation using UTEVA column was used before the TIMS measurement in order to remove all possible isobaric interferences (Mo, Y, Nb and Ru) in the solution. The separated solution was then deposited onto a filament previously outgassed for 4 hours to reduce the molybdenum traces in the filament. Then, the filament was introduced into the TIMS source and was maintained for 4 hours at a current of 5 A (ionization filament) and 1.2 A (evaporation filament) in order to eliminate all molybdenum trace present in the filament and in the sample. This methodology allowed the zirconium isotope abundance determination without using the molybdenum interference correction equation. The analytical results obtained with a natural solution after separation is in good accordance with the reference values: bias lower than 0.16 % for the 90Zr,
91Zr, 92Zr and 94Zr isotope abundance, and a bias of ~0.8 % for the minor isotope (96Zr) were observed. This
zirconium abundance determination methodology was used on three nuclear samples. Then, the calibration of a
91Zr spike solution was performed by reverse isotope dilution using a SPEX standard zirconium solution. The
zirconium concentration determination was then performed on the three nuclear samples by isotope dilution using the SPEX standard zirconium solution and the 91Zr spike solution. The final uncertainties were estimated to be lower than 1 %.
1. Introduction
Determination of zirconium concentration and isotope abundance is important for different applications such as life science [1], geology [2–6], environment [7], forensics [8] or nuclear field [9–13]. In nuclear applications, zirconium is used as a construction material in nuclear reactors [14] and is a fission product: the radioactive 93Zr isotope is produced mainly by nuclear fission of uranium-235 in nuclear fuel. During the treatment and recycling of spent nuclear fuel, the first step is the shearing where the fuel rods are cut into small pieces. This step involves the separation between the spent fuel and the cladding material, made of zirconium alloy which has a low solubility in a nitric acid media [15]. The dissolution of the spent fuel is effective in hot nitric acid media. The apparition of dissolution fines, in particular of zirconium and molybdenum, can clog the dissolver during the dissolution process or affect the extraction process [16,17]. Thus, the accurate zirconium isotope analysis is required to determine its origin (construction material or fission product) and to understand the nuclear processes undertaken. Also, the accurate determination of the zirconium concentration is of prime interest for waste management.
Several studies for zirconium isotope measurement have been reported in literature. They are mainly two principal techniques used for this kind of measurement: multiple collector-inductively coupled plasma mass spectrometer [2–4,9,10] (MC-ICP-MS) and thermal ionization mass spectrometry [1,2,5,6,8,18–20] (TIMS).
TIMS is a reference technique for isotope measurement [21–23]. TIMS allows reaching isotope ratio with high measurement trueness and precision. Another advantage of the TIMS is the possibility to perform concentration determination with low uncertainty, better than 1 %, thanks to the use of isotope dilution [2,19]. One of the major difficulty of zirconium measurements by TIMS is the low ionization efficiency of zirconium due to its high ionization potential (6.84 eV) [2]. Also, TIMS analysis requires an isobare pure fraction of the element of interest. Zirconium is mostly interfered by molybdenum. This is the reason why some separation methods have been developed in order to extract or eliminate the molybdenum [24–30]. Some TIMS studies corrected mathematically the molybdenum interference by an interference correction equation [1,8,12,18]. Nevertheless in the nuclear industry, the molybdenum isotope abundance is generally unknown and vary from a sample to another making the use of the interference correction equation difficult.
This paper presents an analytical procedure developed for the zirconium isotope abundance and concentration determination using TIMS for nuclear samples containing a high amount of zirconium. After a brief description of the separation procedure on UTEVA resin, a detailed description of the methodology developed to obtain accurate zirconium isotope abundance without molybdenum interference correction equation is reported. The results obtained with a SPEX solution are discussed and compared with previous data found in the literature. The procedure was then applied to three nuclear samples in order to determine the non-natural isotope abundance. Also, the 91Zr spike solution preparation and calibration are discussed. The zirconium concentrations in three nuclear samples were determined by isotope dilution in order to obtain the best accuracy.
2. Experimental
Materials, reagents and samples 2.1.
All solutions were prepared using polypropylene flasks, except for the zirconium solutions, which were prepared in PFA vials.
4 M and 8 M nitric acid solutions were prepared by diluting high purity nitric acid (Merck, Suprapur) with deionized water (resistivity: 18.2 MΩ.cm).
For the separation protocol, a (4 M / 0.1 M) HNO3/H2C2O4 mixture was prepared by diluting high purity nitric
acid with deionized water and by weighing oxalic acid dihydrated (Fluka). A (7 M / 1 M) HNO3/HF mixture was
prepared by diluting high purity nitric acid and hydrofluoric acid (Merck) with deionized water. A 1.5 M Al3+ solution was prepared to complex the fluoride present in some nuclear samples before the separation. This solution was prepared by dissolving aluminium nitrate (Merck) with deionized water. The UTEVA resin (Triskem) (100 – 150 µm particle size in 2 mL prepackaged columns) was used in the separation protocol in order to obtain a pure zirconium fraction.
A high precision balance (Mettler-Toledo) was used to prepare all the solutions. 2.1.1. Standard solutions
High purity zirconium and molybdenum standards were used to prepare the simulated solutions (section 3.1.3). They were prepared from single element ICP SPEX solution (1000 mg.L-1 ± 0.5 %, k = 2) diluted with appropriate amounts of 8 M nitric acid solution and deionized water in order to obtain a final solution at 4 M nitric acid.
For the first series of test of zirconium isotope composition (section 3.1.1 and 3.1.2), a solution at 5 µg.µ L-1 (± 10 %, k = 2) was prepared by evaporating 500 µL of the SPEX solution at 1000 mg.L-1 and then redissolving it with 100 µL of 4 M nitric acid.
2.1.2. Preparation of the enriched 91Zr solution
The zirconium spike solution was prepared by dissolving a 91Zr enriched (95.30 %) non-radioactive ZrO2 powder
provided by Eurisotop. The ZrO2 powder was dissolved in a (7 M / 1 M) HNO3 / HF mixture heated at 120 °C in
was achieved, the solution was diluted in order to obtain a HNO3 concentration of 4 M and a zirconium
concentration around 10 µg.g-1 (this solution is hereafter referred to as 91Zr spike solution). The concentration of this 91Zr spike solution was then determined with high accuracy by isotope dilution.
2.1.3. Particularity of the nuclear samples
The developed methodology was applied to three nuclear samples to determine the zirconium isotope abundance and concentration. These samples came from the dissolution of solids obtained in the dissolvers during the reprocessing of spent nuclear fuel.
These three samples, received in liquid form, were diluted with 8 M HNO3 and deionized water in order to
obtain a zirconium concentration around 100 mg.L-1 with a HNO3 concentration of 4 M. Sample 1 was the most
challenging in terms of separation: the Mo/Zr concentration ratio was close to 2.5. Zr of sample 1 was essentially a fission product. Sample 2 had a Mo/Zr concentration ratio close to 0.03. Finally, the ratio was close to 1 for sample 3. Zr of sample 2 and 3 was essentially issued from the construction material. The other major elements in the samples were Na and B. U, Pu and some lanthanides were also present in lower quantities. An ICP-OES analysis showed the samples were free other possible interfering elements for the zirconium isotope analysis such as yttrium (< 25 mg.L-1) and ruthenium (< 1 mg.L-1).
Separation procedure 2.2.
The zirconium isotopes to consider are 90Zr, 91Zr, 92Zr, 93Zr, 94Zr and 96Zr. Zirconium is potentially interfered by the molybdenum isotopes 92Mo, 94Mo and 96Mo, the radioactive yttrium isotope 90Y, the niobium isotope 93Nb and the ruthenium isotope 96Ru. High accuracy zirconium isotope measurements by TIMS require a sample preparation to remove isobaric interferences. Therefore, a separation step conducted on a UTEVA column was necessary. The operating procedure developed in this work is summarized in Figure 1.
The fluoride present in the sample was neutralized by the addition of a small quantity of Al3+ (molar ratio Al/F = 1). 5 mL of the zirconium sample at a concentration of about 100 mg.L-1 (500 µg) was directly loaded on the column, previously conditioned with 5 mL of 4 M HNO3. During this feeding step, the zirconium was fixed
on the UTEVA resin. The column was then washed with 15 mL of 4 M HNO3 in order to eliminate all
interfering elements. Finally, the zirconium was eluted with 5 mL of (4 M / 0.1 M) HNO3/H2C2O4 mixture. This
solution was evaporated and redissolved with 100 µL of HNO3 4 M in order to obtain a Zr concentration around
5 µg.µL-1 (± 20 %, k = 2). 1 µL of this solution was then deposited onto the filament. Instrumentation
2.3.
Isotope measurements were performed on a Thermo Scientific Triton Thermal Ionization Mass Spectrometer, equipped with a glove box. The analyzer is a low resolution magnetic field (resolution around 400). The instrument used for the experiments is equipped with 7 movable Faraday cups with high-ohmic resistors (1011 Ω). The Faraday cups were positioned to collect the six zirconium isotopes present in nuclear samples (90, 91, 92, 93, 94 and 96) and one non-interfered major isotope of molybdenum (95) in order to control the molybdenum contamination. The measurements were realized in multi-collection mode. Intercalibration gains of the faraday cup detectors were measured daily by an automated process. The gains were extremely stable with a repeatability lower than 0.001 %.
A double Re-filament configuration was used to control independently the evaporation and the ionization temperature. These filaments, provided by ATES, are obtained from a 99.995 % pure Re metal. 1 µL of solution was deposited onto the filament previously outgassed. After deposition, the sample was dried with a 0.5 A current. Then the current was progressively increased from 0.5 A to 2 A in 10 s and was maintained at 2 A for 5 s.
TIMS analysis 2.4.
Two different TIMS analytical procedures were used for the zirconium measurement. The total evaporation method was used for the concentration determination by isotope dilution and to certify the 91Zr spike solution. For the isotope composition determination of the nuclear samples, a modified classical method was employed: the zirconium procedure.
2.4.1. Total evaporation method
The TIMS total evaporation method was developed in order to overcome the mass fractionation by collecting all the ionized isotopes of the whole sample [31].
The method employed in this study was previously described and was transposed to zirconium [21]. “Peak center” (mass calibration and ion beam centering in the detector) and lenses optimization were realized using the major zirconium isotope: 90Zr+ for the SPEX solutions isotope determinations and the nuclear samples concentration determinations or 91Zr+ for the enriched 91Zr spike solutions isotope and concentration determinations. The zirconium isotope 90Zr+ or 91Zr+ target intensity was adapted depending on the analysis. It was typically of 7.5 V on 91Zr+ for 91Zr spike solution isotope composition and concentration determination, 4 V on 90Zr+ for the SPEX solution isotope composition determination, 3.5 V for samples 2 and 3 concentration determination and 1 V for sample 1 concentration determination. Data acquisition was ended when the evaporation filament current reached a maximum value of 6.5 A and the ion beam intensity decreased down to a 10 mV signal.
The total evaporation method was employed to measure the molybdenum non-interfered isotope ratios 91Zr/90Zr and 93Zr/90Zr for the concentration determination by isotope dilution. It was also employed for the isotope abundance determination of the SPEX solution and for the certification of the 91Zr spike solution in which the molybdenum contamination isotope abundance was natural. In this case a molybdenum interference correction was necessary. The molybdenum isotope composition employed was the one proposed by Wieser et De Laeter [32].
2.4.2. Modification of the classical method: the zirconium procedure
In the classical method, the different isotopes are collected in a limited period of the sample evaporation. The isotope ratios are then corrected for mass fractionation, the main cause of measurement bias [31,33], by using an internal or external normalization. Mass fractionation was corrected using the mass fractionation factor determined for the non-interfered isotope ratio 91Zr/90Zr with a SPEX solution analyzed in the same conditions. The reference values considered were the one published by Nomura et al. (Table 1) [18].
The classical method employed in the laboratory showed a bias between 1.9 and 25 % for the three interfered isotope ratio 92Zr/90Zr, 94Zr/90Zr and 96Zr/90Zr. Zirconium is mostly interfered by molybdenum impurities present in the separated solution and in the filament. The interference correction equation, generally used in previous studies [1,8,12,18], was not relevant for the nuclear samples isotope analysis due to the presence of unknown molybdenum isotope composition. To minimize the effect of molybdenum impurities, a methodology was developed (hereafter referred to as the zirconium procedure). The major modifications were improving the outgassing of the filaments and adding a delay before the measurement. 5 µg of the Zr analyte was deposited onto a filament outgassed for 4 h at 4.5 A (before reaching 4.5 A, the current increased at 2.0A/min) in a high vacuum chamber (< 5×10⁻⁶ mbar). Then the filament with the deposit was inserted in the TIMS turret. After reaching a high vacuum in the TIMS source, the ionization filament and the evaporation filament were heated to a filament current of 5 A and 1.2 A, respectively, in 10 min. These filament currents were then maintained for 4 hours. During this phase, the zirconium was not evaporated and the molybdenum impurity eventually present in the sample was eliminated [8]. Then, the ionization filament current was adjusted to 5.5 A. Next, the evaporation filament was heated up to obtain the major zirconium isotope (90Zr+ or 91Zr+) ion beam of 10 mV. “Peak center” and an optimization of the lens were realized. The ionization filament temperature was adjusted in order to obtain a cumulated signal on all the zirconium isotopes of 1 V. Electronic baselines were then measured prior to data acquisition. The evaporation filament was controlled to keep the ion beam intensity constant, by increasing the evaporation current when necessary. Each measurement corresponded to 7 blocks of 15 cycles. Each cycle
included 5 integrations with an integration time of 1 s for each isotope. An idle time was fixed at 1 s. A “peak center” was realized after each block.
Isotope dilution 2.5.
The zirconium concentration was determined by isotope dilution. The equation for the concentration determination of a sample with a major isotope referred as Y is:
(1)
Where T refers to the tracer used with a major isotope X, Mix refers to the sample-tracer mixture and S refers to the sample; m are the masses involved in the mixture, M are the atomic weights, (X) and (Y) are the isotope abundances of each major isotope, X/Y and Y/X are the isotope ratios.
Results evaluation and uncertainties estimation 2.6.
Bias, or measurement trueness, was calculated with the following formula:
100
(%)
=
−
×
ref
ref
Z
Bias
(2)Where Z is the experimental value and ref is the reference value given by Nomura et al. [18].
The precision of the different method and analysis was evaluated by computing the Relative Standard Deviation (RSD).
Due to the small volumes of nuclear samples available for analysis, only one or two independent separations were realized. The precision evaluation given by the RSD was not representative in this case. The results were compared using the relative difference (% diff) between the two values expressed in percentage:
%
| !|" #"! !
100
(3)Where V1 and V2 were the results obtained for the two separations.
The uncertainty estimations of the isotope ratios and isotope abundances were calculated taking into account different uncertainty components: the uncertainty of the natural zirconium isotope reference values of Nomura et al. [18] used for the isotope fractionation correction and the method bias calculation, the repeatability uncertainty, the method bias and the molybdenum isotope abundance uncertainty when the molybdenum interference correction equation was used [32]. The uncertainty due to the bias, which could not be assessed for the nuclear samples and the 91Zr spike solution, was estimated in regard of the bias observed for the experiments involving natural zirconium. All the uncertainty estimations were expressed at k = 2.
The uncertainties in the concentration of zirconium was estimated by combining the uncertainties from each term in equation (1) [34].
3. Results and discussion
Zirconium isotope abundance determination methodology: validation on natural isotopic 3.1.
composition samples (SPEX solutions).
In order to validate the methodology, the following experiments were performed: natural zirconium isotope determination using the total evaporation method and the zirconium procedure. The zirconium procedure was then tested after separation on Mo/Zr simulated solution. The results are summarized in the Table 1 and in the Table S1 in the supplementary materials.
3.1.1. The total evaporation method
In order to confirm the natural zirconium reference value and the total evaporation method using the molybdenum interference correction equation, 8 isotope compositions were determined in three different sessions over three months. The values obtained are in good agreement with the reference value of Nomura et al. [18] (Table 1 and Table S1 in the supplementary materials). The biases obtained were lower than 0.1 % for the four major isotopes: 90Zr (0.06 %), 91Zr (0.07 %), 92Zr (0.01 %) and 94Zr (0.07 %). A higher, but still acceptable bias (0.38%) was observed for the minor isotope 96Zr.
3.1.2. The zirconium procedure
Seven measurements with the zirconium procedure were realized in three different sessions over one month (Table 1 and supplementary materials Table S1). The RSD and the bias showed results similar to the one obtained by the total evaporation method. The estimation of the relative uncertainty (k = 2) for the four major isotope abundance (90Zr, 91Zr, 92Zr and 94Zr) was between 0.21 % and 0.52 %. The bias and the repeatability represented the major component in the final uncertainty. A degradation of the relative uncertainty estimation was observed for the 96Zr isotope (1.52 %, k=2). The degradation of the bias and the repeatability explained this increase. It is important to note that, compared to the total evaporation method, the zirconium procedure allowed a significant decrease of the molybdenum interference. During the measurement phase, the 95Mo signal was lower than 1 mV for all the measurements of this study.
The values obtained using the zirconium procedure are in good agreement with the reference value and the uncertainties are acceptable in comparison to the reference zirconium isotope determination method, which is the total evaporation method using the molybdenum interference correction equation (Table 1 and Table S1 in the supplementary materials).
3.1.3. SPEX zirconium isotope composition after the separation procedure
Three solutions were prepared to simulate the zirconium and the molybdenum present in the nuclear samples. The final matrix was 5 mL of 4 M HNO3. The zirconium and molybdenum concentrations (respectively
100 mg.L-1 and 350 mg.L-1respectively) were chosen to be the most unfavorable case that we observed in the analyzed nuclear samples: the Mo/Zr concentration ratio was equal to 3.5.
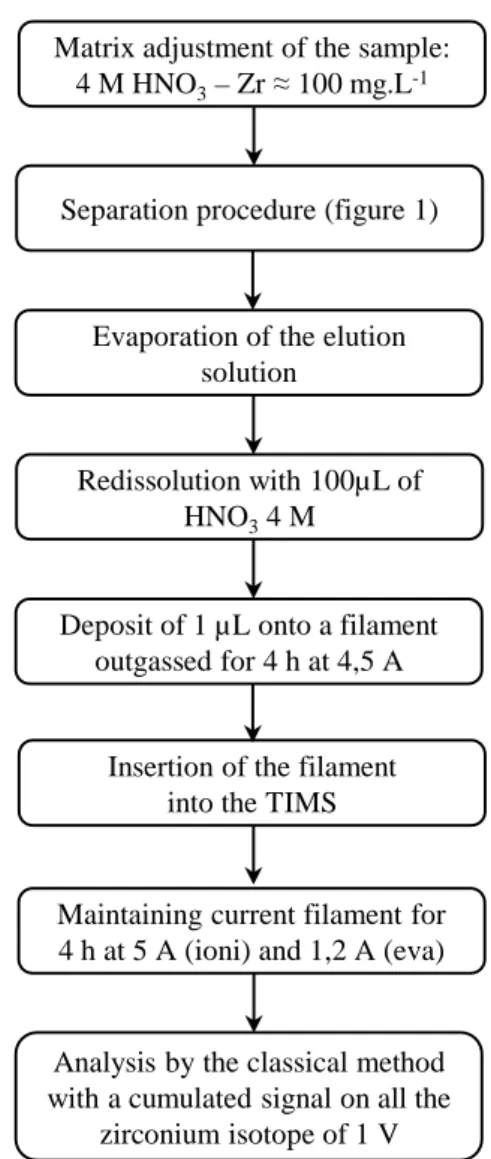
Three independent separations were realized using the procedure described in section 2.2. After separation, evaporation and redissolution, 1 µL of the solution (around 5 µg of Zr) was deposited onto an outgassed filament and analyzed with the zirconium procedure. The methodology is summarized in the Figure 2.
The RSD, the bias and the uncertainty estimations showed results very close to the one obtained by the direct analysis of the SPEX solution with the zirconium procedure (Table 1 and Table S1 in the supplementary materials). The results obtained on the simulated non-radioactive solutions validated the methodology used to determine the zirconium isotope composition in the nuclear samples.
Spike solution calibration 3.2.
After the dissolution of the ZrO2 powder enriched in 91Zr isotope (section 2.1.2), the 91Zr spike solution was
diluted. The zirconium isotope composition of this solution was carefully measured and its concentration was determined by reverse isotope dilution using a SPEX standard solution.
3.2.1. Isotope composition of 91Zr spike solution
The 91Zr spike isotope abundance was certified by the total evaporation method using the molybdenum interference correction equation. The results are summarized in the Table 2 and Table S2 in the supplementary materials. 12 independent measurements were made over the course of a month in groups of three measurements at a time. The values obtained are in good agreement with the certified values. The repeatability and the uncertainty estimation were close to the one obtained for the natural SPEX solution analysis.
3.2.2. Concentration of the 91Zr spike solution
From a SPEX solution at 987.1 ± 4.9 µg.g-1, a diluted solution was prepared in 4 M HNO3. The concentration of
this solution was 9.022 ± 0.046 µg.g-1. The values obtained by Nomura et al. [18] were considered for the isotope composition of this SPEX solution (Table 1).
Six mixtures of the 91Zr spike solution and the diluted SPEX solution were prepared with a high precision balance and the respective 91Zr/90Zr ratios were determined by TIMS with the total evaporation method. The spike concentration was analyzed during two different sessions. The relative standard deviation of these six mixtures was better than 0.20 % (Table 2). The results obtained for the 91Zr spike solution concentration was 9.189 ± 0.055 µg.g-1 (k=2).
Zirconium isotope abundance and concentration determination in three nuclear samples 3.3.
3.3.1. Zirconium isotope abundance
The protocol summarized in the Figure 2 was employed to determine the zirconium isotope composition in the three nuclear samples. The Table 3 summarizes the results obtained for the three nuclear samples.
Due to a lack of volume for the sample 1, only one separation was performed. The zirconium in the sample was separated using the separation procedure (see section 2.2). Two isotope determinations of the single separation solution were performed by the zirconium procedure (Table 3). During all the measurement the intensity at mass 95 was very small (< 0.1 mV) indicating that both the chemical separation and the zirconium procedure allowed to minimize the presence of molybdenum. The difference between the two determinations was better than 0.14 %. The relative uncertainties estimations obtained for the isotope abundance were between 0.24 % and 0.36 % and were similar to the ones obtained for a SPEX solution.
Two independent separations were realized on the sample 2 leading to two independent isotope determinations with the zirconium procedure. The good separation efficiency was verified by measuring the intensity at mass 95 (< 0.6 mV). The isotope abundances obtained with the two independent separations were close to one another: the difference was lower than 0.25 % for all the isotopes except for the 93Zr isotope (1.44 %). The relative uncertainty estimations obtained for the isotope abundance were lower than 0.70 % for the 90Zr, 91Zr, 92Zr and
94Zr and was equal to 1.36 % for the 96Zr. These uncertainties estimations were close to the ones obtained with a
SPEX solution for which the isotope abundance is similar. The relative uncertainty estimation of the 93Zr isotope abundance was higher (3.18 %) due to a larger difference between the two independent separations as a result of the weak abundance of this isotope.
As for sample 2, two independent separations led to two independent isotope determinations with the zirconium procedure for the sample 3. The 95Mo intensity remained weak (≈ 1 mV) confirming the separation efficiency. The isotope abundance obtained with the two independent separations were similar: the difference was lower than 0.30 % for the isotopes from 90 to 94 and was slightly higher for the isotope 96 (0.57 %). The isotope abundance uncertainties were similar to those obtained for the SPEX solution.
3.3.2. Zirconium concentration determination by isotope dilution
The tracer used for the concentration determination of the sample 1 was the diluted SPEX solution at 9.022 ± 0.046 µg.g-1 previously prepared (section 3.2.2). First, the sample was diluted using a high precision balance in order to obtain a zirconium concentration close to 40 µg.g-1. Then, two mixtures of the diluted sample 1 and the SPEX solution were prepared. The mixture was prepared in order to obtain a isotope ratios (91
Zr/
90Zr
and
93Zr/
90Zr)
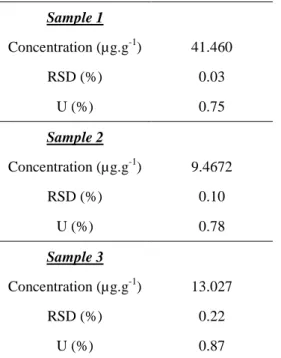
close to 1. First attempts showed the presence of interferences in small quantity at mass 90, probably due to the presence of yttrium traces. Therefore, after two mixture preparations, the separation procedure was realized (section 2.2). Then, the 91Zr/90Zr and 93Zr/90Zr ratios were determined by TIMS with the total evaporation method and were both considered in order to obtain the final concentration (Table 4). The individual results obtained with the 91Zr/90Zr and 93Zr/90Zr ratios are presented in Table S3 in the supplementary materials.The RSD obtained for the four results (two for each isotope ratio) were equal to 0.03 %. The value found for sample 1 was 41.460 ± 0.311 µg.g-1 (k=2). Uncertainty in the zirconium concentration was estimated to be 0.75 % (relative uncertainty with a coverage factor of k=2). The major source of uncertainty was the uncertainty of the SPEX diluted solution concentration. The individual values, and the final uncertainty estimation obtained using both isotope ratios (91
Zr/
90Zr and
93Zr/
90Zr)
were very close to one another: the difference on the individual concentration value was equal to 0.08 % (Table S3 in the supplementary materials).Due to the fact that the isotope composition of samples 2 and 3 were close to natural zirconium, the tracer used in these cases was the 91Zr spike solution (see section 3.2). First, the samples were diluted in order to obtain a zirconium concentration near to 10 µg.g-1. Then, three mixtures of the sample and the 91Zr spike solution were prepared. The mixture was prepared in order to reach an isotope ratio close to 1. The 91Zr/90Zr ratio of the mixture was determined by TIMS with the total evaporation method. The results are presented in Table 4. For sample 2, the RSD obtained for the three mixtures measurements was 0.10 %. The value found for sample 2 was 9.4672 ± 0.074 µg.g-1 (k=2). For sample 3, the RSD obtained for the three mixtures measurements was 0.22 %. A zirconium concentration of 13.027 ± 0.114 µg.g-1 (k=2) was found.
The relative uncertainty estimations obtained for the Zr concentration in nuclear samples 2 and 3 were equal to 0.78 % and 0.87 %; respectively. The uncertainty of the 91Zr spike solution determined in the laboratory accounted for 65 % of the total uncertainty.
4. Conclusion
This study presents an alternative TIMS analytical method to perform high accuracy zirconium isotope abundance measurements on nuclear samples. Due to the presence of non-natural molybdenum in such samples, a new methodology without the molybdenum interference correction equation was employed. A chemical separation step combined with the developed methodology (zirconium procedure) reduces considerably the molybdenum present during the TIMS analysis. The results obtained on simulated solutions are in good agreement with the reference values published in the literature. Hence, the validated methodology was applied to three nuclear samples. The nuclear zirconium isotope abundance was then determined with low uncertainty. In order to determine the zirconium concentration with high accuracy, a 91Zr spike solution was prepared and calibrated by reverse isotope dilution using a SPEX standard Zr solution. The zirconium concentration was then determined in the three nuclear samples by isotope dilution using the SPEX standard Zr solution or the 91Zr spike solution. The TIMS method combined with the isotope dilution offers the possibility to determine zirconium concentration in nuclear samples with an uncertainty estimation (k=2) better than 1 %.
Acknowledgements: We are grateful to E. Esbelin, (CEA/MAR/DEN/DRCP/SERA/LAMM) and S. Baghdadi (IRSN/PRP-Hom/SDI/LRC) for their precious technical help and advice on the present paper and to N. Vaissières and J.L. Dautheribes (CEA/MAR/DEN/DRCP/SERA/LAMM) for the ICP-OES analysis.
Bibliography
[1] M.B. Greiter, V. Höllriegl and U. Oeh, Method development for thermal ionization mass spectrometry in the frame of a biokinetic tracer study with enriched stable isotopes of zirconium, Int. J. Mass Spectrom. 304 (2011) 1–8.
[2] K. David, J.L. Birck, P. Telouk and C.J. Allègre, Application of isotope dilution for precise measurement of Zr/Hf and 176Hf/177Hf ratios by mass spectrometry (ID-TIMS/ID-MC-ICP-MS), Chem. Geol. 157 (1999) 1–12.
[3] T. Hirata, Determinations of Zr isotopic composition and U–Pb ages for terrestrial and extraterrestrial Zr-bearing minerals using laser ablation-inductively coupled plasma mass spectrometry: implications for Nb–Zr isotopic systematics, Chem. Geol. 176 (2001) 323–342.
[4] M. Schönbächler, M. Rehkämper, D. Lee and A.N. Halliday, Ion exchange chromatography and high precision isotopic measurements of zirconium by MC-ICP-MS, Analyst. 129 (2004) 32–37.
[5] M. Shima, The isotopic composition and the atomic weight of zirconium, Int. J. Mass Spectrom. Ion Phys. 28 (1978) 129–140.
[6] J.-F. Minster and L.P. Ricard, The isotopic contosition of zirconium, Int. J. Mass Spectrom. Ion Phys. 37 (1981) 259–272.
[7] S.M. Boswell and H. Elderfield, The determination of zirconium and hafnium in natural waters by isotope dilution mass spectrometry, Mar. Chem. 25 (1988) 197–209.
[8] J.L. Steeb, D.G. Graczyk, Y. Tsai, C.J. Mertz, A.M. Essling, V.S. Sullivan, K.P. Carney, M.R. Finck, J.J. Giglio and D.B. Chamberlain, Application of mass spectrometric isotope dilution methodology for 90Sr age-dating with measurements by thermal-ionization and inductively coupled-plasma mass spectrometry, J. Anal. At. Spectrom. 28 (2013) 1493–1507.
[9] P. Cassette, F. Chartier, H. Isnard, C. Fréchou, I. Laszak, J.P. Degros, M.M. Bé, M.C. Lépy and I. Tartes, Determination of (93)Zr decay scheme and half-life., Appl. Radiat. Isot. 68 (2010) 122–130.
[10] F. Chartier, H. Isnard, J.P. Degros, A.L. Faure and C. Fréchou, Application of the isotope dilution technique for 93Zr determination in an irradiated cladding material by multiple collector-inductively coupled plasma mass spectrometry, Int. J. Mass Spectrom. 270 (2008) 127–133.
[11] T.C. Oliveira, R.P.G. Monteiro, G.F. Kastner, F. Bessueille-Barbier and a. H. Oliveira, Radiochemical methodologies applied to determination of zirconium isotopes in low-level waste samples from nuclear power plants, J. Radioanal. Nucl. Chem. 302 (2014) 41–47.
[12] M. Betti, G. Rasmussen and L. Koch, Isotopic abundance measurements on solid nuclear-type samples by glow discharge mass spectrometry., Anal. Bioanal. Chem. 355 (1996) 808–12.
[13] C. Gautier, M. Coppo, C. Caussignac, I. Laszak, P. Fichet and F. Goutelard, Zr and U determination at trace level in simulated deep groundwater by Q ICP-MS using extraction chromatography., Talanta. 106 (2013) 1–7.
[14] R. Nielsen and T.W. Chang, Zirconium and Zirconium Compounds, Ullmann’s Encycl. Ind. Chem. (2000) 1–27.
[15] J. Lamontagne, C. Eysseric, L. Desgranges, C. Valot, J. Noirot, T. Blay, I. Roure and B. Pasquet, Study of structural material resulting from the nuclear fuel cycle using SEM-WDX, EPMA and SIMS techniques, Microchim. Acta. 161 (2007) 355–362.
[16] A. Magnaldo, M. Masson and R. Champion, Nucleation and crystal growth of zirconium molybdate hydrate in nitric acid, Chem. Eng. Sci. 62 (2007) 766–774.
[17] T. Adachi, M. Ohnuki, N. Yoshida, T. Sonobe, W. Kawamura, H. Takeishi, K. Gunji, T. Kimura, T. Suzuki, Y. Nakahara, T. Muromura, Y. Kobayashi, H. Okashita and T. Yamamoto, Dissolution study of spent PWR fuel: Dissolution behavior and chemical properties of insoluble residues, J. Nucl. Mater. 174 (1990) 60–71.
[18] M. Nomura, K. Kogure and M. Okamoto, Isotopic abundance ratios and atomic weight of zirconium, Int. J. Mass Spectrom. Ion Phys. 50 (1983) 219–227.
[19] K.L. Ramakumar, M.K. Saxena, V.A. Raman, V.L. Sant, V.D. Kavimandan, B.P. Datta and H.C. Jain, Determination of zirconium in U−Zr−Al and Pu−Zr−Al alloys by isotope dilution thermal ionization mass spectrometry, J. Radioanal. Nucl. Chem. 158 (1992) 13–21.
[20] S.K. Sahoo and A. Masuda, Precise measurement of zirconium isotopes by thermal ionization mass spectrometry, Chem. Geol. 141 (1997) 117–126.
[21] A. Quemet, M. Maloubier, V. Dalier and A. Ruas, Development of an analysis method of minor uranium isotope ratio measurements using electron multipliers in thermal ionization mass spectrometry, Int. J. Mass Spectrom. 374 (2014) 26–32.
[22] S. Wakaki, S.-N. Shibata and T. Tanaka, Isotope ratio measurements of trace Nd by the total evaporation normalization (TEN) method in thermal ionization mass spectrometry, Int. J. Mass Spectrom. 264 (2007) 157–163.
[23] S. Richter, H. Kühn, Y. Aregbe, M. Hedberg, J. Horta-Domenech, K. Mayer, E. Zuleger, S. Bürger, S. Boulyga, A. Köpf, J. Poths and K. Mathew, Improvements in routine uranium isotope ratio measurements using the modified total evaporation method for multi-collector thermal ionization mass spectrometry, J. Anal. At. Spectrom. 26 (2011) 550–564.
[24] A.M. Al-Ani and F.M. Masoud, A comparison of the extraction capacity of trioctylamine and its radiolytic products dioctylamine and primary octylamine for the elements U(VI), Mo(VI), Zr(IV) and Sr(II), Hydrometallurgy. 9 (1982) 211–214.
[25] J.A. Ayres, Purification of Zirconium by Ion Exchange Columns, J. Am. Chem. Soc. 69 (1947) 2879– 2881.
[26] B.P. Behera, M.S. Mishra, M.I. Mohanty and V. Chakravortty, Liquid-liquid Extraction of Mo(VI) and U(VI) by Alamine 310 and Its Binary Mixtures with TBP, DPSO, and Cyanex 301 from H2SO4 Acid Medium, Radiochim. Acta. 65 (1994) 233–238.
[27] S. Dulanská, B. Remenec, V. Gardoňová and Ľ. Mátel, Determination of 93Zr in radioactive waste using ion exchange techniques, J. Radioanal. Nucl. Chem. 293 (2012) 635–640.
[28] F.L. Fan, F. a. Lei, L.N. Zhang, J. Bai, M.S. Lin, X.F. Li, H.J. Ding, X.L. Wu, D. Nayak and Z. Qin, Extraction Behavior of Mo(VI) and W(VI) as Homologs of Sg with α ‐Benzoinoxime, Solvent Extr. Ion Exch. 27 (2009) 395–407.
[29] A. Kumar, P.K. Mohapatra, P.N. Pathak and V.K. Manchanda, Extraction of mo(VI) from nitric acid medium by di(octyl-phenyl) phosphoric acid, Solvent Extr. Ion Exch. 19 (2007) 491–505.
[30] A. Zhang, Y. Wei, H. Hoshi and M. Kumagai, Adsorption and Chromatographic Separation of Mo(VI) and Zr(IV) Ions from a High-concentration Oxalic Acid Solution by a Macroporous Silica-based N,N,N’,N'-Tetraoctyl-3-Oxapentane-1,5-Diamide Polymeric Adsorbent, Adsorpt. Sci. Technol. 22 (2004) 497–509.
[31] J.C. Dubois, G. Retali and J. Cesario, Isotopic analysis of rare earth elements by total vaporization of samples in thermal ionization mass spectrometry, Int. J. Mass Spectrom. Ion Process. 120 (1992) 163– 177.
[32] M.E. Wieser and J.R. De Laeter, Absolute isotopic composition of molybdenum and the solar abundances of the p-process nuclides 92,94Mo, Phys. Rev. c. 75 (2007).
[33] R. Fiedler, Total evaporation measurements: experience with multi-collector instruments and a thermal ionization quadrupole mass spectrometer, Int. J. Mass Spectrom. Ion Process. 146 (1995) 91–97.
[34] S. Bürger, R.M. Essex, K.J. Mathew, S. Richter and R.B. Thomas, Implementation of Guide to the expression of Uncertainty in Measurement (GUM) to multi-collector TIMS uranium isotope ratio metrology, Int. J. Mass Spectrom. 294 (2010) 65–76.
Table Isotope ratio Reference 91Zr/90Zr 92Zr/90Zr 94Zr/90Zr 96Zr/90Zr Nomura et al. [18] 0.21814(22) 0.33324(13) 0.33779(21) 0.05440(9) This study – TE 0.21785(45) 0.33304(79) 0.33734(157) 0.05416(50) This study – ZP 0.21818(38) 0.33440(155) 0.33976(266) 0.05514(98) This study – Sep 0.21787(48) 0.33361(64) 0.33794(98) 0.05486(63)
Isotope abundance
Reference 90Zr 91Zr 92Zr 94Zr 96Zr
Nomura et al. [18] 51.452(9) 11.223(12) 17.146(7) 17.380(12) 2.799(5) This study – TE 51.483(75) 11.215(17) 17.146(25) 17.367(60) 2.788(22) This study – ZP 51.348(146) 11.203(29) 17.171(37) 17.446(91) 2.831(43) This study – Sep 51.433(66) 11.206(27) 17.158(25) 17.381(41) 2.822(31) Table 1: Comparison of the isotope ratio and isotope abundances using total evaporation method (TE) with those from zirconium protocol (ZP), and the zirconium protocol after separation of an initial solution containing Mo at 3.5 Mo/Zr ratio (Sep). Expanded uncertainties at the 95 % level of confidence are stated (k = 2). The isotope abundances are stated as atom percent.
Isotope abundance Reference 90 91 92 94 96 Analysis certificate 2.26 95.30 1.86 0.52 0.06 This study - TE 2.266(12) 95.335(81) 1.813(10) 0.526(4) 0.060(1) Concentration Mean (µg.g-1) 9.189 RSD (%) 0.18 U (%) 0.59
Table 2: Comparison of the isotopic composition measured by TE and concentration with certified values. Relative uncertainties at the 95 % level of confidence with a coverage factor of k =2 are indicated. The isotope abundances are stated as atom percent.
90 Zr 91Zr 92Zr 93Zr 94Zr 96Zr Sample 1 Mean 4.034 16.407 17.723 19.432 20.861 21.543 % diff 0.14 0.09 0.11 0.03 0.04 0.11 U (%) 0.35 0.29 0.26 0.28 0.24 0.36 Sample 2 Mean 50.657 11.218 17.249 0.318 17.459 3.099 % diff 0.11 0.02 0.02 1.44 0.25 0.06 U (%) 0.34 0.26 0.20 3.18 0.68 1.36 Sample 3 Mean 48.621 11.397 17.324 1.082 17.639 3.937 % diff 0.12 0.09 0.10 0.30 0.18 0.57 U (%) 0.34 0.32 0.28 1.49 0.58 1.77
Table 3: Zirconium isotope abundance, relative difference between the two determinations (% diff) and relative uncertainty estimation, U (%), at k = 2 for the three nuclear samples. For sample 1, two deposits of the same separation solution have been analyzed. For sample 2 and 3, two independent separation solutions have been analyzed. The isotope abundances are stated as atom percent.
Sample 1 Concentration (µg.g-1) 41.460 RSD (%) 0.03 U (%) 0.75 Sample 2 Concentration (µg.g-1) 9.4672 RSD (%) 0.10 U (%) 0.78 Sample 3 Concentration (µg.g-1) 13.027 RSD (%) 0.22 U (%) 0.87
Table 4: Zirconium concentration in µg.g-1 for the three diluted nuclear samples. The uncertainty estimations (U) are expressed at k = 2.
Figure
Figure 1:Diagram of the separation procedure for Zr purification Zr, Mo, Y, Nb, Ru, [HNO3] = 4 M
UTEVA Pre-packed 2 mL column [HNO3] = 4 M [HNO3] = 4 M + [H2C2O4] = 0.1 M Al(NO3)3 Mo, Y, Nb, Ru Zr (1) (2) (3) (1) + (2) (3)
Figure 2: Procedure for the zirconium isotope measurement after a separation applied to nuclear samples Matrix adjustment of the sample:
4 M HNO3– Zr ≈ 100 mg.L-1
Separation procedure (figure 1)
Evaporation of the elution solution
Redissolution with 100µL of HNO34 M
Deposit of 1 µL onto a filament outgassed for 4 h at 4,5 A
Insertion of the filament into the TIMS
Maintaining current filament for 4 h at 5 A (ioni) and 1,2 A (eva)
Analysis by the classical method with a cumulated signal on all the