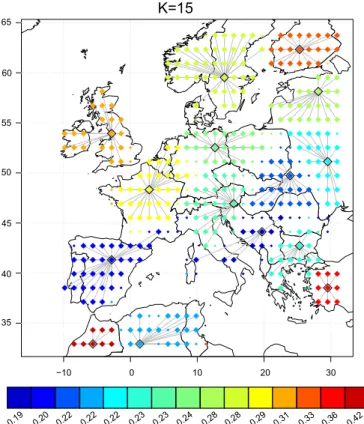
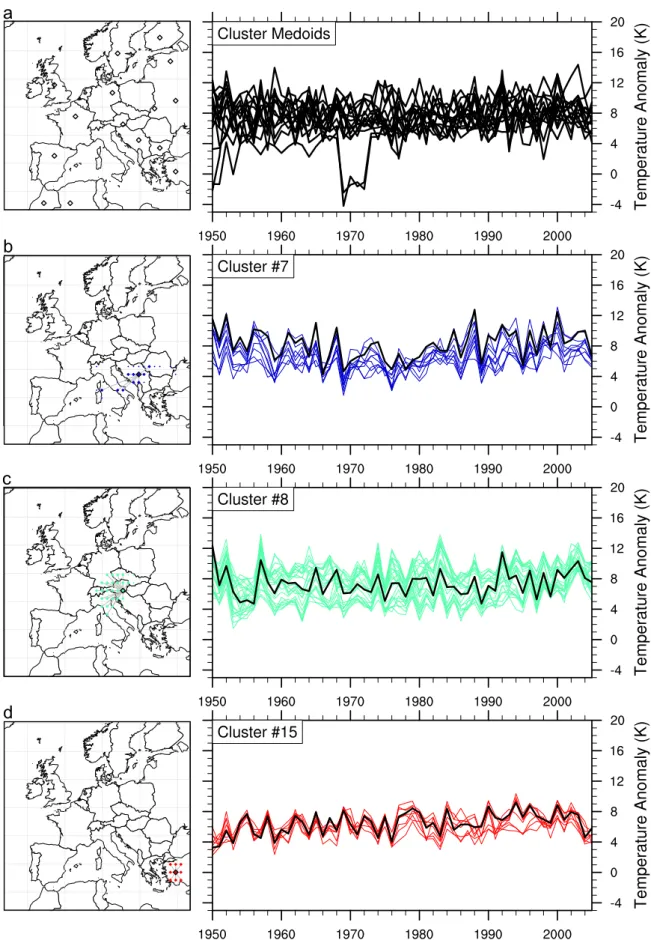
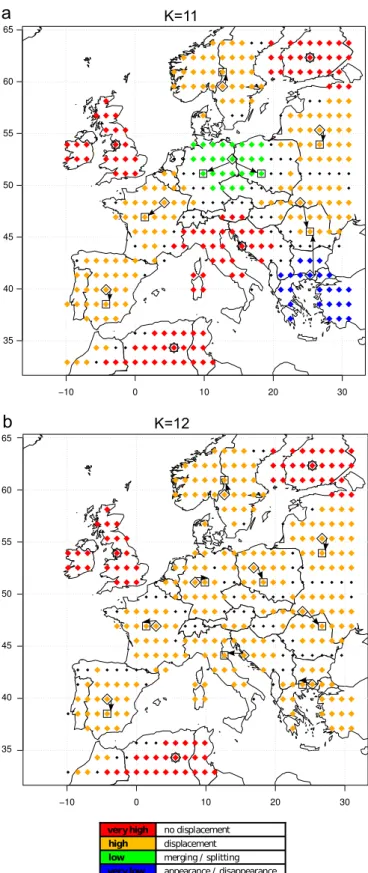
Spatial clustering of summer temperature maxima from the CNRM-CM5 climate model ensembles & E-OBS over Europe
Texte intégral
Figure


Documents relatifs
5.2 Future warming projections using SRES scenarios In this section the global mean surface air temperature increase and the radiative forcings obtained for the SRES scenarios used
For the gaussian random field, the observed value R of the number of rejected hypothesis fully agrees with the bootstrap distri- bution of R ∗ , and the global asymptotic
(b) near-surface global average temperature (in red, left y axis) and global-averaged sea surface temperature (in blue, right y axis); (c) soil wetness index (in red, left y axis)
Figure 16 shows the future projections from 2015 to 2100 of both models in terms of global mean surface temperature, ocean heat content, and global carbon sink are compared to the
5.2 Future warming projections using SRES scenarios In this section the global mean surface air temperature increase and the radiative forcings obtained for the SRES scenarios used
During recovery from extreme events, root growth rate shows a significant increase in elevated CO2 compared to ambient CO2 (consequent to higher above-ground biomass production)
The meteorological ad- justment of the daily ozone maxima and the calculations of the trends of adjusted daily ozone maxima during the 1992– 2002 period were performed for each