HAL Id: hal-01191731
https://hal.sorbonne-universite.fr/hal-01191731
Submitted on 2 Sep 2015HAL is a multi-disciplinary open access archive for the deposit and dissemination of sci-entific research documents, whether they are pub-lished or not. The documents may come from teaching and research institutions in France or abroad, or from public or private research centers.
L’archive ouverte pluridisciplinaire HAL, est destinée au dépôt et à la diffusion de documents scientifiques de niveau recherche, publiés ou non, émanant des établissements d’enseignement et de recherche français ou étrangers, des laboratoires publics ou privés.
Ramon Massana, Angélique Gobet, Stéphane Audic, David Bass, Lucie
Bittner, Christophe Boutte, Aurélie Chambouvet, Richard Christen,
Jean-Michel Claverie, Johan Decelle, et al.
To cite this version:
Ramon Massana, Angélique Gobet, Stéphane Audic, David Bass, Lucie Bittner, et al.. Marine pro-tist diversity in European coastal waters and sediments as revealed by high-throughput sequencing. Environmental Microbiology, Society for Applied Microbiology and Wiley-Blackwell, 2015, 17 (10), pp.4035-4049. �10.1111/1462-2920.12955�. �hal-01191731�
For Peer Review Only
A Research Article resubmitted to Environmental Microbiology ID EMI-2015-0139
Marine protist diversity in European coastal waters and sediments as
revealed by high-throughput sequencing
5
Ramon Massana1*, Angélique Gobet2,3, Stéphane Audic2,3, David Bass4, Lucie Bittner2,3,5, Christophe Boutte2,3, Aurélie Chambouvet6, Richard Christen7, Jean-Michel Claverie8, Johan Decelle2,3, John R. Dolan9, Micah Dunthorn5, Bente Edvardsen10, Irene Forn1, Dominik Forster5, Laure Guillou2,3, Olivier Jaillon11, Wiebe H.C.F.
Kooistra12, Ramiro Logares1, Frédéric Mahé5, Fabrice Not2,3, Hiroyuki Ogata13, Jan Pawlowski14, Massimo C. 10
Pernice1, Ian Probert2,3, Sarah Romac2,3, Thomas Richards6, Sébastien Santini8, Kamran Shalchian-Tabrizi10, Raffaele Siano15, Nathalie Simon2,3, Thorsten Stoeck5, Daniel Vaulot2,3, Adriana Zingone12, and Colomban de
Vargas2,3
1
Institut de Ciències del Mar (CSIC), Passeig Marítim de la Barceloneta, 37-49, ES-08003, Barcelona, Catalonia, Spain
15
2
CNRS, UMR 7144, Station Biologique de Roscoff, FR-29682 Roscoff, France
3
UPMC Université Paris 06, UMR 7144, Station Biologique de Roscoff, France
4
The Natural History Museum, London SW7 5BD & Cefas, Weymouth, Dorset DT4 8UB, United Kingdom
5
University of Kaiserslautern, D-67663 Kaiserslautern, Germany
6
University of Exeter, Biosciences, Exeter, EX4 4QD, United Kingdom
20
7
CNRS, UMR 7138, Université Nice Sophia Antipolis, FR-06108 Nice, France
8
CNRS, UMR 7256, Aix-Marseille Université, FR-13288 Marseille, France
9
CNRS UMR 7093, UPMC Université Paris 06, Laboratoire d'Océanographie de Villefranche, FR-06230 Villefranche-sur-Mer, France
10
University of Oslo, Department Biosciences, N-0316 Oslo, Norway
11
CEA, Genoscope, 2 rue Gaston Crémieux, FR-91000 Evry, France
25
12
Stazione Zoologica Anton Dohrn, Villa Comunale, I-80121 Naples, Italy
13
Institute for Chemical Research, Kyoto University, Uji, Kyoto 611-0011, Japan
14
University of Geneva, CH-1211 Geneva, Switzerland
15
Ifremer DYNECO/Pelagos, BP 7029280 Plouzané, France
* Corresponding author: Ramon Massana. Department of Marine Biology and Oceanography, Institut de 30
Ciències del Mar (CSIC), Passeig Marítim de la Barceloneta 37-49, ES-08003 Barcelona, Catalonia, Spain. E-mail: ramonm@icm.csic.es. Phone: 34-93-2309500. Fax: 34-93-2309555.
Running title: Protist diversity in European coastal areas 35
For Peer Review Only
Summary
Although protists are critical components of marine ecosystems they are still poorly characterized. Here we analyzed the taxonomic diversity of planktonic and benthic protist communities collected in six distant European coastal sites. Environmental DNA and RNA from three size-fractions (pico-, nano-, and micro/meso-plankton) as well as from dissolved 40
DNA and surface sediments were used as templates for tag pyrosequencing of the V4 region of the 18S rDNA. β-diversity analyses split the protist community structure into three main clusters: picoplankton-nanoplankton-dissolved DNA, micro/mesoplankton, and sediments. Within each cluster, protist communities from the same site and time clustered together, while communities from the same site but different seasons were unrelated. Both DNA and RNA-45
based surveys provided similar relative abundances for most class-level taxonomic groups. Yet, particular groups were overrepresented in one of the two templates, such as MALV-I and MALV-II that were much more abundant in DNA surveys. Overall, the groups displaying the highest relative contribution were Dinophyceae, Diatomea, Ciliophora and Acantharia. Also well represented were Mamiellophyceae, Cryptomonadales, MALV and MAST in the 50
picoplankton, and Monadofilosa and basal Fungi in sediments. Our extensive and systematic sequencing of geographically separated sites provides the most comprehensive molecular description of coastal marine protist diversity to date.
55
Key words: 18S rDNA / dissolved DNA / environmental DNA and RNA extracts / marine protist diversity / pyrosequencing / taxonomy
For Peer Review Only
Introduction
Protists or unicellular eukaryotes cover a wide spectrum of cell sizes, shapes, and taxonomic affiliations (Schaechter, 2012). They represent the majority of eukaryotic lineages, so 60
studying their diversity is of primary interest for understanding the eukaryotic tree of life (Keeling et al., 2005; Burki, 2014). Moreover, protists play a variety of crucial roles in marine ecosystems from primary producers, predators, decomposers to parasites (Sherr et al., 2007), leading to much effort in quantifying particular species and inferring their ecological functions. A vast literature exists in which species of dinoflagellates (e.g. Graham et al., 65
2004), diatoms (e.g. Olguín et al., 2006) and ciliates (e.g. Dolan et al., 2013) have been studied based on morphological features observable in light microscopy (LM), a task that requires considerable expertise and time to key out species accurately. Even for these relatively visible groups, examples are known of morphologically similar individuals belonging to different cryptic species (Amato et al., 2007) or morphologically distinct types 70
from the same species (Pizay et al., 2009). Accurate identification may thus not always be discerned from cell morphology alone, and this is more critical for protists below 20 µm in size that often lack conspicuous shapes (Massana, 2011). Over the last decades, DNA sequencing of environmental phylogenetic markers has changed our perception of microbial diversity in most ecosystems. These molecular surveys have been instrumental in decoding 75
the large protist diversity and in unveiling new lineages, such as Picozoa (Not et al., 2007; Seenivasan et al., 2013), MALV (Marine Alveolates) clades (Guillou et al., 2008) and MAST (Marine Stramenopiles) clades (Massana et al., 2004; 2014).
Earlier molecular surveys were based on clone libraries of near full-length 18S rDNA genes followed by Sanger sequencing of a subset of the clones (Díez et al., 2001; López-García et 80
For Peer Review Only
checked environmental sequences have been crucial for the phylogenetic placement of novel clades and, together with sequences from monoclonal cultures, are the basis of reference rDNA databases (Guillou et al., 2013; Pernice et al., 2013). However, traditional clone libraries only capture the most dominant species in the community (Pedrós-Alió, 2006), a 85
limitation bypassed by high-throughput sequencing (HTS) methods. By providing the deep inventories needed both for taxonomic descriptions and sample comparisons, HTS has enabled microbial ecology to advance greatly. HTS has been applied to study protist diversity in a wide variety of systems, including surface and deep marine waters (Amaral-Zettler et al., 2009; Cheung et al., 2010; Edgcomb et al., 2011; de Vargas et al., 2015), marine sediments 90
(Bik et al., 2012), lakes (Mangot et al., 2013), soils (Bates et al., 2013), and metazoan hosts (He et al., 2014). In the case of marine protists, most studies have targeted a specific size-fraction or a particular location. In addition, these surveys generally used environmental DNA as template for PCR amplification, and it has been shown that using RNA extracts instead can provide a different picture of biodiversity (Stoeck et al., 2007; Not et al., 2009; Lejzerowicz 95
et al., 2013) and useful complementary information (Blazewicz et al., 2013).
The present study is an investigation of benthic-pelagic protists in marine habitats along the European coastline, sampled between 2009 and 2010 during the research program BioMarKs. The 95 different pyrosequenced samples analyzed herein address total protist diversity from benthic and planktonic (size-fractionated) communities using an eukaryotic "universal" 100
primer set to PCR amplify the V4 rDNA pre-barcode (Pawlowski et al., 2012) from both DNA and RNA extracts. Previous studies using this sequencing dataset focused on particular taxonomic groups, such as uncultured MAST (Logares et al., 2012), cercozoan amoebae (Berney et al., 2013) or diatoms (Nanjappa et al., 2014). More recently, we used a subset of the samples (23 planktonic RNA samples) and newly collected HTS reads (Illumina
105
For Peer Review Only
property, the rare biosphere (Logares et al., 2014). Here we analyze the complete 454 dataset from a taxonomic community perspective to address the following questions: How different are the protist communities found in the pico-, nano-, micro/mesoplankton and sediments? Does the dissolved DNA fraction originate from particular taxonomic groups and/or 110
organismal size-fractions? Do DNA and RNA surveys provide similar protist diversity profiles? Which taxonomic groups are differentially represented in either survey? Which groups dominate in each plankton organismal size fraction and associated sediments? Overall, our study highlights fundamental questions on the diversity of protists, an important but less known component of marine microbial ecosystems (Caron et al., 2009).
115
Results
As a product of the joint effort within the BioMarKs project we sampled six European coastal sites in the water column and sediments (Table 1). The thirteen planktonic communities were size fractionated (pico-, nano-, micro/mesoplankton and dissolved DNA) and, together with 7 120
benthic communities, used to obtain environmental DNA and RNA for pyrosequencing the V4 region of the 18S rDNA. Most assayed templates were successful, and we obtained 26 pyrosequenced samples for picoplankton, 26 for nanoplankton, 21 for micro/mesoplankton, 8 for dissolved DNA and 14 for sediments (Table 1). The pyrotag number for each 454-sample is detailed in Table S1 (~9000 pyrotags per sample on average). Pyrotags from these 95 125
samples clustered in 15,295 OTU97 (Table S2), which were classified into 99 eukaryotic
taxonomic groups (excluding unknown, metazoan and nucleomorphs). The broad coverage of this dataset across ecological and taxonomic scales provided a unique opportunity to study the diversity of both planktonic and benthic marine coastal protists.
For Peer Review Only
Reproducibility of PCR and 454 reactions at the OTU level 130
We explored the reproducibility of sequencing outputs using a subset of nucleic acid extracts (11 DNA and 14 RNA) derived from three cruises (2 from Blanes, 11 from Naples-2009 and 12 from Oslo-2009) and including the four compartments (8 picoplankton, 7 nanoplankton, 5 micro/mesoplankton and 5 sediments). Each duplicated pair (same nucleic acid template and separate PCR and 454 reactions) was selected from the OTU table of 120 samples (Table S2), 135
and linear regressions were performed by plotting OTU abundances in each pair. The pyrotag ratio between duplicates ranged from ~1 to 0.05 and was used to display the statistics of all regressions at once (Fig. 1). The R2 coefficients (Fig. 1A) were always high (0.89 on average) and independent of pyrotag ratios. This indicated that the same abundant OTUs were found at similar relative abundances in duplicates. The regression slopes were explained by pyrotag 140
ratios (R2 of 0.92; slope of 0.84; p<0.001), indicating that OTU abundances increased
proportionally with the number of pyrotags in the sample. Next we explored the pyrotags and OTUs shared between duplicates and calculated the shared percentages of the pair with fewer pyrotags (Fig. 1B). The amount of shared OTUs ranged from 32 to 89% and was higher at low pyrotag ratios, displaying a significant relationship (R2=0.52, p<0.001). Indeed, it was 145
easier to find OTUs from the sample with less pyrotags in its duplicate with higher
sequencing effort. The percentage of pyrotags included in the set of shared OTUs was always high (average of 91%) and its variation was poorly related to pyrotag ratios (p=0.048), indicating that OTUs appearing in only one duplicate contained few pyrotags. Thus, as expected, most differences between duplicates are found among the rare OTUs. 150
Comparisons between communities
ß-diversity patterns of protist assemblages were explored in a dendrogram with 92 samples. Structuring patterns revealed three main groups of samples: (i) picoplankton, nanoplankton
For Peer Review Only
and dissolved DNA, (ii) micro/mesoplankton, and (iii) sediments (Fig. 2). Within the
planktonic size fractions, samples from each sampling event grouped together (large grey dots 155
in Fig. 2), regardless of water depth or nucleic acid template (only Naples-2010 did not form a cluster due to the atypical sample "DCM_picoplankton_DNA"). Planktonic samples from the same site collected at different seasons and years did not cluster together, indicating the significant impact of seasonal community changes. By contrast, sediment samples collected in different periods in Naples or Oslo clustered together, suggesting a more stable community in 160
sediments than in plankton.
Protist community structure derived from DNA or RNA-based exhibited only minor
differences. In total, 24 of the 41 DNA/RNA pairs appeared closest in the dendrogram (small black dots in Fig. 2). Most of the other pairs were still very close, but their coupling was less tight than that between pico- and nanoplankton from the same site, micro/mesoplankton from 165
surface and DCM, or sediment cores from the same site. Only in two cases (the DCM picoplankton in Naples-2010 and Oslo-2010) the DNA and RNA samples were rather different, although still belonging to the same geographic cluster.
The dendrogram showed a close association of dissolved DNA samples with the pico- and nanoplankton from the same water body (Fig. 2). We then analyzed the overlap of individual 170
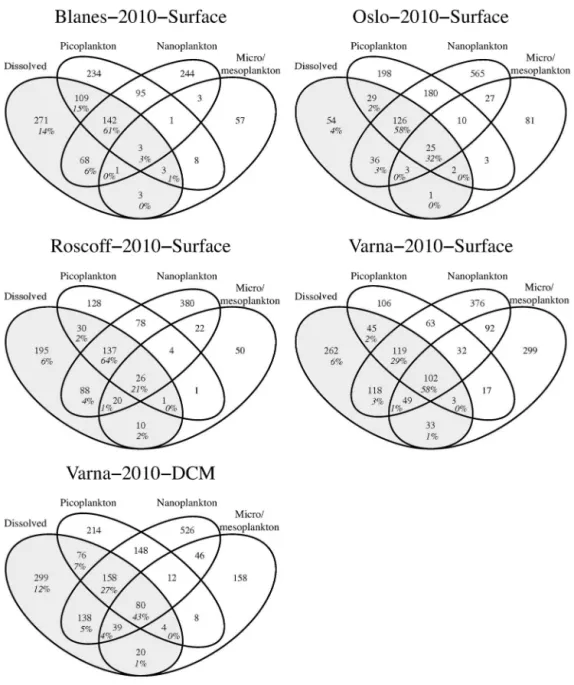
OTUs amongst size fractions in the planktonic samples that had a complete sequence report of the four fractions in the DNA survey (Fig. 3). Many of the OTUs from dissolved samples (59% on average) were shared with the pico- and nanoplankton (alone, combined, or together with the micro/mesoplankton). Still, a substantial number of OTUs (35%) remained unique to dissolved samples, whereas only a few (6%) were shared with the micro/mesoplankton. We 175
then computed the number of pyrotags from dissolved samples within each shared subarea (Fig. 3). OTUs shared with the small size fractions explained 89% of pyrotags while unique
For Peer Review Only
OTUs accounted for 8% of pyrotags. Thus, the dissolved DNA composition largely derived from the pico- and nanoplankton fractions.
Taxonomic representations derived from DNA and RNA surveys 180
Relative abundances of taxonomic groups seen in DNA and RNA-based surveys were analyzed separately for picoplankton (13 DNA/RNA pairs), nanoplankton (13 pairs), micro/mesoplankton (10 pairs), and sediment (7 pairs) samples (Fig. 4). Within the picoplankton we focused in the 26 taxonomic groups more abundant (96.4% pyrotags on average; range of 92.1% to 99.2% in the 26 samples). Most were equally represented in DNA 185
and RNA surveys, as shown by their placement near the 1:1 line (Fig. 4A). Two groups, MALV-I and MALV-II, were notably overrepresented in DNA surveys, averaging 15.4% and 19.7% of DNA pyrotags but only 1.8% and 2.0% of RNA pyrotags. Conversely, seven groups were overrepresented in RNA surveys. These RNA-prevalent groups were Prymnesiophyceae (averaged RNA/DNA pyrotag ratio of 7.4), MOCH-2 (6.0), Pelagophyceae (4.6), Telonema 190
(2.6), Choanomonada (2.1), Ciliophora (2.0) and Chrysophyceae (1.6). In the nanoplankton, we identified 23 taxonomic groups that accounted for 97.1% of pyrotags (between 94.7% and 99.6% amongst samples), and many were equally represented in both surveys (Fig. 4B). As for the picoplankton fraction, MALV-I and -II were prevalent in nanoplankton DNA surveys (9.8% of DNA signal versus 2.3% in RNA), while virtually the same groups were prevalent in 195
RNA surveys: Prymnesiophyceae (RNA/DNA pyrotag ratio of 8.6), MOCH-2 (5.4),
Pelagophyceae (5.3), Choanomonada (3.6), Ciliophora (2.9), and Chrysophyceae (3.7). In the micro/mesoplankton, 9 taxonomic groups explained 98.6% of pyrotags (96.6% to 99.9%). Within this compartment MALV-I was overrepresented in DNA surveys and Acantharia showed the opposite trend (Fig. 4C). In sediments, 28 groups accounted for 95.8% of 200
pyrotags (91.4 to 98.4%), and the DNA versus RNA-based taxonomic abundances were more biased than in pelagic samples (Fig. 4D). Seven groups were more abundant in DNA surveys
For Peer Review Only
(Apicomplexa, basal Fungi, Dinophyceae, MALV-I, MALV-II, Peronosporomycetes and RAD-B) while 4 were more abundant in RNA surveys (Bicosoecida, Chrysophyceae, Ciliophora and Tubulinea). In general, taxonomic groups exhibited a consistent RNA/DNA 205
trend across the four major compartments analyzed.
An overview of marine coastal protist diversity based on total RNA extracts
We averaged the contribution of each taxonomic group for all samples within the 9 different combinations of planktonic size fractions, sediments, and nucleic acid templates (Fig. S1). Here we used the RNA survey to provide an overview of protist diversity within the different 210
ecological compartments (Fig. 5), based on the 40 most prevalent taxonomic groups (which account for 97.7% pyrotags in picoplankton, 98.5% in nanoplankton, 99.4% in
micro/mesoplankton and 95.2% in sediment samples). Within the picoplankton, Dinophyceae (25.3%), Ciliophora (11.9%) and Mamiellophyceae (9.3%) were the most abundant, followed by 19 additional groups with 1 to 8% relative abundance. The taxonomic composition of the 215
nanoplankton was similar to that of the picoplankton, being dominated by Dinophyceae (39.3%), Diatomea (24.9%), and 13 additional groups at 1-8% abundance. Some contributed similarly in both size fractions, but others were clearly overrepresented in the picoplankton (Mamiellophyceae, Chrysophyceae, Pelagophyceae, Picozoa, Chlorarachniophyta, MAST-7, and MAST-4) or in the nanoplankton (Diatomea, Telonema, Katablepharidae and
220
Trebouxiophyceae). The micro/mesoplankton was dominated by Acantharia (35.1%), Dinophyceae (28.9%) and Diatomea (22.4%), and only Ciliophora and MALV-IV displayed 1-8% abundance. Finally, sediments showed remarkable differences with the plankton. Diatomea (40.9%), Ciliophora (19.4%) and Monadofilosa (11.8%) were dominant in these samples, whereas 8 additional groups appeared at 1-8% abundances, seven of them being very 225
rare in the plankton: basal Fungi, Labyrinthulomycetes, MAST-6, Granofilosea, Apusomonadida, Apicomplexa and Centrohelida.
For Peer Review Only
Dominant OTUs in RNA surveys
All previous analyses were done with OTUs clustered at 97% similarity, which sometimes enclose more than one species or genera. In our dataset, this was obvious within Dinophyceae 230
(the most abundant OTU97 retrieved 44 genera above 97% similarity), Diatomea and
Cryptomonadales. Consequently, we used OTUs clustered at 99% similarity (a total of 63,365 OTU99) to report the dominant taxa (>0.8% of pyrotags) from the RNA survey (Table 2).
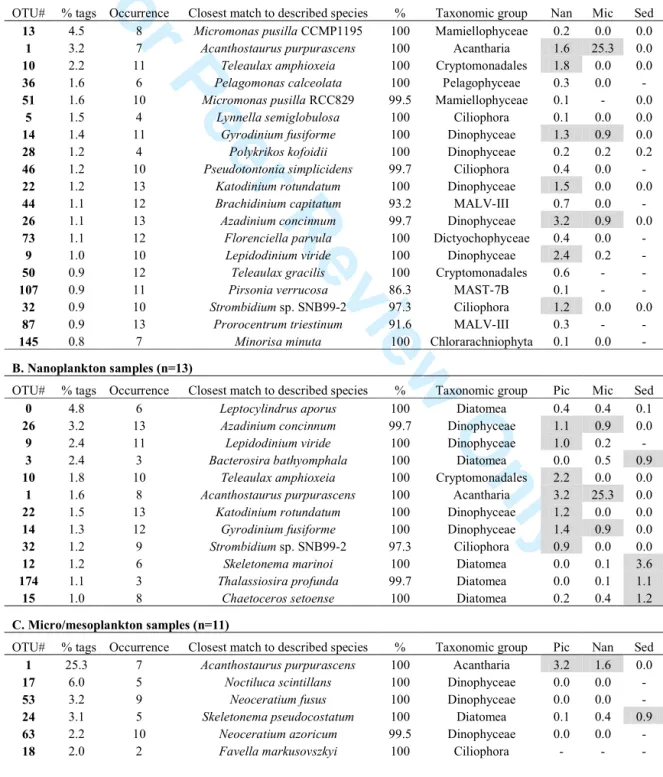
Dominant OTU99 were often 100% similar to described species. Picoplankton samples were
the most distinct, containing small-sized genera like Micromonas, Pelagomonas, Florenciella, 235
and Minorisa and several MAST and MALV phytotypes. They also included species within the Acantharia, Ciliophora and Dinophyceae known to belong to the microplankton, so their detection could be due to the presence of small life-cycle stages or to filtration artifacts. Dominant OTU99 within the other ecological compartments belonged mostly to Diatomea,
Dinophyceae, Ciliophora and Acantharia. Of particular interest were the MALV-IV OTUs in 240
the micro/mesoplankton (MALV-IV are crustaceans' parasites), and OTUs of uncultured basal Fungi, MAST-6 and Monadofilosa in sediments.
Picoplanktonic dominant OTU99 tended to exhibit a high frequency across the investigated
sites (Table 2). On average they occurred in 74% of the sites, while the occurrence of dominant OTUs in the other compartments was lower, with on average 65% of sites in the 245
nanoplankton, 56% in the micro/mesoplankton and only 55% in sediments. On note, while the dominant OTU99 of Ciliophora, Acantharia and Diatomea generally appeared in half of the
For Peer Review Only
Discussion
250Molecular surveys of marine protist diversity initiated in 2001 (Díez et al., 2001; López-García et al., 2001; Moon-van der Staay et al., 2001), and developed together with the
availability of new molecular tools including HTS (Amaral-Zettler et al., 2009; Cheung et al., 2010; Edgcomb et al., 2011; Logares et al., 2014). Previous surveys were partial, restricted to a cell-size fraction, a given geographic area, or a single nucleic acid template. We study here 255
planktonic and benthic protist diversity inhabiting distant coastal places, from the smallest picoeukaryotes to larger colonial cells up to 2 mm in size (including also dissolved DNA), and derived from DNA and RNA templates. Given that the sampling plan was designed to maximize the ecological space covered, the emerging patterns are likely generalizable to other similar coastal locations (in terms of latitude and/or bathymetry). Seasonal studies at each 260
site, required for a complete diversity description (Nolte et al., 2010), were not addressed in our survey, but time-series HTS datasets are underway in most sites. Moreover, HTS studies using group-specific primers are being conducted to obtain a finer phylogenetic resolution of particular taxonomic groups (Egge et al., 2015). Altogether, our study gives an improved view of marine protists diversity and clearly illustrates the differences between the taxonomic 265
composition derived in DNA and RNA surveys.
Technical considerations
There has been concern about the lack of replication in molecular surveys (Prosser, 2010; Robasky et al., 2014), and our strategy was to test the reproducibility of OTU profiles in a set of 25 samples processed twice for the PCR and pyrosequencing steps. Duplicated pairs were 270
usually very similar (range of R2 from 0.64 to 1.00) and systematically retrieved the same dominant OTUs at comparable relative abundances. Thus, our molecular surveys were well suited for obtaining robust ß-diversity and taxonomic descriptions. Nevertheless, many low
For Peer Review Only
abundant OTUs were found in only one pair, implying that undersampling was affecting the richness observed and/or the finding of different errors in each pair (Decelle et al., 2014). 275
During the preparation of the OTU table for downstream analysis we removed unknown OTUs that contributed substantially to the OTU number (~13%) but little to the pyrotag number (~1%). This removed sequencing artifacts and chimeras while did not compromise our goal of a comprehensive protist description since they represented few pyrotags. Novel diversity was likely removed, however investigating novel branches on the tree of life was not 280
the aim of this study and deserves a separate analysis. We also removed OTUs affiliating to metazoans, which contributed 1-10% of pyrotags in picoplankton and nanoplankton and about 50% in micro/mesoplankton and sediment samples. The presence of metazoans in smaller fractions could be due to minute life-cycle stages but also to the breakdown of animals during filtration. The later certainly occurs in some cases, such as picoplankton OTUs affiliating to 285
copepods (these have internal fecundation and never release gametes). So, although metazoans are worthy targets for molecular studies (Fonseca et al., 2010), we preferred to exclude them from our analysis. Finally, our survey aimed to cover all eukaryotic lineages but it is important to keep in mind that universal primers may miss some relevant taxonomic groups. In our case, this negative selection was certain for Foraminifera, Prymnesiophyceae, 290
and several excavate lineages.
DNA versus RNA-based surveys of total marine protist diversity
Comparing diversity surveys using environmental DNA or RNA is a common practice in microbial ecology (Weinbauer et al., 2002). Initially, the rDNA/rRNA ratios measured from a given microbial population were proposed as proxies of in situ growth rates (Poulsen et al., 295
1993), but soon this moved to a more qualitative scenario where OTUs found in DNA surveys indicated species present, while OTUs found in RNA represented active species (Stoeck et al.,
For Peer Review Only
2007; Jones and Lennon, 2010). Even this simplified view might not be universal, and differences in life histories, life strategies, and non-growth activities among species might confound this interpretation (Blazewicz et al., 2013). Nevertheless, protistologists have 300
generally accepted this scenario, and RNA surveys were recently used to identify the active protist community (Stoeck et al., 2007; Not et al., 2009; Lejzerowicz et al., 2013). However, there is an additional factor that may severely affect rDNA/rRNA comparisons in eukaryotes, which is the large variation (up to orders of magnitude) in the rDNA copy number among species (Zhu et al., 2005; Weber and Pawlowski, 2013).
305
In our dataset, community structure derived from DNA or RNA templates was similar, as paired samples clustered very close in the dendrogram and many taxonomic groups exhibited similar relative abundances. Among the groups with differential abundance, the most extreme were MALV-I and MALV-II that dominated picoplankton DNA surveys as in other studies (Massana, 2011) and contributed little to RNA surveys. One explanation for this discrepancy 310
is that the MALV I-II parasites are abundant in the picoplankton as dispersal, relatively inactive stages with few ribosomes. However, FISH (Fluorescence In situ Hybridization) direct cell counts showed relative abundances much lower than in DNA surveys (Siano et al., 2010), so a most plausible explanation is that MALV I-II cells have a higher genomic rDNA copy number than other picoeukaryotes. Similarly, groups more abundant in RNA surveys 315
may have lower rDNA copy numbers. Given the consistent trends found across size-fractions, our DNA/RNA ratios could reflect different genomic architectures among taxonomic groups, and not necessarily different relative activities. At any rate, RNA surveys should provide a better representation of in situ protist biomass and diversity, since labile RNA likely derives from living cells, in contrast with DNA that can be preserved in dead cells or in the dissolved 320
extracellular pool (Karl and Bailiff, 2012). Our analysis of the eukaryotic diversity derived from dissolved DNA samples showed that, in contrast to what was found in anoxic deep-sea
For Peer Review Only
sediments (Corinaldesi et al., 2011), these samples did not contain a particular phylogenetic signature. Dissolved DNA samples from these coastal sites resembled the pico- and
nanoplankton from the same seawater, suggesting cell breakage during filtration. 325
Marine protist diversity across organismal size-fractions and habitats
Our analysis confirms a well-known observation that planktonic and benthic protists are different (Lee and Patterson, 1998; Bik et al., 2012). This was evident in the ß-diversity analysis as well as in the taxonomic list, where 13 out of 40 groups were much more abundant in sediments than in the water column. Sediments have also been considered seed banks of 330
planktonic biodiversity, out of which taxa can re-emerge into the plankton at appropriate seasons (Satta et al., 2010). Our data is consistent with this view, since dominant OTUs in the plankton generally were also found, at lower abundances, in sediments.
Regarding planktonic assemblages, our data show a broad differentiation among larger (micro/mesoplankton) and smaller (pico- and nanoplankton) protists. This could be due partly 335
to the different collection protocols (net tows and pressure filtration, respectively), but also from the known different cell size of given species. Within the micro/mesoplankton, only four taxonomic groups dominated, Acantharia, Dinophyceae, Diatomea and Ciliophora, and we did not find other relevant groups, consistent with classical inverted microscopy inspections of the plankton. At the other end of the size spectrum, many taxonomic groups were
340
identified, highlighting the high-rank diversity of small marine protists (Massana, 2011). Picoplankton and nanoplankton assemblages from the same seawater were always related, but a closer inspection revealed marked differences in the relative abundances of key groups. The diversity of both large and small protists was very different in each coastal site, so a standard protist community could not be delineated. Samples from the same site but different seasons 345
For Peer Review Only
were also unrelated, indicating the impact of seasonal successions and highlighting that one or few samples cannot represent the complete diversity at one site.
Molecular surveys of protist diversity have often used size-fractionated samples to discern among different size classes. This step may introduce artifacts, derived from cell breakage and retention of smaller fragments in the smaller size fraction, or from the retention of smaller 350
cells in filters whose larger pores have been obstructed after processing large sample volumes. Our study has ample evidences of the first case, since about 40% of picoplankton pyrotags comes from the four dominating micro/mesoplankton groups. Although part of this signal might derive from gametes or spores (Amato et al., 2007; Kimoto et al., 2011), the most plausible explanation is that larger cells from these groups (typically >10 µm) are broken 355
during the filtration (Sørensen et al., 2013). This bias could have been even more dramatic had we used a smaller pore-size filter (such as 0.2 µm) for picoplankton collection (Sørensen et al., 2013). Picoeukaryote diversity excluding this microplanktonic signal would be
composed by a set of photosynthetic groups (58% of pyrotags), heterotrophic groups (16%), MALV clades (15%) and MAST clades (11%). Following this reasoning, it is expected that 360
nanoplanktonic cells are also represented in the picoplankton (such as Cryptomonadales). The second case of filtration artifact, smaller cells retained in larger size fractions, is not obvious from our data, and groups known to be picoeukaryotes (like Mamiellophyceae, MAST-4 or MAST-7) are only minoritary in the nanoplankton. So, our data show clear evidence of larger cells collected in smaller size fractions but little support of the other way around. Filtration 365
artifacts need to be considered when interpreting molecular surveys, and cell sizes should be established by direct cell observations by FISH (Siano et al., 2010, Massana, 2011).
For Peer Review Only
Concluding remarks
This study presents a description of marine coastal protist diversity obtained from 95 independent HTS samples. Our data show that larger protists affiliate to a few taxonomic 370
groups well studied by microscopy for decades, whereas smaller protists, known as "small flagellates", include a wide variety of less-known taxonomic groups. Our results provide answers to the initial questions, with a special emphasis on (i) the general similarity between DNA and RNA surveys despite clear biases in few groups, (ii) the taxonomic discontinuity between micro/mesoplankton and the two smaller size fractions, (iii) the phylogenetic 375
signature of dissolved DNA deriving from the smallest cells in the sample, and (iv) the distinct composition of planktonic and benthic communities. Our data also suggests a higher seasonal variability in the plankton compared to the benthos. These patterns emerging from the large spatial sampling strategy adopted here would likely apply to other coastal sites, while open ocean assemblages require similar approaches (de Vargas et al., 2015). In the 380
future, diversity studies based on sequencing surveys, complementary FISH counts and SAGs (Single Amplified Genomes) analyses will contribute to infer the genetic potential and
ecological roles of the key protist players.
Experimental Procedures
385Sampling
Marine samples were collected through the BioMarKs project (http://biomarks.eu/) in coastal sites near Blanes (Balearic Sea, Spain), Gijon (Gulf of Biscay, Spain), Naples (Tyrrhenian Sea, Italy), Oslo (Skagerrak, Oslofjorden, Norway), Roscoff (Western English Channel, France) and Varna (Black Sea, Bulgaria) (Table 1). Some sites are long-term observatories, 390
For Peer Review Only
the Blanes Bay Microbial Observatory (BBMO), the Long Term Ecological Research station MareChiara (Naples), and the SOMLIT-Astan site (Roscoff). Seawater temperature, salinity and chlorophyll a concentration were recorded with CTD (conductivity-temperature-depth) and fluorometer sensors. Water samples were collected with Niskin bottles at the sea surface in all sites (and at the DCM [deep chlorophyll maximum] in a few sites), and passed through 395
a 20 µm metallic sieve. The nanoplankton (3-20 µm) and picoplankton (0.8-3 µm) fractions were sampled from ~20 liters of seawater filtered sequentially with a peristaltic pump through 3 µm and 0.8 µm polycarbonate (PC) membranes (142 mm diameter) for less than 40 min to minimize RNA degradation. For dissolved DNA, 20 liters of 0.2 µm-filtered seawater were mixed with 400 mL of 0.5% CTAB (pH=8) for 5 h and filtered onto 0.2 µm PC membranes 400
(142 mm). A plankton net of 20-µm mesh-size was towed for 5-15 min and the large protists collected were rinsed with 0.2 µm filtered seawater, passed through a 2000 µm metallic sieve and filtered on 12 µm PC membranes (47 mm), to collect the micro- (20-200 µm) and meso- (200-2000 µm) planktonic fractions (micro/mesoplankton). Filters were flash-frozen and stored at -80° C until processed. Finally, sediment cores were taken with a Multicorer sampler 405
or by Scuba divers and kept at -80°C until processed.
Nucleic acid extraction and pyrosequencing
Total DNA and RNA were extracted simultaneously from a complete filter using the NucleoSpin® RNA kit (Macherey-Nagel) or from 2.5 g of surface sediment (~1 cm upper layer) using the Power Soil RNA kit (MoBio). Extracts were quantified using a Nanodrop 410
ND-1000 Spectrophotometer and checked on a 1.5% agarose gel. Contaminating DNA was removed from RNA extracts using the Turbo DNA-free kit (Ambion). Complete DNA removal was verified by PCR using eukaryotic primers, and in the few cases of positive PCR we did a second DNase treatment. One hundred ng of extracted RNA were immediately
For Peer Review Only
reverse transcribed to cDNA using the RT Superscript III random primers kit (Invitrogen). 415
Both DNA extracts and cDNA products were kept at -80°C until processed.
Environmental DNA or cDNA were used as templates for PCR amplification of the V4 region of the 18S rDNA (~380 bp) using primers TAReuk454FWD1 and TAReukREV3 (Stoeck et al., 2010) that amplify most eukaryotic groups. The forward primer had a barcode and both primers were adapted for 454 sequencing. PCR reactions (25 µl) contained 1x Master Mix 420
Phusion® High-Fidelity DNA Polymerase (Finnzymes), 0.35 µM of each primer, 3% DMSO, and 5 ng of DNA or cDNA. The PCR program had an initial denaturation step at 98°C during 30 sec, 10 cycles of 10 sec at 98°C, 30 sec at 53°C and 30 sec at 72°C, then 15 similar cycles but with 48°C annealing temperature, and a final step at 72°C for 10 min. PCR triplicates were purified and eluted (30 µl) with NucleoSpin® Gel and PCR Clean-Up kit (Macherey-425
Nagel), and quantified with the Quant-It™ PicoGreen® dsDNA Assay kit (Invitrogen). About 1 µg of pooled amplicons were sent to Genoscope (http://www.genoscope.cns.fr, France) for pyrosequencing on a 454 GS FLX Titanium system (454 Life Sciences, USA). The complete sequencing dataset is available at the European Nucleotide Archive (ENA) under the study accession number PRJEB9133 (http://www.ebi.ac.uk/ena/data/view/PRJEB9133).
430
Pyrotag processing and OTU tables
Sequences obtained through 454 sequencing (pyrotags) were demultiplexed using the barcode identifier in the forward primer. Pyrotags 150-600 bp long, with exact primer sequences, and with homopolymers no longer than 8 bases, were retained. Identical pyrotags within each sample were dereplicated to keep a single representative sequence. For quality check, errors 435
were computed in sliding windows of 50 bp and pyrotags containing a window with an error >1% and appearing only once in the dataset were removed. Chimera check was run with UCHIME (Edgar et al., 2011), using de novo and reference-based chimera searches against
For Peer Review Only
the SILVA108 release (Quast et al., 2013). Additional chimera searches were done using ChimeraSlayer (Haas et al., 2011) and SILVA108. A local BLAST search (Altschul et al., 440
1990) against SILVA108 was used to exclude 16S rDNA prokaryotic or plastidial sequences.
This initial procedure yielded ~1.3 million curated pyrotags derived from 120 samples (95 distinct samples, 25 of them in duplicate [same nucleic acid extract but separate PCR and sequencing reactions]). These were clustered into OTUs (Operational Taxonomic Units) at 97% similarity (OTU97) with USEARCH (Edgar, 2010). A local BLAST was done to
445
compare the representative sequence of each OTU (the most abundant one) against the GenBank Release 183.0. Distant OTUs having an e-value >10-100 (below ~85% similarity) were considered as "unknown" and removed. Taxonomic OTU assignation was performed by best hit BLAST against two reference databases, PR2 (Guillou et al., 2013) and a smaller and phylogenetically fully-validated database (Pernice et al., 2013). Metazoans and nucleomorphs 450
were removed, leaving OTUs classified into 99 eukaryotic groups, including 64 described groups generally at class level (Adl et al., 2012), 27 environmental ribogroups (Guillou et al., 2008; Massana et al., 2014), and 8 unidentified categories within each supergroup. The initial OTU table (120 samples) was used to extract duplicated samples. A second table with the distinct 95 samples was prepared for the general diversity analyses. A third table (only the 44 455
RNA samples) was used for the taxonomic description (see Table S2 for the number of OTUs and pyrotags within these tables).
For beta diversity analyses, three samples with few 300-500 pyrotags (Table S1) were removed from the OTU table and the remaining 92 samples were subsampled to 1402 pyrotags using the tool "rrarefy" of the Vegan R package (Oksanen et al., 2008). Pyrotag 460
counts were log transformed to diminish the effect of the most abundant OTUs, and the table subsampled again with rrarefy (after multiplying the log-transformed values times 1000) to obtain the same signal per sample. A distance matrix was computed with the Bray-Curtis
For Peer Review Only
index and a dendrogram was constructed using the UPGMA function in Vegan. Venn diagrams were generated with the R package VennDiagram.
465
Acknowledgments
Financial support has been provided by the European project BioMarKs (2008-6530, ERA-net Biodiversa, EU), and state-based projects FLAME (CGL2010-16304, MICINN, Spain) to RM, OCEANOMICS (ANR-11-BTBR-0008, France) to CdV, grant 31003A-125372 (Swiss 470
National Foundation) to JP, and RCN grant 190307 (Norway) to BE.
Conflict of Interest
The authors declare no conflict of interest.
475
References
Adl, S.M., Simpson, A.G.B, Lane, C.E., Lukes, J., Bass, D., Bowser, S.S., et al. (2012) The revised classification of eukaryotes. J Eukaryot Microbiol 59: 429-493.
Altschul, S.F., Gish, W., Miller, W., Myers, E.W., and Lipman, D.J. (1990) Basic local alignment search tool. J
Mol Biol 215: 403-410.
480
Amaral-Zettler, L.A., McCliment, E.A., Ducklow, H.W., and Huse, S.M. (2009) A method for studying protistan diversity using massively parrallel sequencing of V9 hypervariable regions of small-subunit ribosomal RNA genes. PLoS ONE 4: e6372.
For Peer Review Only
Amato, A., Kooistra, W.H.C.F., Ghiron, J.H.L., Mann, D.G., Pröschold, T., and Montresor, M. (2007) Reproductive isolation among sympatric cryptic species in marine diatoms. Protist 158: 193-207. 485
Bates, S.T., Clemente, J.C., Flores, G.E., Walters, W.A., Parfrey, L.W., Knight, R., and Fierer, N. (2013) Global biogeography of highly diverse protistan communitites in soil. ISME J 7: 652-659.
Berney, C., Romac, S., Mahé, F., Santini, S., Siano, R., and Bass, D. (2013) Vampires in the oceans: predatory cercozoan amoebae in marine habitats. ISME J 7: 2387-2399.
Bik, H.M., Sung, W., De Ley, P., Baldwin, J.G., Sharma, J., Rocha-Olivares, A., and Thomas, W.K. (2012) 490
Metagenetic community analysis of microbial eukaryotes illuminates biogeographic patterns in deep-sea and shallow water sediments. Mol Ecol 21: 1048-1059.
Blazewicz, S.J., Barnard, R.L., Daly, R.A., and Firestone, M.K. (2013) Evaluating rRNA as an indicator of microbial activity in environmental communities: limitations and uses. ISME J 7: 2061- 2068.
Burki, F. (2014) The eukaryotic tree of life from a global phylogenomic perspective. Cold Spring Harb Perspect 495
Biol 6: a016147.
Caron, D.A., Worden, A.Z., Countway, P.D., Demir, E., and Heidelberg, K.B. (2009) Protists are microbes too: a perspective. ISME J 3: 4-12.
Cheung, M.K., Au, C.H., Chu, K.H., Kwan, H.S., and Wong, C.K. (2010) Composition and genetic diversity of picoeukaryotes in subtropical coastal waters as revealed by 454 pyrosequencing. ISME J 4: 1053-59.
500
Corinaldesi, C., Barucca, M., Luna, G.M., and Dell'Anno, A. (2011) Preservation, origin and genetic imprint of extracellular DNA in permanently anoxic deep-sea sediments. Mol Ecol 20: 642-654.
Decelle, J., Romac, S., Sasaki, E., Not, F., and Mahé, F. (2014) Intracellular diversity of the V4 and V9 regions of the 18S rRNA in marine protists (Radiolarians) assessed by high-throughput sequencing. PLoS ONE 9: e104297.
505
de Vargas, C., Audic, S., Henry, N., Decelle, J., Mahé, F., Logares, R., et al. (2015) Eukaryotic plankton diversity in the sunlit ocean. Science 348: 1261605-1-11.
For Peer Review Only
Díez, B., Pedrós-Alió, C., and Massana, R. (2001) Study of genetic diversity of eukaryotic picoplankton in different oceanic regions by small-subunit rRNA gene cloning and sequencing. Appl Environ Microbiol 67: 2932-2941.
510
Dolan, J.R., Landry, M.R., and Ritchie, M.E. (2013) The species-rich assemblages of tintinnids (marine planktonic protists) are structured by mouth size. ISME J 7: 1237-1243.
Edgar, R.C. (2010) Search and clustering orders of magnitude faster than BLAST. Bioinformatics 26: 2460-2461.
Edgar, R.C., Haas, B.J., Clemente, J.C., Quince, C., and Knight, R. (2011) UCHIME improves sensitivity and 515
speed of chimera detection. Bioinformatics 27: 2194–2200.
Edgcomb, V., Orsi, W., Bunge, J., Jeon, S., Christen, R., Leslin, C., et al. (2011) Protistan microbial observatory in the Cariaco Basin, Caribbean. I. Pyrosequencing vs. Sanger insights into species richness. ISME J 5: 1344-1356.
Egge, E.S., Johannessen, T.V., Andersen, T., Eikrem, W., Bittner, L., Larsen, A., et al. (2015) Seasonal diversity 520
and dynamics of haptophytes in the Skagerrak, Norway, explored by high-throughput sequencing. Mol Ecol doi: 10.1111/mec.13160.
Fonseca, V.G., Carvalho, G.R., Sung, W., Johnson, H.F., Power, D.M., Neill, S.P., et al. (2010) Second-generation environmental sequencing unmasks marine metazoan biodiversity. Nat Commun 1: 98.
Graham, J.M., Kent, A.D., Lauster, G.H., Yannarell, A.C., Graham, L.E., and Triplett, E.W. (2004) Seasonal 525
dynamics of phytoplankton and planktonic protozoan communities in a Northern temperate humic lake: Diversity in a dinoflagellate dominated system. Microb Ecol 48: 528-540.
Guillou, L., Viprey, M., Chambouvet, A., Welsh, R.M., Kirkham, A.R., Massana, R., et al. (2008) Widespread occurrence and genetic diversity of marine parasitoids belonging to Syndiniales (Alveolata). Environ Microbiol
10: 397-408.
530
Guillou, L., Bachar, D., Audic, S., Bass, D., Berney, C., Bittner, L., et al. (2013) The Protist Ribosomal Reference database (PR2): a catalog of unicellular eukaryote Small SubUnit rRNA sequences with curated taxonomy. Nucleic Acids Res 41: D597-D604.
For Peer Review Only
Haas, B.J., Gevers, D., Earl, A.M., Feldgarden, M., Ward, D.V., Giannoukos, G., et al. (2011) Chimeric 16S rRNA sequence formation and detection in Sanger and 454-pyrosequenced PCR amplicons. Genome Res 21: 535
494-504.
He, L., Liu, F., Kauppiah, V., Ren, Y., and Li, Z. (2014) Comparisons of the fungal and protistan communities among different marine sponge holobionts by pyrosequencing. Microb Ecol 67: 951-961.
Jones, S.E., and Lennon, J.T. (2010) Dormancy contributes to the maintenance of microbial diversity. Proc Natl
Acad Sci USA 107: 5881- 5886.
540
Karl, D.M., and Bailiff, M.D. (2012) The measurement and distribution of dissolved nucleic acids in aquatic environments. Limnol Oceanogr 34: 543–558.
Keeling, P.J., Burger, G., Durnford, D.G., Lang, B.F., Lee, R.W., Pearlmen, R.E., et al. (2005) The tree of eukaryotes. Trends Ecol Evol 20: 670-676.
Kimoto, K., Yuasa, T., and Takahashi, O. (2011) Molecular identification of reproductive cells released from 545
Cypassis irregularis Nigrini (Radiolaria). Environ Microbiol Rep 3: 86–90.
Lee, W.J., and Patterson, D.J. (1998) Diversity and geographic distribution of free-living heterotrophic flagellates - Analysis by PRIMER. Protist 149: 229-244.
Lejzerowicz, F., Voltsky, I., and Pawlowski, J. (2013) Identifying active foraminifera in the Sea of Japan using metatrascriptomic approach. Deep Sea Res II 86-87: 214-220.
550
Logares, R., Audic, S., Santini, S., Pernice, M.C., de Vargas, C., and Massana, R. (2012) Diversity patterns and activity of uncultured marine heterotrophic flagellates unveiled with pyrosequencing. ISME J 6: 1823-1833.
Logares, R., Audic, S., Bass, D., Bittner, L., Boutte, C., Christen, R., et al. (2014) Patterns of rare and abundant marine microbial eukaryotes. Curr Biol 24: 813-821.
López-García, P., Rodríguez-Valera, F., Pedrós-Alió, C., and Moreira, D. (2001) Unexpected diversity of small 555
For Peer Review Only
Mangot, J.-F., Domaizon, I., Talb, N., Marouni, N., Duffaud, E., Bronner, G., and Debroas, D. (2013) Short-term dynamics of diversity patterns: evidence of continual reassembly within lacustrine small eukaryotes. Environ
Microbiol 15: 1745-1758.
Massana, R., Castresana, J., Balagué, V., Guillou, L., Romari, K., Groisillier, A., et al. (2004) Phylogenetic and 560
ecological analysis of novel marine stramenopiles. Appl Environ Microbiol 70: 3528-3534.
Massana, R. (2011) Eukaryotic picoplankton in surface oceans. Annu Rev Microbiol 65: 91-110.
Massana, R., del Campo, J., Sieracki, M.E., Audic, S., and Logares, R.(2014)Exploring the uncultured microeukaryotic majority in the oceans: reevaluation of ribogroups within stramenopiles. ISME J. 8: 854-866.
Moon-van der Staay, S.Y., De Wachter, R., and Vaulot, D. (2001) Oceanic 18S rDNA sequences from 565
picoplankton reveal unsuspected eukaryotic diversity. Nature 409: 607-610.
Nanjappa, D., Audic, S., Romac, S., Kooistra, W.H.C.F., and Zingone, A. (2014) Assessment of species diversity and distribution of an ancient diatom lineage using a DNA metabarcoding approach. PLoS ONE 9: e103810 .
Nolte, V., Pandey, R.V., Jost, S., Medinger, R., Ottenwälder, B., Boenigk, J., and Schlötterer, C. (2010) 570
Contrasting seasonal niche separation between rare and abundant taxa conceals the extent of protist diversity.
Mol Ecol 19: 2908-2915.
Not, F., Valentin, K., Romari, K., Lovejoy, C., Massana, R., Töbe, K., et al. (2007) Picobiliphytes: A marine picoplanktonic algal group with unknown affinities to other eukaryotes. Science 315: 252-254.
Not, F., del Campo, J., Balagué, V., de Vargas, C., and Massana, R. (2009) New insights into the diversity of 575
marine picoeukaryotes. PLoS ONE 4: e7143.
Oksanen, J., Kindt, R., Legendre, P., O’Hara, B., Simpson, G.L., Solymos, P., et al. (2008) Vegan: community ecology package. R package version 1.15-0 (Finland: University of Oulu).
Olguín, H.F., Boltovskoy, D., Lange, C.B., and Brandini, F. (2006) Distribution of spring phytoplankton (mainly diatoms) in the upper 50 m of the Southwestern Atlantic Ocean (30-61°S). J Plankton Res 28: 1107-1128. 580
For Peer Review Only
Pawlowski, J., Audic, S., Adl, S., Bass, D., Belbahri, L., Berney, C., et al. (2012) CBOL Protist Working Group: Barcoding eukaryotic richness beyond animal, plant, and fungal kingdoms. PLOS Biol 10: e1001419.
Pedrós-Alió, C. (2006) Marine microbial diversity: can it be determined? Trends Microbiol 14: 257–263.
Pernice, M.C., Logares, R., Guillou, L., and Massana, R. (2013) General patterns of diversity in major marine microeukaryote lineages. PLoS ONE 8: e57170.
585
Pizay, M.-D., Lemée, R., Simon, N., Cras, A.-L., Laugier, J.-P., and Dolan, J.R. (2009) Night and day morphologies in a planktonic dinoflagellate. Protist 160: 565-575.
Poulsen, L.K., Ballard, G., and Stahl, D.A. (1993) Use of rRNA fluorescence in situ hybridization for measuring the activity of single cells in young and established biofilms. Appl Environ Microbiol 59: 1354–1360.
Prosser, J.I. (2010) Replicate or lie. Environ Microbiol 12: 1806-1810. 590
Quast, C., Pruesse, E., Yilmaz, P., Gerken, J., Schweer, T., Yarza, P., et al. (2013) The SILVA ribosomal RNA gene database project: improved data processing and web-based tools. Nucleic Acids Res 41: D590-D596.
Robasky, K., Lewis, N.E., and Church, G.M. (2014) The role of replicates for error mitigation in next-generation sequencing. Nature Rev Genet 15: 56–62.
Satta, C.T., Anglès, S., Garcés, E., Lugliè, A., Padedda, B.M., and Sechi, N. (2010) Dinoflagellate cysts in 595
recent sediments from two semi-enclosed areas of the Western Mediterranean Sea subject to high human impact.
Deep-Sea Res II 57: 256-267.
Schaechter, M. (2012) Eukaryotic Microbes (editor). Elsevier, Oxford, UK.
Seenivasan, R., Sausen, N., Medlin, L.K., and Melkonian, M. (2013) Picomonas judraskeda Gen. et Sp. Nov.: The first identified member of the Picozoa phylum Nov., a widespread group of picoeukaryotes, formerly known 600
as 'Picobiliphytes'. PLoS ONE 8: e59565.
Sherr, B.F., Sherr, E.B., Caron, D.A., Vaulot, D., and Worden, A.Z. (2007) Oceanic protists. Oceanography 20: 130-134.
For Peer Review Only
Siano, R., Alves-de-Souza, A., Foulon, E., Bendif, E.M., Simon, N., Guillou, L., and Not, F. (2010) Distribution and host diversity of Amoebophryidae parasites across oligotrophic waters of the Mediterranean Sea. Biogeosci 605
Discuss 7: 7391-7419.
Sørensen, N., Daugbjerg, N., and Richardson K. (2013) Choice of pore size can introduce artefacts when filtering picoeukaryotes for molecular biodiversity surveys. Microb Ecol 65: 964-968.
Stoeck, T., Zuendorf, A., Breiner, H.-W., and Behnke, A. (2007) A molecular approach to identify active microbes in environmental eukaryote clone libraries. Microb Ecol 53: 328-339.
610
Stoeck, T., Bass, D., Nebel, M., Christen, R., Jones, M.D., Breiner, H.W., and Richards, T.A. (2010) Multiple marker parallel tag environmental DNA sequencing reveals a highly complex eukaryotic community in marine anoxic water. Mol Ecol 19 Suppl 1: 21-31.
Weber, A., and Pawlowski, J. (2013) Can abundance of protists be inferred from sequence data? A case study of cultured Foraminifera. PLoS ONE 8: e56739.
615
Weinbauer, M.G., Fritz, I., Wenderoth, D.F., and Höfle, M.G. (2002) Simultaneous extraction from
bacterioplankton of total RNA and DNA suitable for quantitative structure and function analyses. Appl Environ
Microbiol 68: 1082–1087.
Zhu, F., Massana, R., Not, F., Marie, D., and Vaulot, D. (2005) Mapping of picoeucaryotes in marine ecosystems with quantitative PCR of the 18S rRNA gene. FEMS Microbiol Ecol 52: 79-92.
620
For Peer Review Only
Table legends
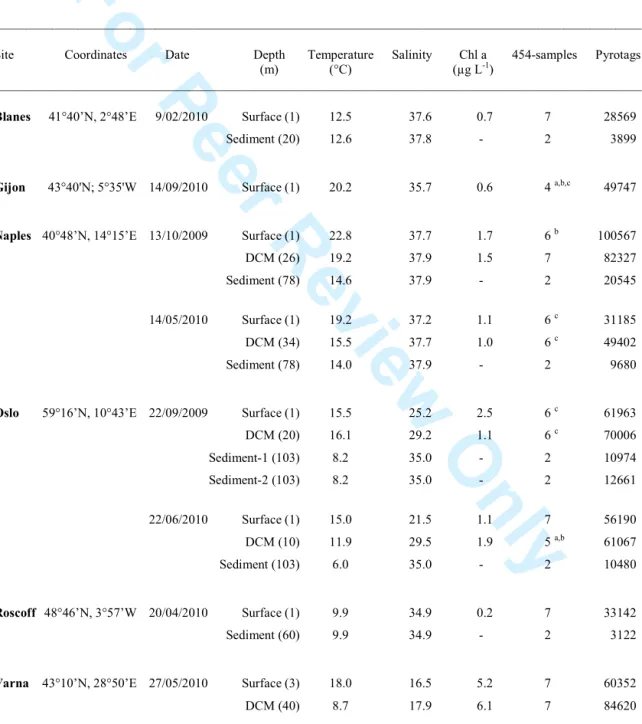
Table 1. Coastal marine sites visited and water column (surface and DCM) and sediment samples taken for investigating global protist diversity by pyrosequencing. Each planktonic 625
community is analyzed in up to seven 454-samples (pico, nano and micro/mesoplankton by RNA/DNA plus dissolved DNA) and each sediment sample in two (by RNA/DNA). Cases with no sequencing results are noted. See Table S1 for details on the number of pyrotags for each 454-sample.
Table 2. Averaged relative abundance (% tags), occurrence (number of times detected), and 630
taxonomic affiliation of the most abundant OTU99 derived from the RNA survey in the four
ecological compartments. Relative abundances in the other compartments (Pic= Picoplankton; Nan= Nanoplankton: Mic= Micro/mesoplankton; Sed= Sediments) are also shown (in grey when >0.8%).
For Peer Review Only
Figure legends
Fig. 1. Summary of the comparison of duplicated 454-samples (n=25) shown in relation to the pyrotag ratio between duplicates. A. Statistics of the linear regressions between the OTU abundance in each duplicate: R2 coefficients (white dots) and slope values (black dots; regression line shown). B. Percentage of OTUs shared in duplicate pairs (black dots; 640
regression line shown) and percentage of pyrotags within these shared OTUs (white dots). These later percentages apply to the pair with less pyrotags.
Fig. 2. UPGMA dendrogram based on the Bray-Curtis dissimilarity matrix from an OTU table with 92 samples (subsampled to 1402 pyrotags and log-transformed). Sample names have four components: sampling cruise, depth, size fraction, and nucleic acid template. The 645
three main clusters are highlighted. Large grey dots indicate grouping of samples from the same sampling event, while small black dots indicate a closest relation of the same
assemblage analyzed by DNA and RNA.
Fig. 3. Number of shared OTUs among plankton size-fractions derived from the DNA survey in five cases. Areas covering the dissolved samples are shaded. Below the number of shared 650
OTUs, the percentages of pyrotags they represent in dissolved samples are shown.
Fig. 4. Relative pyrotag abundance in RNA and DNA surveys of taxonomic groups in picoplankton (A), nanoplankton (B), micro/mesoplankton (C) and sediment (D) samples. Each point represents paired percentages (in logarithmic scales) of a given taxonomic group in a given sample. Groups selected are those with highest pyrotag abundance (together 655
account for 96-98% of pyrotags). Groups overrepresented in DNA surveys appear above the 1:1 line as colored triangles, those overrepresented in RNA surveys appear below the line as colored circles, and those equally represented appear as small black circles.
For Peer Review Only
Fig. 5. Percentages of pyrotags (average and standard error) of taxonomic groups in RNA surveys in the picoplankton (13 samples), nanoplankton (13 samples), micro/mesoplankton 660
(11 samples) and sediments (7 samples). Note the different vertical scale in the four plots. Groups are ordered by their overall pyrotag abundance in the whole dataset.
For Peer Review Only
Supporting Information
Table S1. Number of pyrotags per 454-sample in the global survey of protist diversity in the plankton (several organismal size-fractions) and sediments analyzed in DNA and RNA surveys (total of 95 samples). See Table 1 for additional information on sampling cruises.
Table S2. Number of OTUs and pyrotags included in OTU97 tables, showing the initial 670
numbers and the final numbers after excluding unknown, metazoan, and nucleomorph OTUs. Three OTU tables are used in this study: 120 samples (all datasets including duplicates), 95 samples (duplicates removed), and 44 samples (only the RNA survey).
Fig. S1. Percentages of pyrotags (average and standard error) of taxonomic groups in RNA and DNA surveys in the picoplankton, nanoplankton, micro/mesoplankton, sediments and the 675
dissolved fraction (the latter only DNA survey). Note the different vertical scale in the four plots. Groups are ordered by their overall pyrotag abundance in the whole dataset.
For Peer Review Only
Fig. 1. Summary of the comparison of duplicated 454-samples (n=25) shown in relation to the pyrotag ratio between duplicates. A. Statistics of the linear regressions between the OTU abundance in each duplicate: R2 coefficients (white dots) and slope values (black dots; regression line shown). B. Percentage of OTUs shared in duplicate pairs (black dots; regression line shown) and percentage of pyrotags within these shared OTUs
(white dots). These later percentages apply to the pair with less pyrotags. 133x141mm (300 x 300 DPI)
For Peer Review Only
Fig. 2. UPGMA dendrogram based on the Bray-Curtis dissimilarity matrix from an OTU table with 92 samples (subsampled to 1402 pyrotags and log-transformed). Sample names have four components: sampling cruise, depth, size fraction, and nucleic acid template. The three main clusters are highlighted. Large grey dots indicate grouping of samples from the same sampling event, while small black dots indicate a closest
relation of the same assemblage analyzed by DNA and RNA. 252x571mm (300 x 300 DPI)
For Peer Review Only
Fig. 3. Number of shared OTUs among plankton size-fractions derived from the DNA survey in five cases. Areas covering the dissolved samples are shaded. Below the number of shared OTUs, the percentages of
pyrotags they represent in dissolved samples are shown. 159x188mm (300 x 300 DPI)
For Peer Review Only
For Peer Review Only
For Peer Review Only
Table 1. Coastal marine sites visited and water column (surface and DCM) and sediment samples taken for investigating global protist diversity by pyrosequencing. Each planktonic community is analyzed in up to seven 454-samples (pico, nano and micro/mesoplankton by RNA/DNA plus dissolved DNA) and each sediment sample in two (by RNA/DNA). Cases with no sequencing results are noted. See Table S1 for details on the number of pyrotags for each 454-sample.
____________________________________________________________________________________________________
Site Coordinates Date Depth Temperature Salinity Chl a 454-samples Pyrotags (m) (°C) (µg L-1)
____________________________________________________________________________________________________
Blanes 41°40’N, 2°48’E 9/02/2010 Surface (1) 12.5 37.6 0.7 7 28569
Sediment (20) 12.6 37.8 - 2 3899
Gijon 43°40'N; 5°35'W 14/09/2010 Surface (1) 20.2 35.7 0.6 4 a,b,c 49747
Naples 40°48’N, 14°15’E 13/10/2009 Surface (1) 22.8 37.7 1.7 6 b 100567
DCM (26) 19.2 37.9 1.5 7 82327 Sediment (78) 14.6 37.9 - 2 20545
14/05/2010 Surface (1) 19.2 37.2 1.1 6 c 31185
DCM (34) 15.5 37.7 1.0 6 c 49402
Sediment (78) 14.0 37.9 - 2 9680
Oslo 59°16’N, 10°43’E 22/09/2009 Surface (1) 15.5 25.2 2.5 6 c 61963
DCM (20) 16.1 29.2 1.1 6 c 70006 Sediment-1 (103) 8.2 35.0 - 2 10974 Sediment-2 (103) 8.2 35.0 - 2 12661 22/06/2010 Surface (1) 15.0 21.5 1.1 7 56190 DCM (10) 11.9 29.5 1.9 5 a,b 61067 Sediment (103) 6.0 35.0 - 2 10480 Roscoff 48°46’N, 3°57’W 20/04/2010 Surface (1) 9.9 34.9 0.2 7 33142 Sediment (60) 9.9 34.9 - 2 3122
Varna 43°10’N, 28°50’E 27/05/2010 Surface (3) 18.0 16.5 5.2 7 60352
DCM (40) 8.7 17.9 6.1 7 84620 ____________________________________________________________________________________________________
a
For Peer Review Only
Table 2. Averaged relative abundance (% tags), occurrence (number of times detected), and taxonomic affiliation of the most abundant OTU99 derived from the RNA survey in the four
ecological compartments. Relative abundances in the other compartments (Pic= Picoplankton; Nan= Nanoplankton: Mic= Micro/mesoplankton; Sed= Sediments) are also shown (in grey when >0.8%).
A. Picoplankton samples (n=13)
OTU# % tags Occurrence Closest match to described species % Taxonomic group Nan Mic Sed
13 4.5 8 Micromonas pusilla CCMP1195 100 Mamiellophyceae 0.2 0.0 0.0
1 3.2 7 Acanthostaurus purpurascens 100 Acantharia 1.6 25.3 0.0
10 2.2 11 Teleaulax amphioxeia 100 Cryptomonadales 1.8 0.0 0.0
36 1.6 6 Pelagomonas calceolata 100 Pelagophyceae 0.3 0.0 -
51 1.6 10 Micromonas pusilla RCC829 99.5 Mamiellophyceae 0.1 - 0.0
5 1.5 4 Lynnella semiglobulosa 100 Ciliophora 0.1 0.0 0.0
14 1.4 11 Gyrodinium fusiforme 100 Dinophyceae 1.3 0.9 0.0
28 1.2 4 Polykrikos kofoidii 100 Dinophyceae 0.2 0.2 0.2
46 1.2 10 Pseudotontonia simplicidens 99.7 Ciliophora 0.4 0.0 -
22 1.2 13 Katodinium rotundatum 100 Dinophyceae 1.5 0.0 0.0
44 1.1 12 Brachidinium capitatum 93.2 MALV-III 0.7 0.0 -
26 1.1 13 Azadinium concinnum 99.7 Dinophyceae 3.2 0.9 0.0
73 1.1 12 Florenciella parvula 100 Dictyochophyceae 0.4 0.0 -
9 1.0 10 Lepidodinium viride 100 Dinophyceae 2.4 0.2 -
50 0.9 12 Teleaulax gracilis 100 Cryptomonadales 0.6 - -
107 0.9 11 Pirsonia verrucosa 86.3 MAST-7B 0.1 - -
32 0.9 10 Strombidium sp. SNB99-2 97.3 Ciliophora 1.2 0.0 0.0
87 0.9 13 Prorocentrum triestinum 91.6 MALV-III 0.3 - -
145 0.8 7 Minorisa minuta 100 Chlorarachniophyta 0.1 0.0 -
B. Nanoplankton samples (n=13)
OTU# % tags Occurrence Closest match to described species % Taxonomic group Pic Mic Sed
0 4.8 6 Leptocylindrus aporus 100 Diatomea 0.4 0.4 0.1
26 3.2 13 Azadinium concinnum 99.7 Dinophyceae 1.1 0.9 0.0
9 2.4 11 Lepidodinium viride 100 Dinophyceae 1.0 0.2 -
3 2.4 3 Bacterosira bathyomphala 100 Diatomea 0.0 0.5 0.9
10 1.8 10 Teleaulax amphioxeia 100 Cryptomonadales 2.2 0.0 0.0
1 1.6 8 Acanthostaurus purpurascens 100 Acantharia 3.2 25.3 0.0
22 1.5 13 Katodinium rotundatum 100 Dinophyceae 1.2 0.0 0.0
14 1.3 12 Gyrodinium fusiforme 100 Dinophyceae 1.4 0.9 0.0
32 1.2 9 Strombidium sp. SNB99-2 97.3 Ciliophora 0.9 0.0 0.0
12 1.2 6 Skeletonema marinoi 100 Diatomea 0.0 0.1 3.6
174 1.1 3 Thalassiosira profunda 99.7 Diatomea 0.0 0.1 1.1
15 1.0 8 Chaetoceros setoense 100 Diatomea 0.2 0.4 1.2
C. Micro/mesoplankton samples (n=11)
OTU# % tags Occurrence Closest match to described species % Taxonomic group Pic Nan Sed
1 25.3 7 Acanthostaurus purpurascens 100 Acantharia 3.2 1.6 0.0
17 6.0 5 Noctiluca scintillans 100 Dinophyceae 0.0 0.0 -
53 3.2 9 Neoceratium fusus 100 Dinophyceae 0.0 0.0 -
24 3.1 5 Skeletonema pseudocostatum 100 Diatomea 0.1 0.4 0.9
63 2.2 10 Neoceratium azoricum 99.5 Dinophyceae 0.0 0.0 -
For Peer Review Only
77 1.7 4 Hexaconus serratus 98.9 Acantharia 0.1 0.0 -
23 1.5 6 Biddulphia alternans 86.1 Diatomea 0.1 0.0 0.8
271 1.5 4 Hematodinium sp. ex Nephrops 95.3 MALV-IV 0.1 0.0 0.0
52 1.4 11 Neoceratium furca 100 Dinophyceae 0.0 0.0 -
54 1.4 5 Xiphacantha alata 100 Acantharia 0.0 0.1 0.0
191 1.2 2 Stenosemella pacifica 100 Ciliophora 0.0 - -
284 1.1 1 Amphorides quadrilineata 98.9 Ciliophora 0.0 - -
283 1.1 6 Thalassiosira rotula 100 Diatomea 0.0 0.1 0.2
173 1.0 11 Dinophysis acuminata 100 Dinophyceae 0.0 0.0 -
26 0.9 11 Azadinium concinnum 99.7 Dinophyceae 1.1 3.2 0.0
14 0.9 9 Gyrodinium fusiforme 100 Dinophyceae 1.4 1.3 0.0
385 0.8 2 Thalassiosira anguste-lineata 99.7 Diatomea - 0.0 0.1
161 0.8 8 Syndinium sp. ex Corycaeus 100 MALV-IV 0.1 0.0 -
D. Sediment samples (n=7)
OTU# % tags Occurrence Closest match to described species % Taxonomic group Pic Nan Mic
12 3.6 3 Skeletonema marinoi 100 Diatomea 0.0 1.2 0.1
30 2.4 3 Chaetoceros cf. neogracile 100 Diatomea 0.0 0.0 0.0
57 2.2 3 Powellomycetaceae sp. 85.7 Basal fungi 0.0 0.1 0.1
275 1.3 1 Pirsonia formosa 89.4 MAST-6 - - -
33 1.3 3 Monodinium sp. 98.7 Ciliophora 0.4 0.0 0.0
249 1.3 3 Protaspis obliqua 93.6 Monadofilosa - - -
15 1.2 5 Chaetoceros setoense 100 Diatomea 0.2 1.0 0.4
623 1.1 6 Psammodictyon sp. 99.7 Diatomea - 0.0 0.0
174 1.1 6 Thalassiosira profunda 99.7 Diatomea 0.0 1.1 0.1
24 0.9 4 Skeletonema pseudocostatum 100 Diatomea 0.1 0.4 3.1