HAL Id: halshs-01357085
https://halshs.archives-ouvertes.fr/halshs-01357085
Preprint submitted on 29 Aug 2016
HAL is a multi-disciplinary open access archive for the deposit and dissemination of sci-entific research documents, whether they are pub-lished or not. The documents may come from teaching and research institutions in France or abroad, or from public or private research centers.
L’archive ouverte pluridisciplinaire HAL, est destinée au dépôt et à la diffusion de documents scientifiques de niveau recherche, publiés ou non, émanant des établissements d’enseignement et de recherche français ou étrangers, des laboratoires publics ou privés.
Performance and Inequality in Health: A Comparison of
Child and Maternal Health across Asia
Bénédicte H. Apouey, Jacques Silber
To cite this version:
Bénédicte H. Apouey, Jacques Silber. Performance and Inequality in Health: A Comparison of Child and Maternal Health across Asia. 2016. �halshs-01357085�
WORKING PAPER N° 2016 – 17
Performance and Inequality in Health: A Comparison of
Child and Maternal Health across Asia
Bénédicte H. Apouey Jacques Silber
JEL Codes: D63, I19
Keywords: achievement indices, improvement indices, health inequalities, Asia, child health, maternal health
P
ARIS-
JOURDANS
CIENCESE
CONOMIQUES48, BD JOURDAN – E.N.S. – 75014 PARIS
TÉL. : 33(0) 1 43 13 63 00 – FAX : 33 (0) 1 43 13 63 10
www.pse.ens.fr
CENTRE NATIONAL DE LA RECHERCHE SCIENTIFIQUE – ECOLE DES HAUTES ETUDES EN SCIENCES SOCIALES
1
Performance and Inequality in Health:
A Comparison of Child and Maternal Health across Asia Bénédicte H. Apouey*, Jacques Silber**
August 2016
*
Bénédicte H. Apouey, Paris School of Economics - CNRS, 48 Boulevard Jourdan, 75014 Paris, France
Phone: 33 1 43 13 63 07
E-mail: benedicte.apouey@psemail.eu
**
Corresponding author. Jacques Silber, Department of Economics, Bar-Ilan University, 52900 Ramat-Gan, Israel, and Senior Research Fellow, LISER, Esch-sur-Alzette,
Luxembourg
Phone: (972) (3) 5318345 Fax: (972) (3) 5353180
E-mail: jsilber_2000@yahoo.com
Abstract
A country’s performance in health attainment refers to both its achievement (level) and its improvement (evolution) in the health domain. Studies on performance generally measure health attainment using the average health level of the population, and quantify health improvement employing the change in attainment over time. However this approach is flawed because the change in attainment does not satisfy good properties, on the one hand, and because health attainment should not only account for the average health level, but also for disparities in health in the population, on the other hand. We propose a solution to the first limitation by following the lead of Kakwani (1993), who uses achievement and improvement measures which are based on attainment measures and which satisfy important properties. For the second limitation, we extend the work of Kakwani and propose new definitions of attainment that account for the average health level but also for health inequalities in the population. Specifically, we focus on overall and social health inequalities and on the health of the poor. By including these new attainment variables into Kakwani’s indices, we generate new classes of achievement and improvement indices. Using data on 11 low and middle-income Asian countries in the twenty-first century, we highlight that child and maternal health have generally improved in recent decades, due to both an increase in the average health level and a decrease in inequalities.
2
Key words: achievement indices, improvement indices, health inequalities, Asia, child health, maternal health.
3 1. Introduction
The performance in health in developing countries is increasingly attracting attention from policy-makers (OECD & WHO 2003). Indeed, three of the Millennium Development Goals (MDGs) are related to health -- goal 1, eradicating extreme poverty and hunger; goal 4, reducing child mortality; and goal 5, improving maternal health -- and the target date for the attainment of these goals was the end of 2015. Recent studies highlight that the world is making progress toward these objectives, although some countries are going backward (Wagstaff et al. 2014).
A country’s “performance” in health refers to both its achievement (level)1
and its improvement (evolution) in health. To assess the performance in health of a country, most studies use the mean health level of the country as their health attainment variable, and quantify improvement using the change in attainment over time. However, this approach has two serious drawbacks. The first one is that the (absolute or relative) change in health attainment over time is not a good measure of a country’s improvement in health. Indeed, changes do not account for the fact that it is harder to improve health attainment when the health attainment level is initially higher (Sen 1981). The second drawback of studies quantifying health performance is related to the mere definition of health attainment. It is generally assumed that health attainment can be summarized by the mean health level in the population. However a country can make progress in average health by improving the health level of only one group in the population, for instance the richest, which would increase disparities in the country. In that case, it is not clear
whether health attainment really improves. We believe that we should be interested in the distribution of health within the population in addition to the mean health level (Gwatkin 2005; Suzuki et al. 2012; Wagstaff et al. 2014).
In this paper, we first follow the lead of Kakwani (Kakwani 1993) and suggest to quantify performance using improvement (evolutions) and achievement (levels) indices that are sensitive to the initial health attainment level, rather than using the change in health over time. This approach does not address the second drawback though, since in Kakwani’s original approach, the health attainment is the average health level (Kakwani
1 Sen defines well-being (or standards of living) in terms of functioning and capabilities (Sen 1985; Sen 1987; Sen 1992). Functioning is an achievement whereas capabilities are related to the ability to achieve.
4
1993). We thus extend the approach by suggesting new definitions of attainment that embody our value judgment regarding performance and account for disparities in health. We consider several aspects of disparities, namely pure health inequalities, social health inequalities (i.e. health inequalities by socioeconomic status), and the health of the poor. We then incorporate these new definitions of attainment into Kakwani’s approach to generate new improvement and achievement indices.
We employ these indices to examine performance in child and maternal health indicators in 11 Asian countries in the twenty-first century. We focus on six indicators -- infant survival, child survival, child (not) underweight, child (not) stunting, births
attended by skilled health personnel, and child full immunization. Note that these
outcomes are often used in MDG monitoring.2 For each health indicator, we compute the Kakwani and the new achievement and improvement indices. Moreover, we examine whether the choice of the Kakwani or the new indices matters when assessing the performance of a country. Finally, we test whether countries make progress on several health dimensions at the same time.
The contribution of our paper is both methodological and empirical. In the methodological part, we contribute to the literature on health performance by
emphasizing that the change in health attainment over time is not an appropriate measure of health improvement and by underlining the strengths of the improvement indices. We also extend the work of Kakwani (Kakwani 1993) by using a more comprehensive definition of health attainment that takes health disparities into account in addition to the mean health level. Moreover, we also complement the work of Wagstaff (Wagstaff 2002). This author focuses on health achievement and suggests an achievement index that depends on the average health level and on the level of social health inequalities. His index is not bounded and is not invariant to linear changes in the health variable. In contrast, we focus on both achievement and improvement indices, our indices are normalized to lie between 0 and 1, and they satisfy an invariance property. In the empirical part, we focus on Asia, which is the fastest growing economic region, and we thus contribute to the literature by investigating whether growth has led to improvements
5
in health. Another novelty of our paper is that we examine whether countries are able to make progress on several dimensions of health at the same time.
Our findings indicate that most countries are making progress in child and
maternal health, whereas some countries are going backward. Our results on achievement and improvement are rather similar across definitions of attainment, and the choice of the Kakwani’s index or of our new indices only slightly affects the ranking of countries. This means that in our sample, the choice of the attainment definition does not really matter, because countries which are good at achieving high average health levels are also successful in reducing inequalities and in improving the health of the poor. Finally, our results indicate that countries do not make progress on all dimensions of health at the same time.
The paper is organized as follows. Section 2 shows that measuring improvement using the change in attainment over time is not satisfactory and presents shortly
Kakwani’s improvement and achievement indices (Kakwani 1993). It then extends these indices to account for the distribution of health in the population. Section 3 presents our data on child and maternal health in Asia since the beginning of the twenty-first century. Section 4 contains the results on achievement and improvement in our set of countries. Last, Section 5 discusses the method and results.
2. Attainment, improvement and achievement: Definitions and extensions
2.1. Improvement and change in health attainment
To assess the progress in health that has been made by a country, most studies quantify health improvement using the change in health attainment over time.3 However, the change in health attainment is not a good measure of a country’s improvement.
Following Kakwani (Kakwani 1993), we use an example to explain why. We suppose that the health attainment we are interested in is the mean infant survival. We assume that in country A, health attainment increases from 0.90 (which means that 90%
3 For instance, one of the official indicators of MDG4 is the infant mortality rate, which is the average of mortality in the population. All other official indicators of health goals are also averages (Wagstaff et al. 2014). They do not account for inequalities in health in the population.
6
of infants are alive at age 1) at date 1 to 0.91 at date 2, whereas in country B, it increases from 0.98 to 0.99.
On the one hand, consider that we want to measure improvement in survival using the absolute change in health attainment between dates 1 and 2, which equals the
difference between attainment at date 2 and attainment at date 1. In that case, the improvement in country A will be the same as in country B. But, like Sen (Sen 1981) says, it is harder to increase survival from 0.98 to 0.99 than from 0.90 to 0.91, and consequently the absolute difference is not a good index of improvement.
On the other hand, consider now that we want to quantify improvement using the
relative change in attainment, which equals the change in attainment over time divided
by attainment at date 1. Then improvement in country A will be greater than in country B, which is the opposite of what we believe.
This example highlights that to quantify improvement, looking at the change in health attainment over time may not be appropriate, and it is necessary to use specific improvement indices which satisfy a number of properties. In particular, these indices should account for the fact that increasing health attainment becomes more difficult as the initial level of health attainment is greater. We present such indices in what follows.
2.2. Definition of the improvement and achievement indices
Let x represent some index of health attainment (such as infant survival) with
min
B and Bmax the lower and upper bounds ofx . Suppose now that x increases from
1
x tox . Kakwani (1993) defines an improvement index 2 QQ(x1,x2,Bmin,Bmax), which measures a country’s improvement, with
r r r B B x B x B B B x x Q 1 min max 1 2 max 1 1 max max min 2 1 ) ( ) ( ) ( ) , , , ( for 0r1 (1) and ) log( ) log( ) log( ) , , , ( min max 2 max 1 max max min 2 1 B B x B x B B B x x Q for r 1 (2)
7
Kakwani (1993) and Majumder and Chakravarty (1996a) discuss the axioms that improvement indices should obey; in particular, index (2) does not satisfy two important axioms (see Appendix A), so we do not use it in the rest of this study.
In expression (1), given the levels of attainment x and1 x , when r increases, the 2
improvement index Qdecreases. More importantly, in expression (1), the r parameter captures a value judgment regarding upward sensitivity. As rincreases, upward
sensitivity strengthens. In other words, as r rises, the increase in Q resulting from a given increase in attainment becomes larger.
Note also that in the particular case where x is assumed to be identical to 1 Bmin, index (1) is expressed as r r r r r B B x B B B x B B B B B x B Q 1 min max 1 2 max 1 min max 1 2 max 1 min max max min 2 min ) ( ) ( 1 ) ( ) ( ) ( ) , , , ( (3)
so that we obtain the definition of what Kakwani calls an “achievement index,” in this case the value of the achievement index corresponding to an attainment ofx . 2
2.3. Extensions of the definitions of attainment, improvement, and achievement
For Kakwani (1993), overall attainment in health in a country is captured by the mean of a health indicator in that country. Indeed, in expressions (1) and (3), the level of attainment x from which improvement and achievement indices are derived is assumed
to be equal to some average, like the proportion of children who received full immunization.
However, we could also use other definitions of attainment that would reflect different value judgments. In particular, overall attainment can be thought of as reflecting the mean of the health indicator but also the inequality in the distribution of the health indicator within the population in the country. This approach is only feasible if data on health indicators are available by population subgroups, defined by their socioeconomic position (such as wealth quintiles or educational levels) for instance, and if there is some inequality in the levels of the health indicators between the different population
8
subgroups. In that case, we can apply Kolm’s (Kolm 1969) concept of “equal equivalent” which Atkinson (Atkinson 1970) called “equally distributed equivalent level.” The idea is to assume a social welfare function which depends on the health indicator (e.g. the
proportion of children who received full immunization) and compute the attainment level
x
~ which if reached by every population subgroup would give the same level of social welfare as the one presently reached with unequal attainment levels among the population subgroups. Following Atkinson4 x~ would be defined as
(4)
where G is an index measuring univariate inequality in health between the population
subgroups and is the (arithmetic) mean value of the health variable. For instance,
G could be the Gini coefficient or the Atkinson index.
This definition of attainment focuses on overall inequalities in health. However, given the concern about health disparities between the poor and the better-off, attainment could also depend on social health inequalities rather than on overall health inequalities (Wagstaff & Van Doorslaer 2004). To this end, we follow the same approach as before, but use a bivariate inequality index in the level of health attainment and socioeconomic status. x~ is now defined as
) 1 (
~x x C (5)
where C denotes an inequality index in health and socioeconomic status. For instance, this index could be the standard or the extended concentration index. These indices measure the deviation of the cumulative distribution of health-related attainment ranked
4 Atkinson (1970) defines inequality as
x x I EDE
1 that is to say 1 minus the ratio of the equally distributed equivalent level of the attribute to its mean. This amounts to writing xEDE x(1I) which is similar to equation (4).
9
by the socioeconomic characteristic from a perfectly equal distribution.5 They both measure social inequalities in the entire population. In theory, concentration indices lie between -1 (social health inequalities favoring low-SES individuals) and 1 (inequalities favoring high-SES individuals), and consequently x~ will vary between 0 and x2 . This means that may be higher than that is that, as a whole, some health indicator may be higher, the lower the income.6 In empirical work, data analysis generally indicates that social health inequalities favor high-SES individuals, so that concentration indices generally lie between 0 and 1, which implies that ~ is smaller than x
In equations (4) and (5), several combinations of the average level of health and health inequality will result in the same level of health attainment. This means that a higher level of attainment can be reached either by improving the mean health level or by decreasing the level of overall or social health inequalities.
Finally, in our last approach, we follow Rawls (Rawls 1971) and focus on the well-being of the poor. We define attainment as the health level xpoor reached by the population subgroup with the lowest socioeconomic status (poorest wealth quintile):
poor
x x
~ (6)
Note that in that case, the attainment does not depend on the health of the entire population, in contrast with (4) and (5). This approach enables us to examine whether achievements and improvement have been pro-poor.
5 The extended concentration index is derived from the extended Gini coefficient (Yitzhaki 1983). It includes a parameter that captures the extent of aversion to inequality and represents the weight attached to the poor (Wagstaff 2002). When this parameter is set to 2, the extended concentration index equals the concentration index. The recent literature has suggested and discussed several refinements to the
concentration index (Erreygers 2009; Wagstaff 2009). Note that polarization measures could also be used (Apouey 2010).
6 Equation (5) takes a bivariate approach to inequality measurement. The welfare function is then expressed as where refers to some health indicator and to income. The most reasonable assumption is that the partial derivatives of have the following signs: ;
10
These alternative definitions x~ of the level of attainment can then be inserted in
the definitions given in expression (1) for the improvement index as well as in expression (3) for the achievement index:
r r r B B x B x B B B x x Q 1 min max 1 2 max 1 1 max max min 2 1 ) ( ) ~ ( ) ~ ( ) , , ~ , ~ ( for 0r1 (7) r r B B x B B B x B Q 1 min max 1 max max min min ) ( ) ~ ( 1 ) , , ~ , ( (8)
Our new indices satisfy the axioms listed in Appendix A. In index (8), when attainment equals x(1G)orx(1C), achievement increases at a decreasing rate when inequality weakens, holding the average health level positive and constant.7
Our approach is different from that of Wagstaff (Wagstaff 2002). This author focuses on achievement only and argues that achievement should reflect both the average level of health and inequality in health. He suggests using the following achievement index: ) 1 ( ) (x x EC QW (9)
where xis the average health level and EC represents the extended concentration index that quantifies social health inequalities. Note thatQ does not satisfy the invariance W
axiom. Moreover Q has no bound, because x can take any value ( EC lies in the W [1,1]
interval by definition).8
In contrast, our article examines both achievement and improvement in health. Second, we argue that attainment (and not achievement) should reflect both the average
7 This is because the first derivative of achievement with respect to inequality is negative whereas the second derivative is positive.
8 But if xis normalized between 0 and 1, thenQW(x)
will be in the [1,1] interval. Note also that )
(x
11
level of health and inequality. Third, our achievement index satisfies the invariance axiom. Finally, our achievement index is always in the [0,1] interval, by construction.
3. Data and empirical strategy
3.1. Data
In the empirical analysis, we use data from the Health Equity Monitor Database of the World Health Organization. They are derived from the Demographic and Health Surveys (DHS) and Multiple Cluster Indicator Surveys (MICS).9 We focus on Asia and selected countries for which data were available for relatively close years. The set of countries we use depends on the indicator of interest. Since we concentrate our attention on the twenty-first century, data are available for the following countries (though not for all the indicators): Armenia, Bangladesh, Cambodia, Indonesia, Kazakhstan, Maldives, Nepal, Pakistan, Philippines, Timor-Leste, and Vietnam.
Our indicators of interest are related to the health status of children on the one hand and to access to health care of children and women (i.e. health interventions) on the other hand. The child health status variables capture survival and nutritional
anthropometry: they are the survival rate of infants (i.e. children before the age of one), the survival rate of children under the age of 5, the share of children under 5 who are not underweight, and the share of children under 5 who are not stunting. Note that
underweight is a general measure of nutritional status, whereas stunting, which refers to low stature for age, reflects chronic malnutrition.
The access to health care measures are the following: the percentage of women whose delivery was attended by skilled health personnel (over the three years preceding the survey), and the share of children who at age 1 had received full immunization (i.e. BCG, Diphteria tetanus toxoid and pertussis (DTP3), Measles (MCV), and Polio (Pol3) coverage). Note again that these indicators are not always available for all countries.
12
For each country and year, the Database provides the distribution of the attainment indicators by wealth quintile. These wealth quintiles are constructed by a principal component analysis using a number of household indicators describing
household ownership of consumer items. The scores on the first principal component are used to create the quintiles.
3.2. Empirical strategy
In what follows, we use the Gini coefficient as our index of overall health inequalities, and the concentration index as our index of social health inequalities. Our data presents the distribution of health attainment by wealth quintiles. Note that within each country, the health attainments of wealthier groups are not necessarily greater than those of poorer groups. In particular, we noticed that in some countries, the health indicators in the fourth wealth quintile are greater than those in the fifth quintile. For this reason, the ranking of the population groups according to health attainments is different from the ranking according to wealth quintiles. When we compute the Gini index, we rank the population groups according to their health attainment, whereas when we focus on the concentration index, we rank the groups according to the wealth quintiles.
Since we use grouped data by wealth quintiles, we compute the Gini and the concentration indices using mathematical formulas which are slightly different from the original ones as they involve the midpoint of each group interval (Lerman & Yitzhaki 1984; Wagstaff 2002). Details about the computation of the inequality indices are given in Appendix B.
When we compute achievement and improvement indices using the average health level, the Gini coefficient, or the health of the poor, the bounds Bmin and Bmax of attainment are set to0 and1. This is due to the fact that the mean of the health indicator and the Gini coefficient are both in the [0,1] interval. But when we use the concentration index, the bounds Bmin and Bmax equal 1 and 1, because the mean of the health
13
Note also that the achievement and improvement indices in equations (1), (3), (7), and (8) depend on a parameterr. In what follows, we setr0.5. Although the value of the achievement index depends on the value ofr, the ranking of countries with respect to the achievement index is independent of r . In contrast, the choice of r may affect the ranking of countries with respect to improvement. For this reason, we also experiment with other values of r (see the sensitivity analysis below).
Finally, when we use improvement indices, we verify that the CO axiom (see Appendix A for more details on this axiom) is satisfied. The axiom is always satisfied when we focus on child health in Table 3, but there are cases in which it is not satisfied when we focus on access to health care in Table 4 (see below).
4. Results
4.1. Achievement in child and maternal health and access to health care in Asia
First, we apply the four definitions of attainment to compute the indices of achievement in child health. For each country of interest, we only use the most recent year of data. The results are given in Table 1. Columns (1) to (4) contain the average health levelx, the Gini coefficient G , the concentration index C , and the health level in the first wealth quintilexpoor. Column (5) contains the Kakwani achievement index, which uses the average health level in the population; column (6), the achievement index when we employ equivalent attainment using the Gini index; column (7), the index when we use equivalent attainment depending on the concentration index; and column (8), the index when we focus on the health of the poor. For each index, we also indicate the ranking of countries in descending order, so that the country with rank 1 is the best achiever.
Panel A contains the results for infant survival. The average survival is the lowest in Pakistan, since only 90.8% of children reach their first birthday, and the largest in Armenia, where the share equals 97.9%.
The Gini and the concentration indices are positive in all countries, indicating the presence of significant overall and social health inequalities. Inequalities are relatively
14
high in Cambodia and Pakistan, but small in Armenia and Maldives. Because the Gini and the concentration indices are always positive, indices that use the Gini index and concentration index in columns (6) and (7) are smaller than the Kakwani index in column (5). Moreover, the Gini is generally equal to the concentration index, because our wealth variable only has five categories (the wealth quintiles) and the survival rate generally increases with household wealth. This implies that the achievement index that uses the Gini coefficient and the associated ranking in column (6) is often similar to the index that uses the concentration index and its ranking in column (7). If we were to use wealth data with a larger number of categories, it is likely that the Gini index would be more often different from the concentration index.
In each country, the health level in the first wealth quintile is less than that of the whole population on average. As a consequence, the index that uses the health of the poor in column (8) is less than the Kakwani index in column (5).
There is a wide variation in achievement between countries. Pakistan has a low level of achievement in infant survival. In contrast, Armenia and Maldives stand as high achievers.
The rankings of countries by achievement levels are rather similar (but not exactly similar) across attainment definitions in columns (5) to (8). For instance, in all columns, Pakistan always ranks 9, whereas Armenia always ranks 1. This is due to the fact that countries that achieve a high level of infant survival on average also exhibit low levels of inequalities and relatively high levels of survival among the poor.
However the ranking of countries by achievements levels is not exactly the same across columns, since we observe some small discrepancies. The definition of attainment does make a (small) difference when describing countries’ relative performances.
Panel B focuses on the survival rate of children under 5. Again, achievement in Pakistan seems to be low, whereas it is high in Armenia and Maldives. Again, it seems that countries which are successful in attaining high levels of child survival also reach small level of inequalities, which imply that the ranking of countries remain very stable across columns. But we still find some discrepancies in achievement depending on the index that is used: while the achievement indices based on the average survival, on the
15
Gini, and on the concentration index all indicate that Bangladesh ranks 5, the index that uses the health of the poor shows that it ranks 7.
Panels C and D contain the findings on nutritional status. Achievements with respect to underweight and stunting are rather low in Timor-Leste, but they are high in Kazakhstan. Like in the top panels of the table, the ranking of countries with respect to achievement look rather similar across columns, with some minor differences though.
[Insert Table 1 here]
Table 1 highlights that the achievement index using the Gini and the
concentration indices are very similar. For this reason, we do not report the results based on the Gini index in what follows.
Table 2 reports the results on achievement in access to health care. In Armenia and Maldives, the performance concerning births attended by skilled health staff and child immunization is better than in other countries. On the other side of the spectrum, Timor-Leste seems to have low levels of achievements in the two dimensions of access to health care. Vietnam also has a low achievement in child immunization. The ranking of countries is rather similar across columns. We still find minor changes that indicate that the choice of the attainment measure still matters.
[Insert Table 2 here]
For each health indicator (infant survival, child survival, not underweight, not stunting, birth attended by skilled personnel, child full immunization), we compute the correlation coefficients between the achievement indices. We do not report these results for space reasons. These correlation coefficients are high and larger than 0.90. This suggests that when assessing performance using achievement indices, using the Kakwani achievement index or one of our three achievement measure makes only little difference in our sample of countries (because countries that attain a high level of health on average also reach a low level of inequalities).
16
4.2. Improvement in child and maternal health and access to health care in Asia
Improvement indices for child health are presented in Table 3. These
improvement measures capture the difference between the achievement indices in two sub-periods, namely “1st year” and “2nd year.” Columns (1) to (6) contain the average health level, the Gini coefficient, the concentration index, and the health level of the poor, in the two years of interest. Column (7) contains the Kakwani improvement index, which uses the average health level in the population; column (8), the improvement index when we use the concentration index; and column (9), the index when we focus on the health of the poor.
In contrast with achievement indices, improvement indices can take negative values, because health attainments can decrease over time. Note also that the
improvement index that is based on the health of the poor in column (9) is sometimes larger than the Kakwani index which uses the average health level in column (7), because the health of the poor may improve faster than that of the whole population on average. This is the case for Armenia in Panel A.
The table shows that performance in infant and child survival has sharply improved in Cambodia, whereas it has only slightly increased or even decreased in Pakistan. Large improvements in child nutrition are observed in Nepal, while there is some evidence that performance in nutrition has decreased in Armenia.
Like for the achievement indices, the ranking of countries is relatively stable across improvement indices, though it is not exactly the same: for instance, Bangladesh ranks 4 with respect to improvement in infant survival according to the Kakwani index, but 6 according to the index that accounts for the health of the poor.
More importantly, we observe that in some cases, some improvement indices indicate that there was an improvement over time whereas others suggest the exact contrary. For example, in Panels A and B for Pakistan, columns (7) and (8) show that infant and child survival deteriorated over time, whereas column (9) suggests an
improvement. Taken together, these results highlight that different improvement indices can lead to opposite conclusions, which implies that the choice of the improvement index is important.
17
[Insert Table 3 here]
Improvement results concerning access to health care can be found in Table 4. In this table there are cases in which the CO axiom is not satisfied (see Appendix A for more details on this concept). We underline those cases in the table. Since this CO axiom is not satisfied in many occurrences, we do not comment on these results.
[Insert Table 4 here]
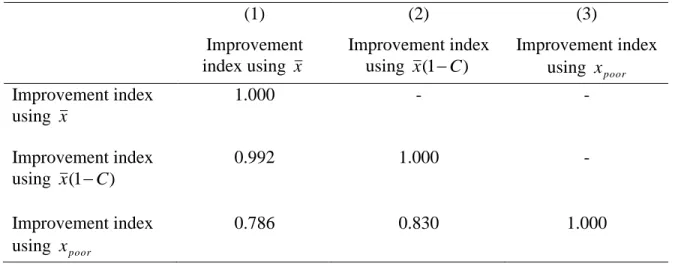
Like for the achievement index, we compute the correlations between the improvement indices. Table 5 reports the results for infant survival (the results for the other health indicators are available upon request from the authors). Although the correlation is generally high, the correlation between indices is not perfect. In particular, the correlation between the Kakwani index and the index that uses the health of the poor is 0.786. This result emphasizes that the three improvement indices are not exactly similar and thus not interchangeable. Consequently, when analyzing improvement, one needs to choose an index depending on one’s value judgments, and be aware that employing other improvement indices may lead to slightly different conclusions.
[Insert Table 5 here]
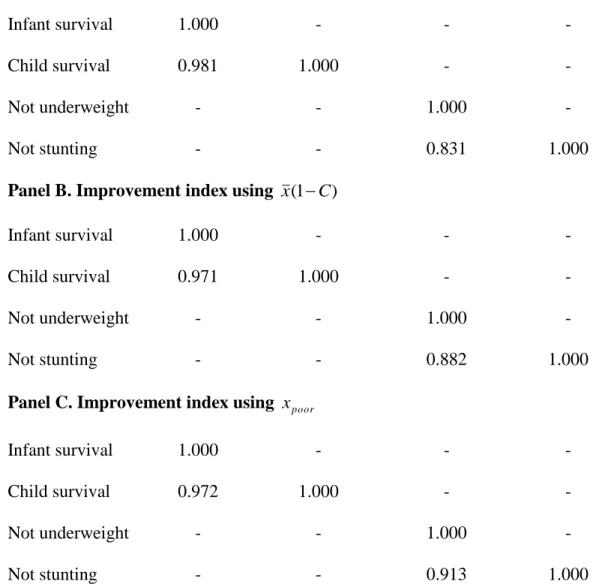
Finally, we compare improvement in several health dimensions. Because the comparability axiom is not always satisfied for the indicators of access to health care, we only focus on the variables related to child health. The results are presented in Table 6. Our data concern the years available from the Health Equity Monitor Database. In Panel A, we use the improvement index based on the mean, in Panel B the index based on the concentration index, and in Panel C the index based on the attainment of the poor. In all panels, there is a high degree of correlation between the improvement indices derived from infant and child mortality and a relatively high correlation between the
18
[Insert Table 6 here]
4.3. Sensitivity analysis
So far, the rparameter has been set to 50 . The choice of this parameter is not . really important for the achievement index (because a change in r has no impact on the ranking of countries by achievement indices), but it matters for the improvement index (r captures the degree of upward sensitivity of the improvement index, and it can affect the ranking of countries). We now experiment with other values of r (0 and 9.1 0. ) in the improvement indices, to investigate the sensitivity of our results.
In Appendix C, Table C1, we report improvement indices in infant survival when
requals 0 in Panel A, 5.1 0 in Panel B (this panel is similar to Panel A in Table 3), and . 9
.
0 in Panel C. Results for other health indicators are available upon request from the authors. Within each panel, the ranking of countries across columns is somewhat similar. But within each column, the ranking of countries across panels is really different. For instance, in Panel A, when r = 0.1, the Kakwani index indicates that Armenia ranks 4, whereas in Panel C, when r = 0.9, the index shows that the country ranks 2. In addition, in Panel A, when r = 0.1, the index that depends on the concentration index shows that Armenia ranks 4, whereas in Panel B, when r = 0.5, the same index suggests that the country ranks 2. Taken together, these examples highlight the fact that the value of rmay have an influence on the ranking of countries.
Table C2 reports the correlation coefficients between our improvement indices depending on r . The correlation coefficient between the Kakwani index and the index derived from the health of the poor is not perfect, since it is between 0.786 and 0.884 depending on the panel. This suggests that the three improvement indices that depend on the mean health level, on the concentration index, and on the health of the poor, are never perfectly correlated in empirical work, not only when r is set to 0.5, but more generally for any value of r.
19
In this paper, we try to go beyond the kind of health statistics that are generally used to assess the performance of countries in the health domain. Specifically, many studies assume that the mean of a health outcome is an appropriate measure of health attainment, and quantify improvement in health using the absolute or the relative change of health attainment over time. We argue that this approach is not satisfactory for two reasons: on the one hand, the change in health outcomes over time does not account for the fact that it is harder to improve health attainment when the health attainment level is initially greater; and on the other hand, health attainment should include health disparities in the population in addition to the mean health level. Following the work of Kakwani (Kakwani 1993), we suggest to use achievement and improvement indices that have “good” properties -- in particular they satisfy an upward sensitivity axiom that allows the change in health attainment at the top of the health attainment distribution to increase the improvement index more than the same absolute change at the bottom of the health attainment distribution. We then extend this approach to allow health attainment to depend on the distribution of health in the population in addition to the mean health level. More precisely, we account for univariate and bivariate health inequalities and for the health of the poor.
Our empirical study of several Asian countries in the twenty-first century shows that Pakistan has low levels of achievements of infant and child survival. This is
explained by the low survival rate (in our data, the infant and child mortality rates are the highest in this country), but also by the high level of inequalities between population groups. The low survival rate may itself be related to young maternal age and short interval between pregnancies. Indeed, a recent study that uses DHS data for 2012 shows that these factors explain more than 20% of infant deaths in these two countries (Raj et al. 2014). We also find that Bangladesh, Pakistan, and Timor-Leste exhibit low levels of achievement in child nutritional status.
In our sample of Asian countries, the various achievement and improvement indices produce very similar ranking of countries and exhibit high levels of correlation. This is due to the fact that countries that achieve high levels of health are also successful in maintaining low levels of inequalities and high levels of health among the poor in our sample. However, neither the ranking of countries is exactly the same across indices, nor
20
the correlation is perfect between indices. This means that the definition of attainment matters and may affect the conclusion regarding the performance of countries. In other words, attainment measures are not interchangeable in empirical work. For this reason, it seems to us that empirical studies need to justify their choice of preferred measure of attainment.
Finally, our results highlight that infant and child survival improve at the same time. Similarly, progress in “not underweight” and “not stunting” goes hand in hand.
Our study could be extended in several manners. Our empirical analysis focuses on Asian countries. However, child death and malnutrition not only clusters in (South-East) Asia, but also in (sub-Saharan) Africa (Van de Poel et al. 2008). Consequently, it would be worth re-analyzing achievement and improvement in child health using data on more developing countries. In addition, due to data limitation, our study does not cover the exact same period for the different Asian countries. When new data become available, it will be worth re-analyzing performance in child and maternal health using the same survey years for all countries.
In our methodological approach, we revisit Kakwani’s achievement and improvement indices to make performance sensitive to the inequality in the distribution of health. However, other indices are available and future work may be interested in revisiting these indices as well. For instance, Permanyer (forthcoming) develops a family of achievement improvement indices and a family of shortfall improvement indices, after arguing that one can either focus on achievements of shortfalls when measuring improvements.10
In addition, we focus on one single dimension of well-being (health) -- except when we use the concentration index -- and our approach could be extended to account for the many attributes of well-being (Abul Naga & Geoffard, 2006; Decancq & Lugo, 2013; Seth, 2013; Zhong, 2009). Ideally, one should take into account not only the average level of the attributes, but also the level of inequality in the distribution of the attributes and the association between the attributes.
10 The author shows that the only case in which his achievement improvement index and shortfall improvement index rank social states in a consistent way is when both indices are equal, which corresponds to the case when the upward sensitivity axiom is not satisfied. In other words, the upward sensitivity axiom is at odds with the consistency of rankings between achievement and shortfall improvement indices. Note that Kakwani’s index satisfies upward sensitivity, but not this consistency property.
21
Moreover, we focus on achievement and improvement in cardinal health variables, but a recent literature highlights the role of ordinal health variables and suggests dispersion measures that are appropriate for this type of outcomes (Abul Naga & Yalcin 2007; Apouey 2007; Apouey & Silber 2013; Kobus & Miłoś 2012; Lazar & Silber 2013). It is an open question whether achievement and improvement indices for ordinal health variables could also be developed.
This paper suggests three alternative definitions of attainment, based on the Gini coefficient, the concentration index, and the health of the poor. Future studies may want to refine these definitions. For instance, in the definition of attainment that accounts for the average health level and health inequalities, it might be interesting to give different weights to the average attainment and to the inequality index, to capture different value judgments.11 Moreover, one may be interested in using different inequality indices in the definition of attainment, instead of the concentration index. The concentration index embodies a “rightist” view of equity, since it is invariant to equal relative changes in health. However, “leftist” measures (which are invariant to equal absolute changes in health), “extreme rightist,” and “extreme leftist” measures are also available (Allanson & Petrie 2014). Finally, further research is needed to reach an appropriate definition of health attainment. To this end, more empirical work is necessary to explore peoples’ preferences over distributions of health.
Conflict of interest: None declared.
Ethical approval: For this type of study formal consent is not required.
This article does not contain any studies with human participants performed by any of the authors.
11 The idea is to replace attainment levelsx(1C) and x(1G) with x(1C) and x(1G). When 1and 0, attainment is the average health level, like in (Kakwani 1993), whereas when
1
22 References
Abul Naga, R.H. & Geoffard, P.-Y., 2006. Decomposition of bivariate inequality indices by attributes. Economics Letters, 90(3), pp. 362-637.
Abul Naga, R.H. & Yalcin, T., 2007. Inequality measurement for ordered response health data. Journal of Health Economics, 27(6), pp.1614–1625.
Allanson, P. & Petrie, D., 2014. Understanding the vertical equity judgements
underpinning health inequality measures. Health Economics, 23(11), pp.1390–1396.
Apouey, B., 2007. Measuring health polarization with self-assessed health data. Health
Economics, 16(9), pp.875–894.
Apouey, B., 2010. On measuring and explaining socioeconomic polarization in health with an application to French data. Review of Income and Wealth, 56(1), pp.141– 170.
Apouey, B. & Silber, J., 2013. Inequality and bi-polarization in socioeconomic status and health: ordinal approaches. In P. Rosa Dias & O. O’Donnell (Eds). Health and
Inequality. Bingley, UK: Emerald Group Publishing Limited.
Atkinson, A.B., 1970. On the measurement of inequality. Journal of Economic Theory, 2(3), pp.244–263.
Decancq, K. & Lugo, M. A., 2013. Weights in multidimensional indices of wellbeing: An overview. Econometric Reviews, 32(1); pp.7-34.
Erreygers, G., 2009. Correcting the concentration index. Journal of Health Economics, 28(2), pp.504–515.
Gwatkin, D.R., 2005. How much would poor people gain from faster progress towards the Millenium Development Goals for health? The Lancet, 365(9461), pp.813–817.
Kakwani, N., 1993. Performance in living standards: An international comparison.
Journal of Development Economics, 41(2), pp.307–336.
Kakwani, N.C., Wagstaff, A. & Van Doorslaer, E., 1997. Socio-economic inequalities in health: Measurement, computation and statistical inference. Journal of
Econometrics, 77(1), pp.87–104.
Kobus, M. & Miłoś, P., 2012. Inequality decomposition by population subgroups for ordinal data. Journal of Health Economics, 31(1), pp.15–21.
23
Kolm, S.-C., 1969. The optimal production of social justice. In H. Guitton & J. Margolis, eds. Public Economics. London, pp. 145–200.
Lazar, A. & Silber, J., 2013. On the cardinal measurement of health inequality when only ordinal information is available on individual health status. Health Economics, 22(1), pp.106–113.
Lerman, R.I. & Yitzhaki, S., 1984. A note on the calculation and interpretation of the Gini index. Economics Letters, 15, pp.363–368.
Majumder, A. & Chakravarty, S.R., 1996a. Achievement and improvement in living standards. Journal of Development Economics, 50, pp.189–195.
Majumder, A. & Chakravarty, S.R., 1996b. Achievement and improvement in living standards: An empirical analysis. Social Indicators Research, 37(3), pp.269–280.
Meheus, F. & Van Doorslaer, E., 2008. Achieving better measles immunization in developing countries: Does higher coverage imply lower inequality? Social Science
& Medicine, 66, pp.1709–1718.
OECD & WHO, 2003. DAC guidelines and reference series. Poverty and health. Paris, France: OECD Publishing.
Permanyer I, forthcoming. Measuring achievement and shortfall improvements in a consistent way. Review of Income and Wealth.
Raj, A., McDougal, L. & Rusch, M.L.A., 2014. Effects of young maternal age and short interpregnancy interval on infant mortality in South Asia. International Journal of
Gynecology & Obstetrics, 124(1), pp.86–87.
Rawls, J., 1971. A theory of justice, Cambridge, Massachussets: Harvard University Press.
Sen, A., 1981. Public action and the quality of life in developing countries. Oxford
Bulletin of Economics and Statistics, 43, pp.287–319.
Sen, A.K., 1985. Comodities and capabilities, Amsterdam: North Holland.
Sen, A.K., 1992. Inequality reexamined, Harvard University Press.
Sen, A.K., 1987. The standard of living. G. Hawthorn (Ed.). Cambridge, London, New York: Cambridge University Press.
Seth, S., 2013. A class of distribution and association sensitive multidimensional welfare indices. Journal of Economic Inequality, 11(2), pp.133–162.
24
Suzuki, E., Sharan, M. & Bos, E., 2012. Poverty and Health Monitornig Report, Washington DC.
Van de Poel, E., Hosseinpoor, A. R., Speybroeck, N., Van Ourti, T., & Vega, J. (2008). Socioeconomic inequality in malnutrition in developing countries. Bulletin of the World Health Organization, 86(4), 282291.
Wagstaff, A., 2009. Correcting the concentration index: A comment. Journal of Health
Economics, 28, pp.516–520.
Wagstaff, A., 2002. Inequality aversion, health inequalities, and health achievement.
Journal of Health Economics, 21(4), pp.627–641.
Wagstaff, A., Bredenkamp, C. & Buisman, L.R., 2014. Progress toward the health MDGs. Are the poor being left behind? World Bank, Policy research working paper 6894.
Wagstaff, A. & Van Doorslaer, E., 2004. Overall versus socioeconomic health inequality: A measurement framework and two empirical illustrations. Health Economics, 13(3), pp.297–301.
Yitzhaki, S., 1983. On an extension of the Gini index. International Economic Review, 24(3), pp.617–628.
Zhong, H., 2009. A multivariate analysis of the distribution of individual's welfare in China: What is the role of health? Journal of Health Economics, 28(6), pp.1062–
25
Table 1. Achievement indices for child health
(1) (2) (3) (4) (5) (6) (7) (8)
Country Year x G C
poor
x Achievement index using
x Achievement index using ) 1 ( G x Achievement index using ) 1 ( C x Achievement index using poor x
Panel A. Infant survival
Armenia 2010 0.979 0.003 0.002 0.974 0.853 1 0.843 1 0.892 1 0.840 1 Bangladesh 2011 0.938 0.008 0.008 0.922 0.752 6 0.736 6 0.814 6 0.721 6 Cambodia 2010 0.936 0.013 0.013 0.909 0.748 7 0.724 7 0.805 7 0.699 8 Indonesia 2012 0.959 0.009 0.009 0.930 0.796 4 0.777 4 0.842 4 0.736 4 Maldives 2009 0.974 0.003 0.002 0.972 0.838 2 0.828 2 0.880 2 0.832 2 Nepal 2011 0.940 0.007 0.007 0.926 0.755 5 0.742 5 0.817 5 0.727 5 Pakistan 2012 0.908 0.015 0.015 0.882 0.696 9 0.674 9 0.770 9 0.657 9 Philippines 2008 0.966 0.008 0.008 0.941 0.814 3 0.795 3 0.855 3 0.758 3 T.-Leste 2009 0.920 0.008 0.007 0.913 0.717 8 0.705 8 0.792 8 0.705 7
Panel B. Child survival
Armenia 2010 0.982 0.002 0.001 0.979 0.864 1 0.858 1 0.902 1 0.855 1 Bangladesh 2011 0.951 0.007 0.007 0.938 0.780 5 0.766 5 0.834 5 0.751 7 Cambodia 2010 0.946 0.012 0.012 0.923 0.768 7 0.745 8 0.820 8 0.723 8 Indonesia 2012 0.967 0.006 0.006 0.948 0.819 4 0.803 4 0.861 4 0.772 4 Maldives 2009 0.978 0.002 0.001 0.979 0.851 2 0.843 2 0.892 2 0.854 2 Nepal 2011 0.948 0.005 0.005 0.939 0.773 6 0.763 6 0.832 6 0.754 5 Pakistan 2012 0.922 0.011 0.010 0.910 0.721 9 0.704 9 0.791 9 0.700 9 Philippines 2008 0.974 0.005 0.005 0.960 0.838 3 0.824 3 0.876 3 0.799 3 T.-Leste 2009 0.944 0.006 0.005 0.938 0.763 8 0.752 7 0.826 7 0.752 6
Panel C. Not underweight
Armenia 2010 0.953 0.013 0.013 0.920 0.783 2 0.756 2 0.828 2 0.717 2 Bangladesh 2011 0.648 0.091 0.091 0.497 0.407 8 0.359 8 0.547 8 0.291 9 Cambodia 2010 0.732 0.052 0.052 0.656 0.483 6 0.447 5 0.609 5 0.414 5 Kazakhstan 2010 0.964 0.003 0.001 0.959 0.809 1 0.803 1 0.863 1 0.798 1 Maldives 2009 0.832 0.033 0.033 0.759 0.590 4 0.558 4 0.687 4 0.509 4 Nepal 2011 0.735 0.077 0.077 0.596 0.485 5 0.432 6 0.599 6 0.365 6 Pakistan 2012 0.711 0.085 0.085 0.524 0.462 7 0.409 7 0.582 7 0.310 7 T.-Leste 2009 0.559 0.051 0.051 0.505 0.336 9 0.315 9 0.515 9 0.297 8 Vietnam 2010 0.885 0.037 0.034 0.794 0.661 3 0.616 3 0.731 3 0.546 3
Panel D. Not stunting
Armenia 2010 0.808 0.022 0.015 0.738 0.562 3 0.542 3 0.681 3 0.488 3 Bangladesh 2011 0.597 0.088 0.088 0.465 0.365 7 0.325 7 0.523 7 0.269 6 Cambodia 2010 0.624 0.083 0.083 0.506 0.387 5 0.346 5 0.537 5 0.297 5 Kazakhstan 2010 0.870 0.011 0.005 0.856 0.640 1 0.627 1 0.741 1 0.620 1 Maldives 2009 0.821 0.020 0.020 0.786 0.576 2 0.557 2 0.687 2 0.537 2 Nepal 2011 0.617 0.101 0.101 0.438 0.381 6 0.333 6 0.528 6 0.250 7 Pakistan 2012 0.563 0.136 0.136 0.381 0.339 8 0.284 8 0.494 8 0.213 8 T.-Leste 2009 0.424 0.080 0.077 0.374 0.241 9 0.219 9 0.448 9 0.209 9 Vietnam 2010 0.778 0.080 0.080 0.591 0.529 4 0.467 4 0.623 4 0.361 4
26
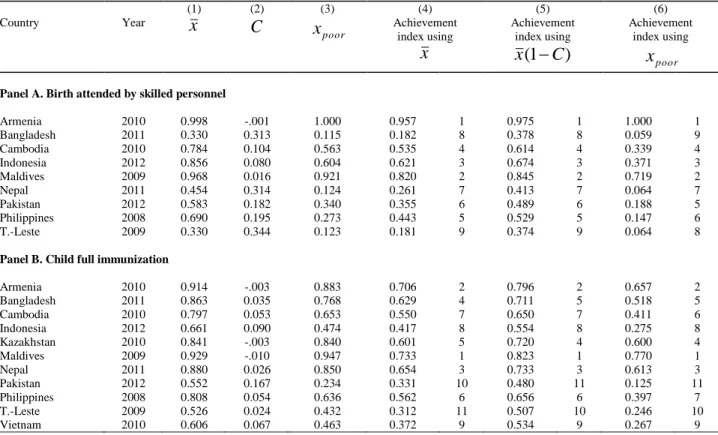
Table 2. Achievement indices for access to health care
(1) (2) (3) (4) (5) (6)
Country Year x C
poor
x Achievement index using
x Achievement index using ) 1 ( C x Achievement index using poor x
Panel A. Birth attended by skilled personnel
Armenia 2010 0.998 -.001 1.000 0.957 1 0.975 1 1.000 1 Bangladesh 2011 0.330 0.313 0.115 0.182 8 0.378 8 0.059 9 Cambodia 2010 0.784 0.104 0.563 0.535 4 0.614 4 0.339 4 Indonesia 2012 0.856 0.080 0.604 0.621 3 0.674 3 0.371 3 Maldives 2009 0.968 0.016 0.921 0.820 2 0.845 2 0.719 2 Nepal 2011 0.454 0.314 0.124 0.261 7 0.413 7 0.064 7 Pakistan 2012 0.583 0.182 0.340 0.355 6 0.489 6 0.188 5 Philippines 2008 0.690 0.195 0.273 0.443 5 0.529 5 0.147 6 T.-Leste 2009 0.330 0.344 0.123 0.181 9 0.374 9 0.064 8
Panel B. Child full immunization
Armenia 2010 0.914 -.003 0.883 0.706 2 0.796 2 0.657 2 Bangladesh 2011 0.863 0.035 0.768 0.629 4 0.711 5 0.518 5 Cambodia 2010 0.797 0.053 0.653 0.550 7 0.650 7 0.411 6 Indonesia 2012 0.661 0.090 0.474 0.417 8 0.554 8 0.275 8 Kazakhstan 2010 0.841 -.003 0.840 0.601 5 0.720 4 0.600 4 Maldives 2009 0.929 -.010 0.947 0.733 1 0.823 1 0.770 1 Nepal 2011 0.880 0.026 0.850 0.654 3 0.733 3 0.613 3 Pakistan 2012 0.552 0.167 0.234 0.331 10 0.480 11 0.125 11 Philippines 2008 0.808 0.054 0.636 0.562 6 0.656 6 0.397 7 T.-Leste 2009 0.526 0.024 0.432 0.312 11 0.507 10 0.246 10 Vietnam 2010 0.606 0.067 0.463 0.372 9 0.534 9 0.267 9
27
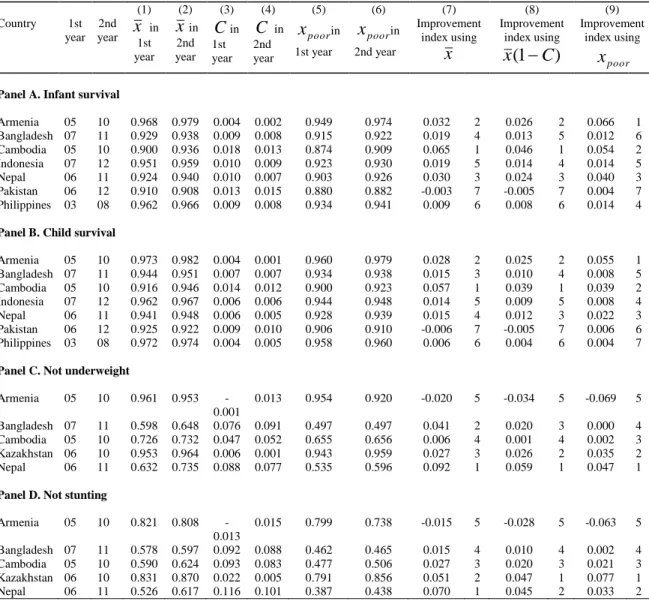
Table 3. Improvement indices for child health
(1) (2) (3) (4) (5) (6) (7) (8) (9) Country 1st year 2nd year x1st in year xin 2nd year Cin 1st year C in 2nd year poor x in 1st year poor x in 2nd year Improvement index using x Improvement index using ) 1 ( C x Improvement index using poor x
Panel A. Infant survival
Armenia 05 10 0.968 0.979 0.004 0.002 0.949 0.974 0.032 2 0.026 2 0.066 1 Bangladesh 07 11 0.929 0.938 0.009 0.008 0.915 0.922 0.019 4 0.013 5 0.012 6 Cambodia 05 10 0.900 0.936 0.018 0.013 0.874 0.909 0.065 1 0.046 1 0.054 2 Indonesia 07 12 0.951 0.959 0.010 0.009 0.923 0.930 0.019 5 0.014 4 0.014 5 Nepal 06 11 0.924 0.940 0.010 0.007 0.903 0.926 0.030 3 0.024 3 0.040 3 Pakistan 06 12 0.910 0.908 0.013 0.015 0.880 0.882 -0.003 7 -0.005 7 0.004 7 Philippines 03 08 0.962 0.966 0.009 0.008 0.934 0.941 0.009 6 0.008 6 0.014 4
Panel B. Child survival
Armenia 05 10 0.973 0.982 0.004 0.001 0.960 0.979 0.028 2 0.025 2 0.055 1 Bangladesh 07 11 0.944 0.951 0.007 0.007 0.934 0.938 0.015 3 0.010 4 0.008 5 Cambodia 05 10 0.916 0.946 0.014 0.012 0.900 0.923 0.057 1 0.039 1 0.039 2 Indonesia 07 12 0.962 0.967 0.006 0.006 0.944 0.948 0.014 5 0.009 5 0.008 4 Nepal 06 11 0.941 0.948 0.006 0.005 0.928 0.939 0.015 4 0.012 3 0.022 3 Pakistan 06 12 0.925 0.922 0.009 0.010 0.906 0.910 -0.006 7 -0.005 7 0.006 6 Philippines 03 08 0.972 0.974 0.004 0.005 0.958 0.960 0.006 6 0.004 6 0.004 7
Panel C. Not underweight
Armenia 05 10 0.961 0.953 -0.001 0.013 0.954 0.920 -0.020 5 -0.034 5 -0.069 5 Bangladesh 07 11 0.598 0.648 0.076 0.091 0.497 0.497 0.041 2 0.020 3 0.000 4 Cambodia 05 10 0.726 0.732 0.047 0.052 0.655 0.656 0.006 4 0.001 4 0.002 3 Kazakhstan 06 10 0.953 0.964 0.006 0.001 0.943 0.959 0.027 3 0.026 2 0.035 2 Nepal 06 11 0.632 0.735 0.088 0.077 0.535 0.596 0.092 1 0.059 1 0.047 1
Panel D. Not stunting
Armenia 05 10 0.821 0.808 -0.013 0.015 0.799 0.738 -0.015 5 -0.028 5 -0.063 5 Bangladesh 07 11 0.578 0.597 0.092 0.088 0.462 0.465 0.015 4 0.010 4 0.002 4 Cambodia 05 10 0.590 0.624 0.093 0.083 0.477 0.506 0.027 3 0.020 3 0.021 3 Kazakhstan 06 10 0.831 0.870 0.022 0.005 0.791 0.856 0.051 2 0.047 1 0.077 1 Nepal 06 11 0.526 0.617 0.116 0.101 0.387 0.438 0.070 1 0.045 2 0.033 2
28
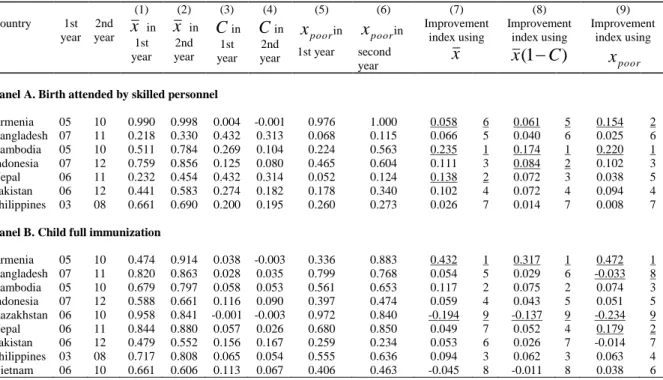
Table 4. Improvement indices for access to health care
(1) (2) (3) (4) (5) (6) (7) (8) (9) Country 1st year 2nd year x1st in year x in 2nd year Cin 1st year Cin 2nd year poor x in 1st year poor x in second year Improvement index using x Improvement index using ) 1 ( C x Improvement index using poor x
Panel A. Birth attended by skilled personnel
Armenia 05 10 0.990 0.998 0.004 -0.001 0.976 1.000 0.058 6 0.061 5 0.154 2 Bangladesh 07 11 0.218 0.330 0.432 0.313 0.068 0.115 0.066 5 0.040 6 0.025 6 Cambodia 05 10 0.511 0.784 0.269 0.104 0.224 0.563 0.235 1 0.174 1 0.220 1 Indonesia 07 12 0.759 0.856 0.125 0.080 0.465 0.604 0.111 3 0.084 2 0.102 3 Nepal 06 11 0.232 0.454 0.432 0.314 0.052 0.124 0.138 2 0.072 3 0.038 5 Pakistan 06 12 0.441 0.583 0.274 0.182 0.178 0.340 0.102 4 0.072 4 0.094 4 Philippines 03 08 0.661 0.690 0.200 0.195 0.260 0.273 0.026 7 0.014 7 0.008 7
Panel B. Child full immunization
Armenia 05 10 0.474 0.914 0.038 -0.003 0.336 0.883 0.432 1 0.317 1 0.472 1 Bangladesh 07 11 0.820 0.863 0.028 0.035 0.799 0.768 0.054 5 0.029 6 -0.033 8 Cambodia 05 10 0.679 0.797 0.058 0.053 0.561 0.653 0.117 2 0.075 2 0.074 3 Indonesia 07 12 0.588 0.661 0.116 0.090 0.397 0.474 0.059 4 0.043 5 0.051 5 Kazakhstan 06 10 0.958 0.841 -0.001 -0.003 0.972 0.840 -0.194 9 -0.137 9 -0.234 9 Nepal 06 11 0.844 0.880 0.057 0.026 0.680 0.850 0.049 7 0.052 4 0.179 2 Pakistan 06 12 0.479 0.552 0.156 0.167 0.259 0.234 0.053 6 0.026 7 -0.014 7 Philippines 03 08 0.717 0.808 0.065 0.054 0.555 0.636 0.094 3 0.062 3 0.063 4 Vietnam 06 10 0.661 0.606 0.113 0.067 0.406 0.463 -0.045 8 -0.011 8 0.038 6
Notes. We underline the cases in which the CO axiom is not satisfied (see Appendix A for more details on this axiom).
In Panel A, column (7), Armenia cannot be compared to Cambodia and Nepal; column (8), Armenia cannot be compared to Cambodia and Indonesia; column (9), Armenia cannot be compared to Cambodia.
In Panel B, column (7), Kazakhstan cannot be compared to Armenia; in column (8), Kazakhstan cannot be compared to Armenia; and column (9), Bangladesh cannot be compared to Armenia; Kazakhstan cannot be compared to Armenia and Nepal.
29
Table 5. The correlation between improvement indices for infant survival
(1) (2) (3) Improvement index using x Improvement index using x(1C) Improvement index using xpoor Improvement index using x 1.000 - - Improvement index using x(1C) 0.992 1.000 - Improvement index using xpoor 0.786 0.830 1.000
30
Table 6. Associations between improvement indices for child health
Infant survival Child survival Not underweight Not stunting
Panel A. Improvement index using x
Infant survival 1.000 - - -
Child survival 0.981 1.000 - -
Not underweight - - 1.000 -
Not stunting - - 0.831 1.000
Panel B. Improvement index using x(1C)
Infant survival 1.000 - - -
Child survival 0.971 1.000 - -
Not underweight - - 1.000 -
Not stunting - - 0.882 1.000
Panel C. Improvement index using xpoor
Infant survival 1.000 - - -
Child survival 0.972 1.000 - -
Not underweight - - 1.000 -
Not stunting - - 0.913 1.000
N.B. These correlations are computed on the basis of the countries for which data are available. Since the number of countries is not the same for infant and child survival on one hand, and for “not underweight” and “not stunting” on the other hand, we computed separate correlations, between infant and child survival indicators, and between “not underweight” and “not stunting” indicators.
31
Appendix A. The properties of the improvement and achievement indices
Remember that x represents some index of health attainment (such as infant
survival) with Bmin and Bmax the lower and upper bounds of x , and suppose that x
increases from x to1 x . When defining an improvement index 2 QQ(x1,x2,Bmin,Bmax), Kakwani (1993) assumes that Qshould obey the following axioms:12
(i) Range Subdivision (RS):
0 ) , , , ( 1 2 min max Q x x B B Q if x2 x1 0 ) , , , ( 1 2 min max Q x x B B Q if x2 x1 0 ) , , , ( 1 2 min max Q x x B B Q ifx2 x1.
(ii) Monotonicity (MO):
) , , , (x1 x2 Bmin Bmax Q
Q increases in x and decreases in 2 x . 1
(iii) Additivity (AD):
) , , , ( ) , , , ( ) , , ,
(x1 x3 Bmin Bmax Q x1 x2 Bmin Bmax Q x2 x3 Bmin Bmax
Q
(iv) Upward sensitivity (US):
) , , , ( ) , , ,
(y1 y1 Bmin Bmax Q x1 x1 Bmin Bmax
Q for all 0and y1 x1.
This axiom captures the idea that incremental improvements become harder when the initial health attainment is higher. The absolute and the relative changes in attainment do not satisfy this axiom.
12 We follow here the presentation of Kakwani’s (1993) axioms as they appear in Majumder and Chakravarty (1996a; 1996b).
32
(v) Comparability (CO):
Assume thatx , 1 x and 2 y are less than 1 Bmax and that the following relation holds:
) , , , ( ) , , ,
(x1 x2 Bmin Bmax Q y1 y2 Bmin Bmax
Q . Then
y must always exist 2
y should be greater (smaller) than 2 x when 2 y is greater (smaller) than 1 x 1
y must never exceed 2 Bmax
Given that y1 x1, as x approaches 2 Bmax, y must also approach2 Bmax.
If an improvement index satisfies this axiom, then we are not allowed to compare the improvement of two countries when one of them cannot make an improvement that is as large as the other country because its initial attainment is already very close to the upper bound. For instance, suppose that the attainment of interest is the mean share of “births attended by skilled health personnel,” and suppose that we are interested in improvement in two countries A and B between two years. Suppose that in the first year, in country A, almost all births are attended by skilled health personnel, which means that attainment is very close to the upper bound 1. So attainment equals 1-ε with ε very small. In contrast, in country B, attainment is only 0.5. Then it is possible that country A cannot improve “births attended by skilled health personnel” as much as country B does, just because attainment is initially very close to 1. In that case, improvement in country A cannot be compared to improvement in country B. The extreme case is when both in the first and second year, in country A, attainment equals 1. Then there will be no
improvement in country A over time, but the comparability axiom will not “allow” us to compare this lack of improvement with improvement in country B.
Majumder and Chakravarty (1996a) suggest to add two axioms:
(vi) Continuity (CN):
The function Q is assumed to be continuous so that small changes in one of the arguments of Q will only lead to small changes inQ.
33 (vii) Dimensionality (DM): ) , , , ( ) , , ,
(x1 x2 Bmin Bmax Q x1 x2 Bmin Bmax
Q
This axiom guarantees that the index Qwill not be sensitive to the units in which health attainment is measured.
We extend the dimensionality axiom of Majumder and Chakravarty (1996a) to consider invariance to any linear transformation of the variables.
(viii) Invariance (INV):
) , , , ( ) , , ,
(x1 x2 Bmin Bmax Qx1 x2 Bmin Bmax Q
Note that the dimensionality axiom is a particular case of the invariance axiom, with 0. In other words, any index that satisfies the invariance axiom also satisfies the dimensionality axiom. Inversely, any index that does not satisfy the dimensionality axiom does not satisfy the invariance axiom either.
We saw in Section 2.2. that Kakwani (1993) proposes the two following improvement indices r r r B B x B x B B B x x Q 1 min max 1 2 max 1 1 max max min 2 1 ) ( ) ( ) ( ) , , , ( for 0r1 (A-1) and ) log( ) log( ) log( ) , , , ( min max 2 max 1 max max min 2 1 B B x B x B B B x x Q for r 1 (A-2)
Index (A-1) satisfies the RS, MO, AD, US, CN, and INV (and consequently DM) axioms. As for the CO axiom, let us consider two countries X and Y, in which attainment respectively goes from x to1 x and from 2 y to1 y over time. Kakwani2 13 highlights that


![[PDF] Cours général pour débuter avec le logiciel Ciel Devis Factures | Cours informatique](data:image/gif;base64,R0lGODlhAQABAIAAAP///wAAACH5BAEAAAAALAAAAAABAAEAAAICRAEAOw==)