HAL Id: hal-03014841
https://hal.archives-ouvertes.fr/hal-03014841
Submitted on 19 Nov 2020
HAL is a multi-disciplinary open access
archive for the deposit and dissemination of
sci-entific research documents, whether they are
pub-lished or not. The documents may come from
teaching and research institutions in France or
abroad, or from public or private research centers.
L’archive ouverte pluridisciplinaire HAL, est
destinée au dépôt et à la diffusion de documents
scientifiques de niveau recherche, publiés ou non,
émanant des établissements d’enseignement et de
recherche français ou étrangers, des laboratoires
publics ou privés.
Finger-like membrane protrusions are favored by
heterogeneities in the actin network
Shachar Gat, Camille Simon, Clément Campillo, Anne Bernheim-Groswasser,
C. Sykes
To cite this version:
Shachar Gat, Camille Simon, Clément Campillo, Anne Bernheim-Groswasser, C. Sykes. Finger-like
membrane protrusions are favored by heterogeneities in the actin network. Soft Matter, Royal Society
of Chemistry, 2020, 16 (31), pp.7222-7230. �10.1039/c9sm02444a�. �hal-03014841�
Finger-like membrane protrusions are favored by
het-erogeneities in the actin network
†
Shachar Gat,∗a Camille Simon,∗b Clément Campillo,c Anne Bernheim-Groswasser,§a‡ and Cécile Sykes§b‡
Finger-like protrusions in cells are mostly generated by an active actin cytoskeleton pushing against the cell membrane. Conventional filopodia, localized at the leading edge of the cells, are long and thin protrusions composed of parallel actin filaments that emanate from a branched actin network. In contrast, dendritic filopodia, precursors of dendritic spines in neurons, are en-tirely filled in with a branched actin network. Here, we investigate in vitro how the dynamics of branched actin structures, polymerized at a membrane surface, trigger the formation of both pro-trusion types. Using supported bilayers and liposomes, we show that a decrease in the amount of activation sites at the membrane surface leads to the appearance of heterogeneities in the actin network coverage. Such heterogeneities promote the formation of membrane protrusions, and the size of heterogeneity patches matches the one of the protrusion base. Protrusion shape, cylindrical or conical, directly correlates with the absence or the presence of actin branches, re-spectively.
Cell membranes deform during cell processes such as division, motility, endocytosis, under the combined action of membrane proteins and the cytoskeleton1. In particular, the growth and assembly of the actin cytoskeleton are activated at membranes where it polymerizes and branches, thus generating a force suffi-cient to deform the membrane. One single actin filament, in prin-ciple, is able to generate a sufficient force (1-9 pN) to produce a finger-like membrane deformation if the actin filament is fixed at its non-growing end2,3. Moreover, a homogeneous branched
network growing at a membrane was shown to generate inward and outward membrane deformations4.
Inward and outward deformations of the cell membrane re-fer, respectively, to endocytosis and filopodia formation. For both types of deformation, the membrane curves inward or outward with a radius of curvature on the order of about 100 nm.
There-aDepartment of Chemical Engineering, Ilse Kats Institute for Nanoscale Science and Technology, Ben Gurion University of the Negev, Beer-Sheva, Israel.
bLaboratoire Physico Chimie Curie, Institut Curie, PSL Research University, CNRS UMR168, Paris, France.
c LAMBE, Université Evry Val d’Essonne, CNRS, CEA, Université Paris-Saclay, Evry, France.
∗ These authors contributed equally to this work § These authors jointly supervised this work
‡ To whom correspondence should be addressed. E-mail: cecile.sykes@curie.fr, bernheim@bgu.ac.il
† Electronic Supplementary Information (ESI) available: [details of any supplementary information available should be included here]. See DOI: 10.1039/cXsm00000x/
fore, the details of the composition of the membrane that may explain its curvature has attracted most attention, whereas the role of actin dynamics in pushing or pulling on the membrane has been less quantified, although in cells, actin is always present at sites where the cell membrane deforms.
Endocytosis is the process of external material uptake by a cell. It involves, at its onset, an inward membrane curvature at the site of contact. External material can be substances the cell needs for its metabolism, or bacteria, or even viruses. Thus, the ini-tial membrane curvature for endocytosis spans from micrometers to below tens of nanometers, evoking a limited number of pro-teins or lipids involved in the process. Research has therefore focused a lot on lipidomic and proteomic approaches to reach an understanding of the endocytic machinery. As usual in such com-plex biological phenomena, many proteins and lipids have been found to play a crucial role, and endocytosis is nowadays under-stood as a whole orchestra piece with proteins and lipids work-ing in concert5. Actin-based forces have occupied physicists for
a while, to understand how a single filament6 or a network of filaments7 could deform a membrane. Mimicking experiments, using purified proteins and non-charged lipids have allowed to address the details of the physical mechanism of membrane de-formation: the actin network has elastic and viscous properties, and its growth close to the membrane is able to deform it very efficiently4,8,9. Experiments in yeast revealed that the growth of actin filaments is, indeed, what deforms the membrane for endocytosis10, whereas lipids and proteins that precede the
de-formation assemble in "plateforms", plane membrane structures that support the recruitment of actin polymerization activators at the membrane11. A lipodomic/proteomic approach of liposomes bathed in cell extracts12led to two distinct hypothesis that could explain membrane deformations, driven either by spontaneous membrane curvature, or by actin filament growth. Using experi-mentally controlled systems mimicking the cell membrane and its underlying cytoskeleton, in the absence of any curvature protein, tubular membrane deformations are obtained4that are strikingly reminiscent of the ones obtained in12. Moreover, experiments based on the synthetic cell approach reveal that actin polymeriza-tion into a branched network can also push the membrane into structures that are similar to the ones that deform and even rup-ture the nuclear membrane in starfish oocytes4,13.
Filopodia refer to long, actin-rich, cellular protrusions that are believed to sense cell environment. As for endocytosis, a large effort has been dedicated to decipher the molecular players of filopodia formation, as biochemistry and molecular biology tools became available. Two "models" have been proposed to explain filopodia formation, the "tip-elongation" one, in which proteins, localized at a membrane spot, nucleate actin filament elongation that pushes the membrane, whereas the "convergent-elongation" model relies on the convergence of branched actin filaments into a bundle through elastic interactions with the membrane2,14,15. However, different filopodia are observed in vivo in the synapse of neurons and in vitro in reconstituted actin cortices16that do not contain specifically parallel actin filaments, but a branched, dendritic actin network17.
Asters of actin filaments form under the action of the branch-ing nucleator, the Arp2/3 complex, both in vitro18and in vivo19. They can reorganize into stars in the presence of bundling agents, such as fascin, and parallel filament bundles appear that can push the membrane and are reminiscent of conventional filopo-dia18,20–23. Their mechanism of formation relies on parallel
fil-ament bundles that emanate from dendritic branched networks. Bundled actin filaments then continue to grow leading to pro-trusion elongation. We reproduce here branched actin structures
in vitro growing from membrane with two geometries, planar and
spherical, to decipher how different structures (dendritic and par-allel networks) emanate from a branched growing network and form, develop, and deform the membrane. We look into how the pure effect of actin polymerization through branching, triggered at the membrane surface, generates a large variety of shapes de-pending on the initial heterogeneity in the actin network.
1
Methods
1.1 Chemicals and proteins
Chemicals are purchased from Sigma Aldrich (St. Louis, MO, USA) unless specified otherwise. L-alpha-phosphatidylcholine (EPC) and 1,2-distearoyl-sn-glycero-3-phosphoethanolamine-N-[biotinyl polyethylene glycol 2000] (biotinylated-PEG lipids) are purchased from Avanti polar lipids (Alabaster, USA). TexasRed c 1,2-dipalmitoyl-sn-glycero-3-phosphocholine, tri-ethylammonium salt (TexasRed-DHPE) is from Thermofisher (Waltham, USA). Actin and porcine Arp2/3 complex are
pur-chased from Cytoskeleton (Denver, USA) and used with no further purification. Alexa-Fluor 488 actin is obtained from Molecular Probes (Eugene, Oregon, USA). Mouse α1β 2 capping protein (CP) is purified as in24. Untagged human profilin and the nucleation promoting factor S-pVCA (Streptavidin-C-terminal active domain of Wiskott-Aldrich syndrome protein (WASP)) are purified as in25. Porcine Arp2/3 complex is fluorescently labeled with Alexa Fluor 488 C5-maleimide (ratio of 1:10 protein:label) at pH 7.2 for 3h on ice and then purified on a PD Minitrap G-25 column. A solution of 30 µM monomeric actin containing 15 mol % of labeled Alexa-488 actin is obtained by incubating the actin solution in G-Buffer (2 mM Tris, 0.2 mM CaCl2, 0.2 mM DTT,
0.2 mM ATP, pH 8.0) overnight at 4◦C . All proteins except actin,
i.e. S-pVCA, profilin, and CP are diluted in a TPE buffer (25 mM imidazole, 70 mM sucrose, 1 mM Tris, 50 mM KCl, 2 mM MgCl2,
0.1 mM DTT, 2 mM ATP, 0.02 mg/mL β -casein, pH 7.4, 200 mOsm), before using them in the actin polymerization solution for triggering the formation of the branched actin network.
1.2 Preparation of liposomes and Supported lipid bilayers
(SLBs)
Liposomes are prepared using the electroformation technique26. Briefly, 10 µL of a lipids mixture of (mol %) 99.8 % EPC, 0.1 % biotinylated-PEG lipids, and 0.1 % fluorescently labeled lipids (TexasRed-DHPE) with a concentration of 2.5 mg/mL in chloro-form/methanol 5:3 (v/v) are spread onto indium tin oxide (ITO)-coated plates under vacuum for 2 h. A chamber is formed using the ITO plates (their conductive sides facing each other) filled with TPI buffer (0.2 M sucrose, 2 mM Tris, pH 7.4, 200 mOsm) and sealed with hematocrit paste (Vitrex Medical, Denmark). Li-posomes are formed by applying an alternate current voltage (10 Hz, 1 V rms) for 2 h. Liposomes are then coated with S-pVCA by mixing the liposomes with a solution of S-pVCA for 15 min at room temperature. The S-pVCA molecules bind to the liposome surface via streptavidin-biotin links. We varied the concentration of S-pVCA in the incubating solution between 0.035 µM - 3.5 µ M. Liposomes are used immediately at the end of the incuba-tion step. Supported lipid bilayers (SLBs) are formed by flowing 1 mg/mL solution of small unilamellar vesicles (SUVs) in mem-brane buffer (10 mM Tris-HCl, pH 7.4, 2 mM MgCl2and 50 mM
KCl) in a flow-cell chamber prepared using piranha-treated glass slide and glass coverslip27. The chamber volume is ∼ 40 µL. The SUVs are 50 nm in diameter and have the same lipid composition as that of the liposomes described above. After 15 min of incu-bation at 37◦C, the excess of vesicles are washed with 2 volumes of membrane buffer. A solution of S-pVCA is then loaded into the chamber and incubated for 15 min at room temperature. Excess S-pVCA is rinsed with 3 volumes of TPE buffer. We use the same S-pVCA concentrations as those used in the liposome system.
1.3 Formation of a branched actin network
To promote polymerization on the liposome surface, a volume of 5 µL S-pVCA-coated liposomes is mixed with 25 µL of an actin polymerization solution, leading to final concentrations of 1.5 mM Tris-HCl, 40 mM KCl, 1.5 mM MgCl2, 1.5 mM ATP, 75
µ M DTT, 0.02 mg/mL β -casein, 57 mM sucrose, 20 mM imida-zole, 3 µM G-actin (15 % actin labeled with Alexa-Fluor 488), 3 µ M profilin, 0.037 µ M Arp2/3 complex, and 0.025 µ M CP. Actin polymerization on SLBs is promoted by flowing one volume of the actin polymerization solution in the SLB-coated flow cham-bers. In both systems, the actin polymerization solution is used immediately after mixing (defined as t = 0).
1.4 Image acquisition and analyses of liposomes and SLBs
Liposomes are imaged by phase contrast and epifluorescence mi-croscopy. Imaging is performed using an IX70 Olympus inverted microscope with a 100x or a 60x oil-immersion objective. Images are collected by a charge coupled device CCD camera (CoolSnap, Photometrics, Roper Scientific). For three-dimensional acquisi-tion, confocal microscopy is performed using an inverted confo-cal spinning disc Roper/Nikon with a 100x oil-immersion objec-tive and lasers with wavelengths of 491 nm for Arp2/3 complex and 561 nm for lipids. A FITC filter cube (excitation filter: 478-495 nm/emission filter: 510-555 nm) and a TxRed filter cube (excitation filter: 560-580 nm/emission filter:600-650 nm) are used to acquire respectively Arp2/3 complex and lipids fluores-cence. Images are collected by a CCD camera (CoolSnap HQ2, Photometrics, Roper Scientific). Z-stacks are acquired using the software Metamorph on each wavelength with a z-interval of 0.3 µ m. SLBs are imaged by total internal reflection fluorescence mi-croscopy (TIRFm) on a Leica DMI6000B microscope. Samples are excited by total internal reflection illumination 488 and 568 nm (lasers excitation wavelength), and images are captured with an Andor back-illuminated DU-897 EMCCD camera controlled by Le-ica software (LAS-AF-6000, LeLe-ica Microsystems CMS GmbH, Ger-many). The illumination settings, i.e. the lasers intensity, camera acquisition time, and the decay penetration length, are kept the same in all experiments.
Image analysis is performed with ImageJ (NIH), Origin (Origin-Lab Corp.) and Matlab (MathWorks).
1.4.1 SLB system.
Local changes in actin network and lipid membrane struc-tural organization. To obtain fluorescence intensity (density)
profiles of the lipids and the actin, lines of 3 pixel thick and 30 µ m long are drawn across the SLBs at various time points of the experiment.
Growth dynamics of branched actin networks. For each
S-pVCA concentration, we measure the changes in actin fluores-cence (which provides a measure of actin filament density) with time. To avoid edge effects, we use the central two third of the image where sample illumination is uniform. For each time point, we determine the mean actin fluorescence intensity in 10 regions of 10 µm2. The data points are fitted to a sigmoidal I = A
1+Be−tτ ,
where A and B are constants and τ is a characteristic time con-stant for actin network growth. Errors in mean actin fluorescence intensity correspond to standard deviation of experimental val-ues. Intensity values were divided by a factor of 6000. Data is presented in arbitrary units.
Estimating actin aster (or actin patch) area, number of actin asters per image, and the fraction of actin network surface
coverage. For images at low S-pVCA concentrations (35 and
100 nM), we first remove background fluorescence by applying a Gaussian filter (σ = 15) and subtracting the Gaussian filtered image pixel by pixel from the original image. We then apply a median filter (2,2) to the subtracted image to remove high fre-quency noise28. We finally generate a binary image by histogram
equalization, where we set the background fluorescence (inten-sity of pixels located in between individual actin asters) to zero and the rest of the pixels is set to 1. For images at S-pVCA con-centrations ≥ 350 nM, we replace the Gaussian filter step with a rolling ball algorithm with radius of curvature of 50 pixels (as described in29) to correct possible uneven illumination. Then the original image is subtracted pixel by pixel from the smoothened image. The binary image is then obtained by setting to zero the 5% of all pixels with the lowest intensity and the remaining 95 % of the pixels is set to 1.
To determine the actin aster area and number of individual actin asters in a given image during actin network growth (at t = 30, 80, and 110 s) and at steady state (t = 30 min), we use the Particle Analyzer algorithm as plug-in from ImageJ. From the analysis, we determine the distribution of aster area and mean number of asters per image area (each image contains 512x512 pixels which corresponds to an area of 117x117 µm2). We set
the minimal size of an aster as 0.05 µm2(i.e. 1 pixel). Errors in
number of asters per image correspond to the standard deviation of experimental values. The fraction of surface coverage of actin asters was calculated from the total number of pixels with non-zero intensity (n) divided by the total number of pixels per image (N0 = 512x512 pixels). The percentage of surface coverage per
image is thus given by: %coverage = n
N0∗ 100. Errors correspond
to the standard deviation of experimental values.
Estimating the number of lipid clusters per SLB surface at var-ious stages of the experiment. To remove background
fluores-cence, we use the same method as for actin signal images with a Gaussian filter (σ = 5) and a median filter (5,5). Using the same Particle Analyzer algorithm as described above, we determine the number of lipid clusters per image area (each image has 470x470 pixels which corresponds to an area of 108x108 µm2). Errors in
number of lipid clusters per image at steady state correspond to the standard deviation of experimental values.
1.4.2 Liposome system.
Occurrence of spikes. The occurrence of spikes equals the
num-ber of liposomes displaying spikes (visible in both membrane and actin fluorescence signal) divided by the total number of lipo-somes. Error bars correspond to the standard deviation of two independent experiments.
Estimating spike base and tip width, spike length and spike base area. The base (resp. tip) width and length of a spike are
measured from the fluorescent signal of the membrane. A line of 5 pixel thick is drawn at the base (resp. tip) of the spike (or from spike base to tip) to obtain a fluorescence profile which is fitted with a polynomial function. The first maximum and the second minimum of the fit derivative, corresponding to inflexion points of the profile, determine the membrane edges. The base (resp. tip) width (or spike length) is then the distance between the two
edges. The base area is equal to the area of a disc of diameter the width of the spike base i.e. π(spike base width2 )2.
Presence of the Arp2/3 complex inside spikes. For each spike,
we measure the mean intensity of the Arp2/3 complex fluores-cence inside the spike, Ispike, on a two-pixel width line that spans
from the base to the tip. We then subtract the mean background intensity of the Arp2/3 complex, Is,background, evaluated using the
same line positioned in the bulk solution. We then evaluate the mean intensity of the Arp2/3 complex fluorescence within the clump of actin network observable at the base of the spike, Iclump,
on a two-pixel width line along the base width, and subtract the mean background fluorescence Ic,background, evaluated outside the
liposome the same way as above. We then calculate the relative difference in intensity as ∆I = Ispike−Is,background
Iclump−Ic,background.
2
Results
2.1 Experimental system
Cell mimicry is achieved here with a lipid membrane supporting a dynamically growing actin network. We follow how the actin net-work grows and how it correlates with membrane deformation. For that, we study two geometries in parallel. Spherical giant unilamellar vesicles (here called liposomes) allow us to visualize membrane indentations whereas planar supported lipid bilayers (SLBs) permit the detailed observation of actin network growth at the membrane. Liposomes and SLBs are coated with a nucleation promoting factor that activates actin polymerization through the branching agent, the Arp2/3 complex. The nucleation promot-ing factor we use is the fragment pVCA of WASP with a strepta-vidin tag to link it to the biotinylated lipids present in the mem-brane (see Methods). We call this fragment S-pVCA. A branched actin network grows from the activated membrane with the use of an actin polymerization solution in which the S-pVCA-coated liposomes are placed, or which is introduced in a flow chamber containing the S-pVCA-coated SLB (Methods and25). Incubating
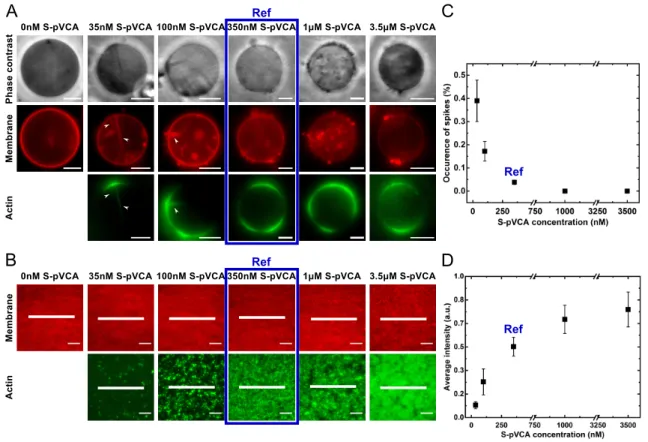
liposomes with 350 nM of S-pVCA (referred to as the ’reference condition’, or ’ref’) triggers the growth of a branched actin net-work once placed in the actin polymerization solution (Fig. 1A, ref condition)4,25. In reference condition, symmetry breaking events happen and prove that our system is efficient to gener-ate an actively polymerizing actin network25. Likewise, an actin network forms at the surface of SLBs pre-incubated with 350 nM of S-pVCA (Fig. 1B). Rarely, but observably around liposomes, elongated structures of membranes filled in with actin, hereafter called "spikes", point inward and are reminiscent of filopodia4. In the absence of actin, inward membrane deformations are not ob-served (Fig. 1A, 0 nM S-pVCA). This excludes that spontaneous membrane deformations may be induced by our liposome pro-duction method, as we use electroformation with non-charged lipids30. Additionally, spikes collapse when the actin network is photodamaged4. Altogether, these results confirm that the spikes observed here rely exclusively on actin network growth.
In order to assess if such spike formation may depend on the quantity of nucleation promoting factor and the actin network structure, we vary the nucleation promoting factor concentration, below and above 350 nM S-pVCA, in both liposome and SLB
sys-tems.
2.2 Variation of nucleation promoting factor concentration
We incubate the membrane with lower (35 nM, 100 nM) and higher (1 µM, 3.5 µM) concentrations of S-pVCA as compared to the reference condition. Strikingly, at lower S-pVCA concentra-tions, when the liposome surface is not saturated with bound S-pVCA molecules (Supplementary Information), we observe more liposomes displaying spikes, and the actin layer formed around the liposomes appears less homogeneous than in reference condi-tion (Fig. 1A). Even more visible on SLBs, the actin network ap-pears noticeably patchy at low S-pVCA concentrations (Fig. 1B). In contrast, at higher S-pVCA concentrations, no spikes are ob-served (Fig. 1A and C) and the actin network grown on SLBs is homogenous (Fig. 1B and D). Since the SLB is confined to a rigid support, inward membrane deformations (such as spikes) cannot occur. We do observe though lateral reorganization of the mem-brane in the form of lipid clusters, but it is already present before actin is added (Fig. S1). Note that actin polymerization does not promote additional lipid clusterization (Fig. S1B).
2.3 Quantitative analysis of actin growth dynamics
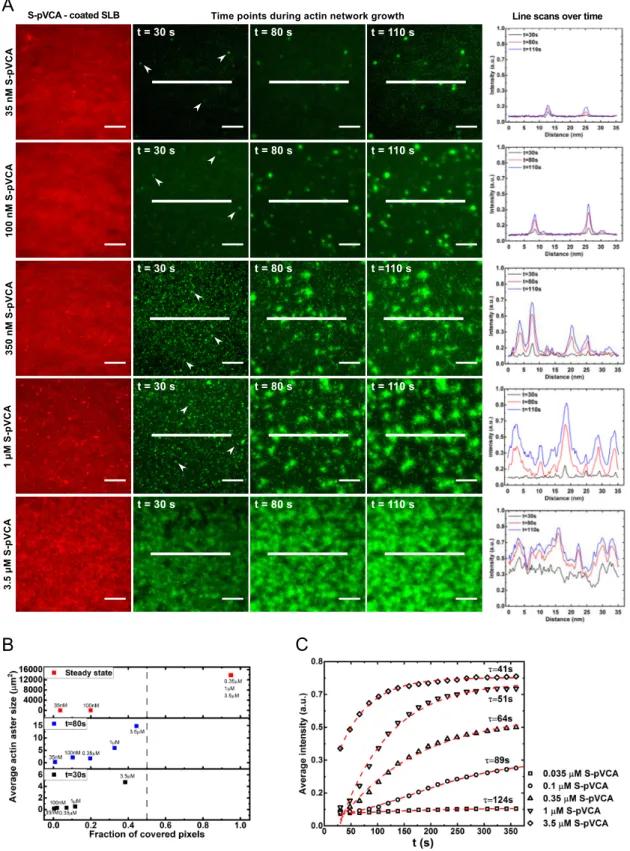
We characterize the growth dynamics of actin on SLBs for all con-centrations of S-pVCA by following actin fluorescence intensity and actin network structural organization as a function of time (Fig. 2A). The branched nucleation of actin at the SLB surface promotes the formation of actin "asters"18(white arrow-head in Fig. 2A). More asters are formed at higher concentrations of S-pVCA, as the fraction of covered pixels at early time increases with concentration (Fig. 2B). Indeed, 30 seconds after addition of the actin polymerization solution, only a few actin nucleation sites are observed at low S-pVCA concentrations (35 nM, 100 nM) whereas at higher S-pVCA concentrations (≥ 350 nM) numer-ous asters are already formed (Fig. 2A). Individual asters grow and densify with time as revealed by the increase in the fluo-rescence intensity (Fig. 2A, fluofluo-rescence intensity profiles) and aster size (Fig. 2B). Moreover, we observe the nucleation of new actin asters with time which increases the fraction of actin net-work surface coverage (Fig. 2B). This increase is far more promi-nent as the concentration of S-pVCA is elevated as depicted in Fig. 2B. Quantitative analysis of the intensity of individual asters versus time reveals that the temporal evolution of branched actin network density follows a sigmoidal function characterized by a characteristic time constant, τ (see Methods). The higher the S-pVCA concentration, the faster the steady state is reached (i.e. the smaller is τ, Fig. 2C), the denser is the actin network (i.e. higher average actin fluorescence intensity, Fig. 1D and Fig. 2C). Consistently, compared to reference conditions, lower concentra-tions of S-pVCA produce less fluorescence of the actin network around liposomes (Fig. 1A). At higher concentrations of S-pVCA for liposomes, the membrane is saturated with S-pVCA molecules (Supplementary Information) which leads to bulk polymerization and explains the fluorescent background of liposome images (Fig. 1A, last column).
Fig. 1 Impact of S-pVCA concentration on branched actin network structural organization around liposomes (A, C) and on flat supported lipid bilayers
(B, D) at steady state. (A) Phase contrast (upper row), fluorescence imaging of the lipid membrane (middle row) and the actin network (bottom row). White arrow heads point to "spikes". (B) TIRFm imaging of the supported lipid membrane (upper row) and the branched actin network (lower row). (C) Number of liposomes displaying spikes. (35 nM, N = 77; 100 nM, N = 93; 350 nM, N = 53; 1000 nM, N = 40; 3500 nM, N = 36). (D) Average intensity of actin fluorescence as a function of S-pVCA concentration (see Methods and Fig. S2C). Errors correspond to standard deviation of experimental values. Images are acquired 30 min after addition of the actin polymerization solution. Bars are 10 µm.
2.4 Comparison of aster area (SLB) and spike base area
(Li-posome) at steady state for low S-pVCA concentrations
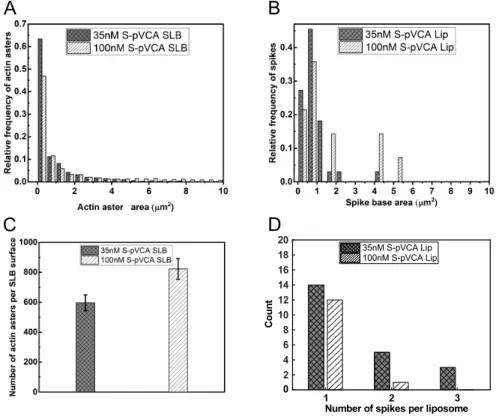
We determine the area of the asters formed on supported lipid bilayers at steady state at S-pVCA concentrations of 35 and 100 nM (see Methods), which corresponds to the conditions for which spikes form on liposomes. For comparison, we determine the area of the spike base. We observe that the distribution of aster area on SLBs is narrower at 35 nM S-pVCA as compared to 100 nM S-pVCA, and so is the distribution of spike base area (Fig. 3A and B). Although the distribution of aster areas for a given S-pVCA concentration is wider than that of spike base areas, on average, aster and spike base areas are of the same order of a few mi-crometer size. On supported bilayers, the total number of asters increases with S-pVCA concentration, as can be already observed in Fig. 2. We find indeed that the average number of asters per image at 35 nM is N = 590 ± 50 and at 100 nM is N = 820 ± 70 (mean ± SD, Fig. 3C). Strikingly, we observe the opposite tendency in number of spikes per liposome: at the lower concen-tration of S-pVCA (35 nM), liposomes display more spikes than in reference condition (Fig. 3D). This observation reveals that even if more asters are present at a higher concentration of S-pVCA, only a fraction of them turn into spikes around liposomes. Conversely, a low concentration of S-pVCA is very efficient in pro-ducing spikes. This suggests that lower density of actin branches
and smaller asters are more efficient in producing spikes. Note that spike length at steady state is not affected at S-pVCA concen-trations of 35 and 100 nM (Fig. S4A).
2.5 Estimate of the Arp2/3 complex content of spikes at low
S-pVCA concentrations
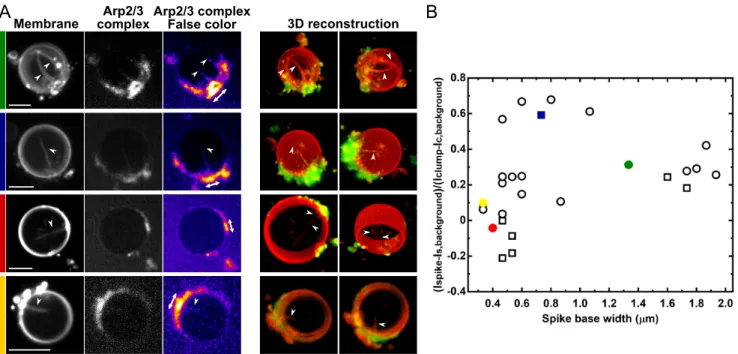
A closer look at the structure of spikes at low S-pVCA concentra-tions reveals that they display different structures, either thin and long, or conical with a wider base (Fig. 4 and Fig. S4B). In order to characterize the branching degree of the network inside those different spikes, we use a fluorescent Arp2/3 complex to visualize the actin network, as actin and the Arp2/3 complex are intimately linked, and estimate the amount of branches through the network (Methods). The fluorescence intensity of Arp2/3 complex within the spikes is compared to that in the bulk solution and is nor-malized to the basal branched network intensity (i.e. the clump of actin at the base of the spike, as previously reported,4
Meth-ods). Negative values correspond to an absence of the Arp2/3 complex, as the spike contains less Arp2/3 fluorescence than the bulk solution, whereas positive values reveal the presence of the Arp2/3 complex within the spike. We find values that span from negative to positive values (Fig. 4), indicating that for around 10 % of spikes, the internal network is devoid of the Arp2/3 com-plex. Such spikes correlate with a thinner base, as is observed
Fig. 2 Branched actin network nucleation and growth on SLBs. (A) Dual TIRFm imaging of the lipid membrane and the branched actin network at
increasing amounts of S-pVCA. The lipid membrane is labeled with TexasRed and actin is labeled with Alexa-Fluor 488. (Left to right, refers to columns 1-5). (Column 1): lipid membrane after TPE buffer wash to remove unbound (excess) S-pVCA and prior the addition of the actin polymerization solution. (Columns 2-4). Time-lapse TIRFm imaging of actin network assembly from mixing, i.e., t = 0, to t = 110 s. White arrow-heads mark the nucleation of actin asters (shown for image clarity at t = 30 s only). Bars are 10 µm. (Column 5) Intensity (density) profiles of the actin network along the lines drawn in columns 2-4 at three time points. (B) Average area of actin asters as a function of the fraction of surface coverage estimated at different time points. Shown are the results for the various S-pVCA concentrations. The grey dotted line corresponds to surface coverage of 0.5. (C) Average intensity of actin fluorescence as a function of time. The lines represent sigmoidal fits (R2∼ 0.99) to the experimental values (symbols). The decay time constant characterizing actin network growth is given by τ (see Methods). Conditions: the actin polymerization solution and membrane lipid composition are the same as in Fig. 1.
Fig. 3 Aster area in supported bilayers (SLB) and spike base area in liposomes (Lip) at steady state for low S-pVCA concentrations. Distribution
of aster area (A) and spike base area (B) for S-pVCA concentrations of 35 and 100 nM. (C) Mean number of asters per SLB surface area. Errors correspond to standard deviation of experimental values. (D) Number of spikes per liposome. The black column is for 350 nM S-pVCA above which no spikes form.
in the intensity/width diagram (Fig. 4B and Fig. S4B). There-fore, spikes can grow as membrane deformations, both in the ab-sence or in the preab-sence of the Arp2/3 complex available in the network. Moreover, we find that higher amounts of the Arp2/3 complex in the spike correlates with a wider spike base (Fig. 4).
3
Discussion
A homogeneous actin network that grows towards the membrane is able to deform it locally in a spike, as previously shown4. The continuous model used in4considers the actin network as a
ho-mogeneous viscous medium and therefore does not apply when this medium is heterogeneous. We investigate here experimen-tally the role of network heterogeneities in the mechanism of membrane deformations induced by actin polymerization16.
At 350 nM S-pVCA and higher concentrations the system forms a percolated actin network at steady state, confirmed by the 90 % of the SLB surface covered with a dense actin layer, above the percolation threshold of 50 % for 2D systems31. Individual actin asters, i.e. actin network heterogeneities, persist only at the low-est S-pVCA concentrations of 35 and 100 nM. In these conditions, more spikes are observed around liposomes. The increase in the capacity of liposomes to form spikes is correlated with the appear-ance of individual actin asters i.e., more spikes are observed in the conditions of isolated asters. Furthermore, aster area correlates with spike base area (Fig. 3), thereby suggesting that spikes have their origin in asters. This positive correlation between hetero-geneities in the actin coverage and occurrence of membrane
de-formations is consistent with the formation of actin patches that generate membrane protrusions in reconstituted actin cortices16
or that precede the formation of dendritic filopodia in the spinal cord of chicken embryos32.
Strikingly, spikes with different morphologies and structures are observed (Fig. 4). Elongated, cylindrical shape protru-sions are devoid of actin branches whereas conical shape pro-trusions contain branches, as evidenced by fluorescent markage of the Arp2/3 complex (Fig. 4). Cylindrical protrusions, reminis-cent of conventional filopodia, are explained by actin filaments that emanate from the branched network and grow as a paral-lel bundle through bundling effect of the membrane, as previ-ously reported,2 without the need for any actin crosslinker. In the absence of the membrane, bundlers such as fascin are neces-sary to orient parallel filaments emanating from a branched net-work22,33. Conical shape protrusions, reminiscent of dendritic filopodia in neurons, rely on constant actin filament branching at their membrane surface4. Their mechanisms of formation could rely either on a dynamic effect of actin filament growth16or an
enhanced local branching on the surface of the initial heterogene-ity34,35. Therefore, our experimental results recapitulate the va-riety of protrusion structures, with a different branching degree within the actin network, reported in in vitro systems2,4,16.
4
Conclusions
We show here that spikes can form either from a continuous actin network or from a patchy, localized branched actin
struc-Fig. 4 Presence of the Arp2/3 complex inside spikes at lower concentrations of S-pVCA (35 nM, 100 nM). (A) Representative images of the presence
(two first rows, green and blue) or absence (third row, red) of the Arp2/3 complex inside spikes. The fourth row (yellow) shows an ambiguous case. First three columns: sum of z-stack confocal images of the membrane, the Arp2/3 complex and false colour image of the Arp2/3 complex. Last two colums: 3D reconstruction for z-stack confocal images (membrane in red, Arp2/3 complex in green). White double arrows indicate the clump of actin at the base of the spike. White arrow heads point toward spikes. Scale bars: 5 µm. (B) Arp2/3 complex fluorescence intensity values as a function of spike width. The colored points (green, blue, red, yellow) refer to rows in (A). Squares (resp. circles) refer to 35 nM (resp. 100 nM) S-pVCA. Note that a different batch of S-pVCA is used for these experiments compared to main figures. Due to a difference in protein activity, spikes are obtained in the 100 nM condition for actin and profilin set to 1 µM. N=25 liposomes, n = 27 spikes.
ture. More spikes are formed when the concentration of actin nucleation promoting factors is lowered, pointing to a facility of spikes to form when the actin network is not homogeneous. In these conditions of a patchy, branched network, both dendritic and conventional filopodia-like membrane deformations are ob-served. Therefore, cell membranes underlined by a branched cytoskeleton increase their ability to deform into filopodia-like structures in the presence of inhomogeneities of the actin net-work. Then they have multiple ways to deform under the effect of actin filament growth, either into branches or into parallel fil-aments that exclude the Arp2/3 complex.
Conflicts of interest
There are no conflicts to declare.Acknowledgements
This work was supported by the MAIMONIDE Hubert Curien Franco-Israeli program, the French Agence Nationale pour la Recherche (ANR), grant ANR-14-CE090006 and ANR-12-BSV5001401, and by the Fondation pour la Recherche Médicale (FRM), grant DEQ20120323737. A.B.-G. thanks the Israel Sci-ence Foundation (grant 1618/15) for financial support. Ca.S. was supported by a Labex Celtisphybio transition fellowship.
References
1 L. Blanchoin, R. Boujemaa-Paterski, C. Sykes and J. Plastino,
Physiological reviews, 2014,94, 235–263.
2 A. P. Liu, D. L. Richmond, L. Maibaum, S. Pronk, P. L. Geissler
and D. A. Fletcher, Nature physics, 2008,4, 789.
3 S. Dmitrieff and F. Nédélec, J Cell Biol, 2016,212, 763–766.
4 C. Simon, R. Kusters, V. Caorsi, A. Allard, M. Abou-Ghali, J. Manzi, A. Di Cicco, D. Lévy, M. Lenz, J.-F. Joanny, C. Campillo, J. Plastino, P. Sens and C. Sykes, Nature Physics, 2019,8, year.
5 F.-Z. Idrissi, A. Blasco, A. Espinal and M. I. Geli, Proceedings of
the National Academy of Sciences, 2012,109, E2587–E2594.
6 A. Mogilner and G. Oster, Biophysical journal, 2003,84, 1591–
1605.
7 J. Plastino and C. Sykes, Current opinion in cell biology, 2005,
17, 62–66.
8 A. Upadhyaya, J. R. Chabot, A. Andreeva, A. Samadani and A. van Oudenaarden, Proceedings of the National Academy of
Sciences, 2003,100, 4521–4526.
9 P. A. Giardini, D. A. Fletcher and J. A. Theriot, Proceedings of
the National Academy of Sciences, 2003,100, 6493–6498.
10 W. Kukulski, M. Schorb, M. Kaksonen and J. A. Briggs, Cell, 2012,150, 508–520.
11 S. Vassilopoulos, C. Gentil, J. Lainé, P.-O. Buclez, A. Franck, A. Ferry, G. Précigout, R. Roth, J. E. Heuser, F. M. Brodsky
et al., Journal of Cell Biology, 2014,205, 377–393.
12 M. Anitei, C. Stange, C. Czupalla, C. Niehage, K. Schuhmann, P. Sala, A. Czogalla, T. Pursche, Ü. Coskun, A. Shevchenko
et al., Cell reports, 2017,20, 2087–2099.
13 N. Wesolowska, I. Avilov, P. Machado, C. Geiss, H. Kondo, M. Mori and P. Lenart, eLife, 2020,9, year.
14 C. Yang and T. Svitkina, Cell adhesion & migration, 2011,5,
402–408.
15 A. Mogilner and B. Rubinstein, Biophysical journal, 2005,89,
782–795.
16 K. Dürre, F. C. Keber, P. Bleicher, F. Brauns, C. J. Cyron, J. Faix and A. R. Bausch, Nature Communications, 2018,9, 1–11.
17 F. Korobova and T. Svitkina, Molecular biology of the cell, 2010,21, 165–176.
18 L. Haviv, Y. Brill-Karniely, R. Mahaffy, F. Backouche, A. Ben-Shaul, T. D. Pollard and A. Bernheim-Groswasser, Proceedings
of the National Academy of Sciences, 2006,103, 4906–4911.
19 M. Fritzsche, R. A. Fernandes, V. T. Chang, H. Colin-York, M. P. Clausen, J. H. Felce, S. Galiani, C. Erlenkämper, A. M. Santos, J. M. Heddleston et al., Science Advances, 2017,3, e1603032.
20 T. M. Svitkina, E. A. Bulanova, O. Y. Chaga, D. M. Vignjevic, S. ichiro Kojima, J. M. Vasiliev and G. G. Borisy, Journal of Cell
Biology, 2003,160, 409–421.
21 D. Vignjevic, D. Yarar, M. D. Welch, J. Peloquin, T. Svitkina and G. G. Borisy, The Journal of cell biology, 2003,160, 951–
962.
22 Y. Ideses, Y. Brill-Karniely, L. Haviv, A. Ben-Shaul and A. Bernheim-Groswasser, PloS one, 2008,3, e3297.
23 K. Lee, J. L. Gallop, K. Rambani and M. W. Kirschner, Science, 2010,329, 1341–1345.
24 S. Palmgren, P. J. Ojala, M. A. Wear, J. A. Cooper and P.
Lap-palainen, J Cell Biol, 2001,155, 251–260.
25 K. Carvalho, J. Lemière, F. Faqir, J. Manzi, L. Blanchoin, J. Plastino, T. Betz and C. Sykes, Philosophical Transactions of
the Royal Society B: Biological Sciences, 2013,368, 20130005.
26 M. I. Angelova and D. S. Dimitrov, Faraday discussions of the
Chemical Society, 1986,81, 303–311.
27 K. J. Seu, A. P. Pandey, F. Haque, E. A. Proctor, A. E. Ribbe and J. S. Hovis, Biophysical journal, 2007,92, 2445–2450.
28 M. R. Blanton, E. Kazin, D. Muna, B. A. Weaver and A. Price-Whelan, The Astronomical Journal, 2011,142, 31.
29 S. R. Sternberg, Computer, 1983, 22–34.
30 J. Steinkühler, P. De Tillieux, R. L. Knorr, R. Lipowsky and R. Dimova, Scientific reports, 2018,8, 1–9.
31 M. Sykes and J. Essam, Physical Review Letters, 1963,10, 3.
32 M. Spillane, A. Ketschek, S. L. Jones, F. Korobova, B. Marsick, L. Lanier, T. Svitkina and G. Gallo, Developmental
neurobiol-ogy, 2011,71, 747–758.
33 Y. Brill-Karniely, Y. Ideses, A. Bernheim-Groswasser and A. Ben-Shaul, ChemPhysChem, 2009,10, 2818–2827.
34 V. Achard, J.-L. Martiel, A. Michelot, C. Guérin, A.-C. Rey-mann, L. Blanchoin and R. Boujemaa-Paterski, Current
biol-ogy, 2010,20, 423–428.
35 P. Bieling, J. Weichsel, R. McGorty, P. Jreij, B. Huang, D. A. Fletcher, R. D. Mullins et al., Cell, 2016,164, 115–127.