HAL Id: hal-03125277
https://hal.archives-ouvertes.fr/hal-03125277
Submitted on 1 Feb 2021
HAL is a multi-disciplinary open access
archive for the deposit and dissemination of
sci-entific research documents, whether they are
pub-lished or not. The documents may come from
teaching and research institutions in France or
abroad, or from public or private research centers.
L’archive ouverte pluridisciplinaire HAL, est
destinée au dépôt et à la diffusion de documents
scientifiques de niveau recherche, publiés ou non,
émanant des établissements d’enseignement et de
recherche français ou étrangers, des laboratoires
publics ou privés.
Inverse modeling of the hydrological and the
hydrochemical behavior of hydrosystems:
Characterization of Karst System Functioning
J.-L. Pinault, V. Plagnes, L. Aquilina, M. Bakalowicz
To cite this version:
J.-L. Pinault, V. Plagnes, L. Aquilina, M. Bakalowicz. Inverse modeling of the hydrological and the
hydrochemical behavior of hydrosystems: Characterization of Karst System Functioning. Water
Re-sources Research, American Geophysical Union, 2001, 37 (8), pp.2191-2204. �10.1029/2001WR900018�.
�hal-03125277�
WATER RESOURCES RESEARCH, VOL. 37, NO. 8, PAGES 2191-2204, AUGUST 2001
Inverse modeling of the hydrological and the hydrochemical
behavior of hydrosystems:
Characterization of karst system functioning
J.-L. Pinault, V. Plagnes,
• and L. Aquilina 2
Water Research Division, Bureau de Recherches G6ologiques et Mini6res, Orl6ans, France
M. Bakalowicz
Hydrosciences, Institut des Sciences de la Terre, de l'Eau et de l'Espace de Montpellier CNRS and Universit• Montpellier II, Montpellier, France
Abstract. Inverse modeling of mass transfer characterizes the dynamic processes affecting the function of karst systems and can be used to identify karst properties. An inverse model is proposed to calculate unit hydrographs as well as impulse response of fluxes from rainfall-runoff or rainfall-flux data, the purpose of which is hydrograph separation. Contrary to what hydrologists have been doing for years, hydrograph separation is carried out by using transfer functions in their entirety, which enables accurate separation of fluxes, as was explained in the companion paper [Pinault et al., this issue]. The unit hydrograph as well as impulse response of fluxes is decomposed into a quick and a slow component, and, consequently, the effective rainfall is decomposed into
two parts, one contributing
to the quick flow (or flux) and the other contributing
to the
slow flow generation. This approach is applied to seven French karstic aquifers located onthe Larzac plateau in the Grands Causses
area (in the south of France). Both
hydrodynamical and hydrogeochemical data have been recorded from these springs over several hydrological cycles. For modeling purposes, karst properties can be represented by the impulse responses of flow and flux of dissolved species. The heterogeneity of aquifers is translated to time-modulated flow and transport at the outlet. Monitoring these fluxes enables the evaluation of slow and quick components in the hydrograph. The quick component refers to the "flush flow" effect and results from fast infiltration in the karst conduit network when connection is established between the infiltration and phreatic zones, inducing an increase in water head. This component reflects flood events where flow behavior is nonlinear and is described by a very short transfer function, which increases and decreases according to water head. The slow component consists of slow and fast infiltration, underground runoff, storage in annex-to-drain systems, and discharge from the saturated zone. These components can be further subdivided by measuring chemical responses at the karst outlet. Using such natural tracers enables the slow component of the unit hydrograph to be separated into preevent water, i.e., water of the reservoir and event water, i.e., water whose origin can be related to a particular rainfall
event. These measurements can be used to determine the rate of water renewal. Since the
preevent water hydrograph is produced by stored water when pushed by a rainfall event and the event water hydrograph reflects rainwater transfer, separating the two components can yield insights into the characteristics of karst aquifers, the modes of infiltration, and the mechanisms involved in karstification, as well as the degree of organization of the aquifer.
1. Introduction
Karst systems are characterized by their hydrological re- sponse (i.e., the flow at the spring), which is not linearly related to input (rain). During intensive rainfall a flood event may occur at the outlet of the system that is not governed by the
1Now at Laboratoire des Sciences du Climat et de l'Environnement,
CNRS, Gif-sur-Yvette, France.
2Now at Gfiosciences Rennes, CNRS UPR 4661, Rennes, France.
Copyright 2001 by the American Geophysical Union.
Paper number 2001WR900018.
0043-1397/01/2001WR900018509.00
same hydrologic rules when outflow is low. Such a phenome- non is due to the heterogeneity of the karst structure and makes the porous modeling concept inadequate.
In order to take into account the heterogeneity of karstic media, global modeling is required at the catchment scale, i.e., the scale that corresponds to the karst drainage hierarchical structure in its entirety. Different models have been developed at this scale. All of them try to describe different kinds of reservoirs by reproducing some elements of karst structure. However, since the structure of aquifers is itself poorly con- strained and extremely variable from one aquifer to another, the approach of these models is too general. To overcome this difficulty, we have taken the completely different approach of
2192 PINAULT ET AL.: INVERSE MODELING--KARST SYSTEM FUNCTIONING
inverse modeling. Such modeling does not try to link the re- sponse of the karst at the outlet to the structure of the natural system but instead attempts to find the best fitting mathemat- ical relationship between input and output variables using transfer functions, i.e., the response of the hydrosystem to a rainfall event. This mathematical relationship results from a consideration of all the physical and chemical processes occur- ring in the system and enables hydrochemical and hydrody- namical information about the aquifer to be deciphered.
An inverse model is proposed to calculate unit hydrographs as well as the impulse response of fluxes from rainfall-runoff or rainfall-flux data, the purpose of which is hydrograph separa- tion. Contrary to what hydrologists have been doing for years, hydrograph separation is carried out by using transfer func- tions in their entirety, which enables accurate separation of fluxes. This new approach requires the transfer functions re- lated to flow and fluxes to be calculated accurately, as was explained by Pinault et al., [this issue].
Inverse modeling has been applied to flow and mass trans- port in a French karstic aquifer complex, the Larzac plateau, Grands Causses area, in the south of France. Seven springs, outputs of seven independent karstic systems, have been hy- drodynamically and hydrogeochemically monitored over sev- eral hydrological cycles [Plagnes, 1997].
urated zones, different processes are responsible for mass
transfer. Quick flow is related to wide fissures and karst con-
duits, while slow flow is attributed to either: (1) karst voids connected to conduits with high head losses (such as those that exist in annex to drain systems) or (2) tight fissures, fine cracks, and the porosity of matrix. Conduits (drains) in the saturated zone as well as wide open channels in the infiltration zone cause water to experience a short residence time. These struc- tures also drain out water with progressively longer residence time because of either slow infiltration or storage in the satu-
rated zone.
The flush flow effect is characterized by a sudden flow in-
crease when a succession of abundant rainfall events occurs
while soil recharge is near zero in winter. In order to model this flow increase a quick component has to be introduced in the transport equation since no linear model is able to explain flow and flux evolution over a whole hydrological cycle. The ampli-
tude of flush flow effect is variable from one karst to another;
however, the very short impulse response associated with flush flow effect in all springs suggests that a sudden head increase occurs when a hydraulic continuity is settled between the epikarst, infiltration, and phreatic zones. A conceptual model for the generation of base, slow, and quick flow is proposed in Figure 1.
2. Karst Structure and Model Definition
2.1. Karst Structure
Karst hydrology and g½omorphology have been extensively studied, especially over the last 2 decades [B6gli, 1980; Drey- brodt, 1988; Ford and Williams, 1989; Jennings, 1985; Milanovic,
1981; Thrallkill, 1968; •ite, 1988; Gbze, 1965; Nicod, 1972;
Mangin, 1994; Naute et al., 1997]. The karstic aquifer is the center of dynamic processes (flow and fluxes), determined by input (rainfall, ½vapotranspiration, and dissolved species) and output (flow and fluxes at outlet). Recharge of a karst aquifer
occurs either concentrated at the contact between nonkarstic
and karstic terrains, through swallow holes (point recharge), or spread out over the karstic surface through the infiltration zone (dispersed recharge). Point recharge is only controlled by runoff and is defined as fast infiltration, while dispersed re- charge is controlled by runoff as well as diphasic infiltration
identified as slow infiltration.
In the upper part of the infiltration zone another structure, the epikarst, can develop in the weathered portion of a karst aquifer. An epikarst is a high-porosity zone that can store groundwater locally and seasonally and thus delays infiltration into other zones. During floods the epikarst may be flushed with water, and recharge of the saturated zone occurs by direct and fast infiltration. During other periods the epikarst contrib- utes to delayed recharge via slow infiltration. As in porous media, complete mixing of waters infiltrated at different time may not occur along slow infiltration profiles, possibly leading
to vertical stratification.
The karst structure is usually divided into different parts, the saturated and unsaturated zones, the latter sometimes being differentiated by an epikarstic structure. However, these zones are not homogeneous, and different kinds of flow can take place in each of them. In the saturated zone, karst develops in a more complex way because of the existence of a horizontal flow component.
Because karst processes develop a karst conduit network that is a drainage structure through both unsaturated and sat-
2.2. Model Definition
Inverse modeling provides constraints on the dynamic pro- cesses occurring in karst systems and can help to identify karst properties. These properties can be represented by the impulse responses of flow and mass transport or fluxes (the response of the hydrogeological system after an isolated rainfall event). As some authors [e.g., Sherman, 1941; Bakalowicz, 1979; Mangin, 1984, 1994] assume, the heterogeneity of an aquifer is related to time-modulated flow and transport at the outlet, and so time
variations in flow rate and chemical contents should reflect
space heterogeneity in flow and in water quality inside the aquifer. Our model has the following structure: (1) The input of the system is defined as the amount of rainwater inducing a flow variation. The threshold •(t), variable with time, defines the "effective rainfall," i.e., the part of rainfall that induces flow variation. (2) The effective rainfall is then separated into the quick and slow components. The parameter a(t), variable with time, defines the relative proportions of each component at any time. (3) Transfer functions are separated into the quick
I'q and slow
F, impulse
responses,
respectively.
The temporal
analysis of flow enables the evaluation of the slow and quick components of the hydrograph. The slow component includes slow, delayed, and fast infiltration, underground runoff, stor- age in annex-to-drain systems (or porous matrix), and dis- charge from the saturated zone. This slow component may also represent fast infiltration in large drains when the induced flow is linearly correlated to effective rainfall events. The quick component is related exclusively to the nonlinear process rep- resented by the flush flow effect, that is, mass transfer from the surface and from the epikarst that occurs through karst con- duits and fissures as a result of water head rising in the infil-tration zone after abundant effective rainfalls. This effect is the
result of fast infiltration in the drainage network when a hy- draulic continuity is established between the infiltration and phreatic zones, inducing an increase in head. This quick flow is superposed on the slow flow, with the relative proportions of each component being variable throughout the year and being closely linked to karst structure. Whereas the quick impulse
PINAULT ET AL.: INVERSE MODELING--KARST SYSTEM FUNCTIONING 2193
EVAPOTRANSPIRATION
RAINFALL EVAPOTRANSPIRATION RAINFALL
fS.OW,.F,'TRATIO"
• [ FAST,.F,'TRAT'O"
I !•(D,
RECT
OR
DE'A•D
U
•,(DIRECT
or
DELAYED)• (DIRECT)
[
I
.
I
OUTLET OUTLET EVAPOTRANSPIRATION SLOW INFILTRATION (DIRECT OR DELAYED)• .. ! U.E• OUTLET Low stage conditionRecharge condition
(slow and fast infiltration)High flood condition
(flush effect)Figure 1.
ADS
=
annex-to-drain
systems
.•
Slow
infiltration
.o•• preevent
water
.,• Fast
infiltration
,•'•'j event water
Conceptual representation of low stage, recharge, and high flood conditions.
response is very short as the flush flow effect suddenly ceases a few days after a rainfall event, the slow impulse response may
increase rapidly during fast infiltration and then decrease ac-
cording to transfer pathways. The slow impulse response may
thus disclose temporal structures related to spatial heteroge- neity of an aquifer.
The second part of this work aims at defining an impulse response for chemical elements used as natural tracers within the aquifer systems. This part is achieved in two steps. At first, input flux is expressed as effective rainfall height, tracer con- centration c in at the input being calculated by inverse model- ing. The effective flux corresponds to the input that induces a
response
in the outflux.
Estimation
of c in is related
to dissolu-
tion as well as dilution effects in different compartments of thesystem, those processes being fast enough to be considered as
instantaneous regarding the transfer time of tracers through
the hydrosystem.
Input concentration
c in is separated
into two input compo-
in and in that can be related to the quick and slownents C q C s
components, respectively, of the outflux, and appropriate im- pulse responses are calculated. A relevant set of natural tracers
enables the slow component of the unit hydrograph to be
separated into the preevent water, i.e., the water of the reser-
voir and event water, i.e., water whose origin can be related to a particular rainfall event.
The accurate decomposition of the whole hydrograph into
separate components allows the characterization of dynamic processes, especially the more or less rapid transfer of rainwa- ter (or its influence on the water stored in the system). Com- parison of hydrograph and chemiograph components empha-
sizes the characteristics of karst aquifers from which objective criteria can be defined for the identification of the degree of
organization of the aquifer and the different modes of infiltra-
tion, as well as the mechanisms involved in karstification.
3. Mathematical Modeling
and Numerical Analysis
3.1. Model for the Flow of the Springs
Spring flow is the sum of two components: (1) the slow component of the hydrograph, resulting from infiltration pro-
cesses in the unsaturated zone, which includes base flow that
2194 PINAULT ET AL.: INVERSE MODELING--KARST SYSTEM FUNCTIONING LA Le Tarn ,Boundoulaou Lavencou
... L-.,F,errand.
L'Esp•relle
La Dourbie BRUEL Le Soulzon La[La
Mouline
ITALET-DU-LARZ.•_C/ Durzon
I
t uebelleFousette
ß
..
\
_
Figure 2. Location of the Larzac plateau in the Grands Causses area.
COUVEI¾OIRADE
flow of the spring never exhausts during the year, even in summer when no effective rainfall occurs), and (2) the quick component of the hydrograph, whose contribution is only sig- nificant when the flush flow effect operates.
Every component has a particular temporal fingerprint: The slow flow induces a relatively quick increase in flow followed by a slow decrease with the relaxation time linked closely to water pathways. The base flow occurs over the whole hydrologic cycle, with a long relaxation time; the quick flow ceases as soon
as the water head is low enough to enable the flow to behave
in a linear manner.
The reconstruction of hydrographs into dominant slow and
quick components of flow leads to the equation of transport [Pinault et al., this issue, equation (1)]:
F(ti) = SIFs*Rs
+ Fq*RqJ(t•),
where F(t) is streamflow and S is the catchment area (the asterisk represents the discrete convolution product). Effective rainfall Reff(ti) is decomposed into two components:
geff(ti) -- R s (ti) q- Rq (ti) , where
R s (ti) and
Rq (ti) are
those parts of rainfall that induce the slow and quick compo-
nents of streamflow, respectively.
3.2. Model for Fluxes of Dissolved Species
in Spring Water
Dissolved species in spring water can be used as tracers of preevent and event water, as they characterize the infiltrated water or groundwater that has reached equilibrium with re-
spect to bedrock minerals before a rainfall event occurs. Tracer
concentrations in the saturated zone undergo slow variations
during a hydrological cycle according to complex dissolution
processes and may be perturbed by the size of a reservoir,
which is not infinite, and by successive dilution caused by
rainfall events. These variations are taken into account in c in.
Event water is channeled into the spring while the chemical
signature of infiltrated water is preserved. The pathways of water infiltration may include circuits that travel through the
saturated zone, and in spite of mixing between infiltrated water
and groundwater the signature of the infiltrated water is pre-
served because of its short transit time in the saturated zone.
Event water tracer concentration may vary throughout a hy- drogeological cycle according to the geochemical processes that are involved to mark rainwater at the input of the hydro-
PINAULT ET AL.: INVERSE MODELING--KARST SYSTEM FUNCTIONING 2195 mg/L (a) 6 Boundoulaou (CI) 5 4 3 , , , 08/09/95 17/12/95 26/03/96 04/07/96
mg/L
(b)
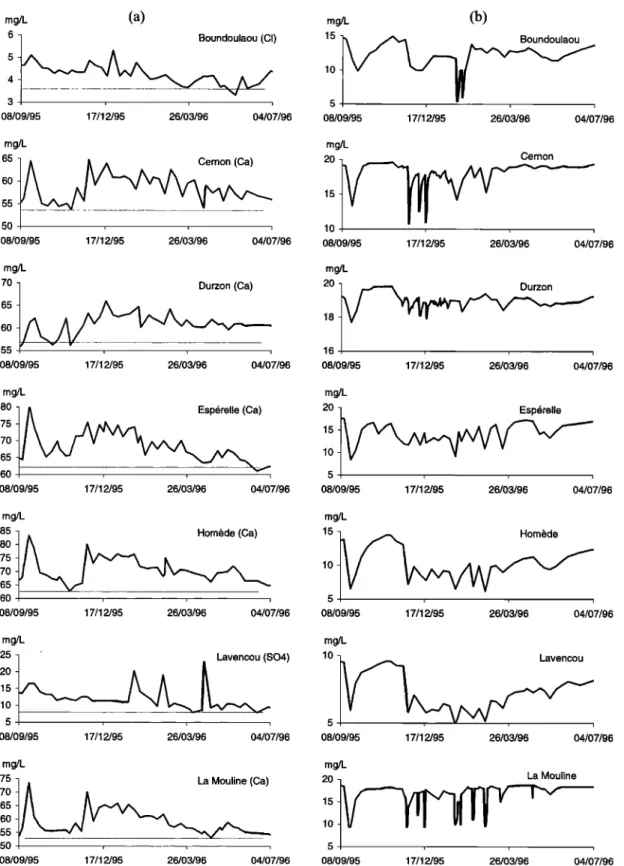
15 Boundoulaou 10 5 , 08/09/95 17/1 2/95 26/03/96 04/07/96 mg/L 65 6O 55 ... 50 , , , 08/09/95 17/12/95 26/03/96 04/07/96 mg/L 2O 15 10 Cernon , i 08/09/95 17/1 2/95 26/03/96 04/07/96 mg/L 70 Durzon (Ca) 65 6O 55 08/09/95 17/1 2/95 26/03/96 04/07/96 mg/L 20 Durzon 18 16 , 08/09/95 17/1 2/95 26/03/96 04/07/96 mg/L 8O 75 7O 65 08/09/95 17/1 2/95 26/03/96 04/07/96 mg/L 20 Esp6relle 15 10 5 08/09/95 17/1 2/95 26/03/96 04/07/96 mg/L 85 Hombde (Ca) 80 75 70 65 60 08/09/95 17/1 2/95 26/03/96 04/07/96 mg/L 15 10 5 Hombde 08/09/95 17/1 2/95 26/03/96 04/07/96 mg/L 25 Lavencou (SO4) 20 15 10 5 08/09/95 17/12/95 26/03/96 04/07/96 mg/L 10 Lavencou 5 08/09/95 17/1 2/95 26/03/96 04/07/96 mg/L 75 70 65 60 55 50 08/0 9/95 17/12/95 26/03/96 04/07/96 mg/L 20 La Mouline 15 10 5 08/09/95 17/12/95 26/03/96 04/07/96Figure 3. (a) Concentration of the event water tracer measured in the springs. (b) Concentration of Mg
measured in the springs.
4. Geological and Hydrogeological Setting
Previous studies of the Larzac plateau have considered dif- ferent aspects of the karst system including its geology, hydro- geology, hydrodynamics, and hydrogeochemistry [Ricard and Bakalowicz, 1996; Plagnes, 1997]. Because of the multidisci- plinary approaches already taken, this site has many advan-tages for the application of the inverse modeling method, in-
cluding the following: (1) The area is now well known; (2) a
large amount of hydrodynamical and hydrogeochemical data has been recorded over 3-5 hydrological years; (3) seven dif- ferent karstic springs have been studied over the same time period.
2196 PINAULT ET AL.' INVERSE MODELINGmKARST SYSTEM FUNCTIONING
Table 1. Mg Concentration Observed in Spring Water During the Studied Period June 26, 1995, to July 31, 1996 a
Spring Mean Concentration
Boundoulaou 11.49 Cernon 17.83 Durzon 18.94 Esp6relle 13.56 Hom•de 9.05 Lavencou 6.34 La Mouline 15.19
aMg is a marker of preevent water. It is assumed to be absent in event water. Concentration is given in mg/L.
m3/s 6 5 4 3 2 1 08/09/95 17/12/95 26/03/96 04/07/96 m3/s 3 2 1 0 08/09/95 17/1 2/95 26/03/96 04/07/96 4.1. Geological Setting
The Larzac plateau (Grands Causses) is located in the south
of France (north of Montpellier). The Grands Causses region, perched astride the Atlantic-Mediterranean watershed, is com- prised of Mesozoic sedimentary rocks surrounded by crystal- line rocks of the C6vennes Mountains. The Larzac plateau is bordered to the north by the deep gorges of the Dourbie River, to the west by the Tarn River, to the east by the Vis River, and to the south by the Lod•ve hills and the Seranne ridge.
4.2. Hydrogeological Setting
The general hydrogeological scheme of the Grands Causses area is relatively simple, consisting of two main carbonate aquifer units separated by a 300-m-thick sequence of blue- black marls. The lower aquifer has developed in calcareous
and dolomitic rocks of the Lower and Middle Lias, while the
upper carbonate unit consists essentially of Dogger and Malm
limestones and dolomites, about 600 m thick, and constitutes
the Larzac plateau and the cliffs in the gorges of the Dourbie
River.
Since the beginning of the Cretaceous the Grands Causses area has been subjected to a prolonged period of tectonic activity recording the evolution of the European continent. The area is presently being uplifted, with incision of the pla- teau by the existing surface flow network recorded by the development of spectacular gorges, 300 to 400 m deep, cut by the Tarn River and its tributaries (including the Dourbie Riv- er). All of the conditions required for the development of karstic drainage, controlled by the regional base level, are met
here.
The Larzac plateau, with an average elevation of 800 m, displays typical karstic landforms at the surface. Groundwaters
are drained by eight major springs (map of the area, Figure 2).
The Esp•relle and Durzon are the main springs draining the Larzac plateau toward the Dourbie River (annual discharge of
3.1 and 3.9 m3/s,
respectively,
and catchment
area of 100 and
124 km
2, respectively).
The Riou Ferrand
spring
also
contrib-
utes to the drainage of the northern part of the plateau but is inaccessible. The western edge of the plateau is drained toward the Tarn River by the Hom•de and Boundoulaou springs (totaldischarge
of 1.1 m3/s),
while
the southern
part of the northern
Larzac is drained by two main springs (Cernon with a dischargeof 0.5 m3/s
and La Mouline
with a discharge
of 0.9 m3/s)
and
several other minor springs toward the Cernon River. Most of the springs are tapped for drinking water. The limits of the catchment area of each spring, i.e., the karst system, have been defined by the geology and by using natural and artificial trac-m3/s 40 30 20 10 0 08/09/95 17/12/95 26/03/96 04/07/96 m3/s 25 20 ' 15 10 5 0 08/09/95 17/12/95 26/03/96 04/07/96 m3/s 4 3 Hombde 2 1 0 08/09/95 17/1 2/95 26/03/96 04/07/96 m3/s 1.5 I venoou 0.5 08/09/95 17/12/95 26/03/96 04/07/96 m3/s 2O 15 10 5 ,,_• o 08/09/95
_
^
•,.
ulile
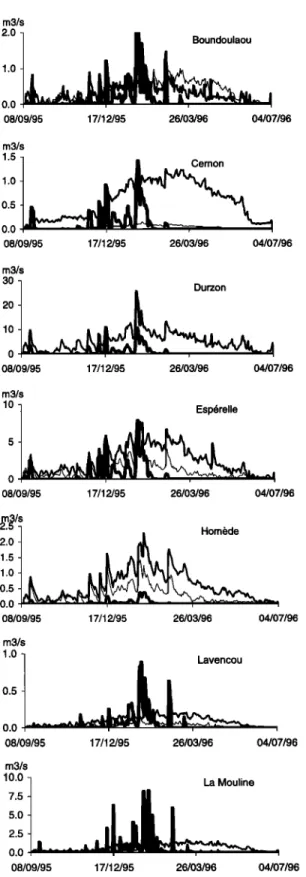
17/12/95 26/03/96 04/07/96Figure 4. Comparison between observed (bold lines) and calculated (fine lines) flows for every spring.
ing techniques [Ricard and Bakalowicz, 1996]. All these karst systems are unary systems, with only an authigenic recharge and without any point recharge from surface streams on im- permeable rocks through swallow holes.
PINAULT ET AL.' INVERSE MODELING--KARST SYSTEM FUNCTIONING 2197
m3/s
(a)
8 64
2iu
(GI)
0 , - "• /•' , , ^• •'• 08/09/95 17/12/95 26/03/96 04/07/96 m3/s (b) 4 3 Boundoulaou (Mg) 2 1 0 • 08/09/95 17/12/95 26/03/96 04/07/96 m3/s 4 3 Cernon (Ca) 2 1 0 • • 08/09/95 17/12/95 26/03/96 04/07/96 m3/s 3 2 Cernon (Mg) 1 - o 08/09/95 17/12/95 26/03/96 04/07/96 m3/s 5o 4o 3o 2o 10 08/09/95 17/12/95 26/03/96 04/07/96 m3/s 4o 3o 2o lO 0 • • • 08/09/95 17/1 2/95 26/03/96 04/07/96 m3/s 4O 20 10 08/09/95 17/12/95 26/03/96 04/07/96 m3/s 2O . lO o 08/09/95 17/12/95 26/03/96 04/07/96 m3/s 6 5 4 3 2 1 o, o8/o9/95[ [•..
....Hombde
(Ca)
, 7/12/95 26/03/96 04/07/96 m3/s 4 3 Hombde (Mg) 2 1 0 08/09/95 17/1 2/95 26/03/96 04/07/96 m3/s 3 2 1 o o8/o9/95 Lavencou (S04) 17/12/95 26/03/96 04/07/96 m3/s 1.5 1.0 0.5 0.0 O8/O9/95I . _.ta•
I . Lavencou
(Mg)
17/1 2/95 26/03/96 04/07/96 m3/s 3O 25 20 La Mouline (Ca) 15 10 5 0 • "' '^ /X.. , ,,• .a /•,- -- , 08/09/95 17/12/95 26/03/96 04/07/96 m3/s10• •uline (Mg)
5 08/09/95 17/1 2/95 26/03/96 04/07/96Figure
5. (a) Comparison
between
observed
(bold
lines)
and
calculated
(fine
lines)
differential
flux
of the
preevent
water
marker
for every
spring.
(b) Comparison
between
observed
(bold
lines)
and
calculated
(fine
lines)
flux of magnesium
used
as the preevent
water
marker.
5. Hydrochemical
Monitoring of the Springs
and Choice of Tracers
Weekly
sampling
of the seven
karstic
springs
was
conducted,
and samples
were
analyzed
for major
elements.
Daily sampling
was
adopted
during
flood
periods
[Plagnes,
1997],
while
hourly
flow measurements have been carried out since the end of 1994
for all springs.
By using
dissolved
species
as natural
tracers,
the
analysis
of fluxes
(the product
of the tracer
concentration
by
flow
rate) allows
the slow
component
of the unit hydrograph
to
be separated
into two subcomponents.
One component
is rel-
ative to the reservoir (preevent water), while the other com-ponent
refers
to infiltrated
water
that maintains
its chemical
signature
through
to the outlet (event
water).
2198 PINAULT ET AL.: INVERSE MODELING--KARST SYSTEM FUNCTIONING
Table 2. Catchment Areas Obtained From the Inverse Model and From Ricard and
Bakalowicz [1996] a
Catchment Area, km 2
Spring Derived From Inverse Model Derived From Ricard and Bakalowicz [1996] Bias, %
Boundoulaou 24 16.3 47 Cernon 24 16.6 45 Durzon 170 123.6 38 Esp6relle 140 98.0 43 Homede 26 18.6 40 Lavencou 5 3.7 35 La Mouline 38 28.3 34
aThe bias (-40%) results from rainfall sampling: Pluviometry measured in La Cavalerie is 40% lower than what is observed on the Larzac plateau.
trations (Figure 3b). This element is naturally present in the hydrosystem (in the saturated zone, infiltration zone, and epikarst) because of the dissolution of dolomite. Several weeks are required for water to be at equilibrium with dolomite because of slow kinetics, and this is much longer than the mean time between two successive rainfall events during the rainy season. Consequently, high magnesium rates (10-20 mg/L) characterize water that has remained isolated in the aquifer since the concentration of magnesium in rainwater is negligible (Table 1).
Rainwater can be identified using chloride, which can be considered a conservative tracer. The origin of chlorides within the karstic aquifer is twofold: atmospheric (the concentration is 1.2-2.5 mg/L in rainwater) and anthropogenic, the result of agricultural activities and breeding on the Causse, as well as waste water originating from housing and winter deicing of roads. Although the source of chloride is not exclusively me-
teoric, it can be considered as a natural tracer of event water
since dilution of chlorides in rainwater is very rapid. Neverthe- less, chloride can only be used as a tracer when there is a
mm/j
(a)
70 60 50 4o 30 2o 10 0 ] ] [ 08/09/95 17/12/95 26/03/96 04/07/96 70% (b)60% Bound•aou
Lavencou
50% Esp6relle+Cernon 40% uline 30%20%
•urzon
10% 0% 08/09/95 17/1 2/95 26/03/96 04/07/96Figure 6. (a) Effective rainfall threshold •(t) calculated for every spring. (b) Proportion of rainwater a(t) involved in quick flow for every spring.
contrast between its concentration in event water and in the
reservoir. This situation occurs when the anthropogenic con- tribution is increasing and is effectively buffered by the reser-
voir. When these conditions are not met, then another tracer
has to be used. Nitrate, whose origin is mainly anthropogenic,
could be used as a tracer of event water since dilution of
nitrates in rain water is very rapid during the leaching of soils.
However, nitrate and chloride concentrations are correlated,
and so nitrate cannot be used as an event tracer when chloride
has been discounted. In particular, both elements have the
same behavior where the contrast between infiltrated water
and reservoir water is concerned, probably because both reflect the evolution of human activity.
Calcium, which results from the dissolution of dolomite and
calcite, can be considered as a typical tracer of event water when dissolution in the epikarst occurs by CO2-enriched water at a more rapid rate than the transit time of infiltrated water (a few days), which is true in most cases. Owing to the precipita- tion of calcium when congruent dissolution of dolomite occurs
in the reservoir, a contrast is observed between the calcium
concentration in preevent and event waters [Plagnes, 1997]. Calcium is not suitable for tracing event water in the Lavencou spring because of the absence of a contrast between the con-
centration of calcium in event water and in the reservoir. On
the other hand, sulfate seems to behave as an event water
tracer although its dissolution occurs at the basement of the
formation when water is in contact with the Lias marls. Dis-
solution kinetics are probably very fast, and this process occurs before mixing of preevent and event waters since hydrograph reconstruction is made possible when magnesium and sulfate flux impulse responses are used, as will be demonstrated in
section 6.
Owing to the dilution effect a rainfall event induces a de- crease in magnesium concentration at the outlet of the karstic aquifer, whereas the event water tracer exhibits a positive anomaly. Figures 3a and 3b exhibit the symmetry between concentration curves for preevent and event water tracers.
6. General Analysis of Results
The sampling step used in calculations is 1 day, which is in good agreement with the transit time of infiltrated water. Con- centrations are linearly extrapolated except during flood peri- ods, when the sampling rate is 1 day. The time period studied extends over 1 whole hydrological year.
Figure 4 shows a comparison between the observed and the calculated flows for every spring. Good agreement is reached
PINAULT ET AL.: INVERSE MODELING--KARST SYSTEM FUNCTIONING 2199
mg/L
(a)
5 Boundoulaou (CI) 4 3 08/09/95 17/12/95 26/03/96 04/07/96mg/L
12 Boundoulaou (Mg) 9 6 3 08/09/95 17/12/95 26/03/96 04/07/96 mg/L 62 Cernon (Ca) 60 58 56 54 52 08/09/95 17/12/95 26/03/96 04/07/96 mg/L 20 Cernon (Mg) 15 10 5 0 08/09/95 17/12/95 26/03/96 04/07/96 mg/L 64 Durzon (Ca) 62 58 56 , , , 08/09/95 17/12/95 26/03/96 04/07/96 mg/L 25 Durzon (Mg) 20 10 0 ! • • 08/09/95 17/12/95 26/03/96 04/07/96 mg/L 76 Esp6relle (Ca) 66 61 56 , , 08/09/95 17/12/95 26/03/96 04/07/96 mg/L 20 Esp6relle (Mg) 15 10 5 0 08/09/95 17/12/95 26/03/96 04/07/96 mg/L 75 Hombde (Ca) 65 60 , , 08/09/95 17/12/95 26/03/96 04/07/96 mg/L 10 Hombde (Mg) 8 4 2 0 • • 08/09/95 17/12/95 26/03/96 04/07/96 mg/L20
1
••••=••._u (SO4)
10 5 , 08/09/95 17/12/95 26/03/96 04/07/96r•g/L
Lavencou
(Mg)
6 4 2 0 , 08/09/95 17/12/95 26/03/96 04/07/96 mg/L65
-•
La
Mouline
(Ca)
60 55 50 , , , 08/09/95 17/12/95 26/03/96 04/07/96 mg/L 15 La Mouline (Mg) 10 5 0 08/09/95 17/12/95 26/03/96 04/07/96Figure 7. Input concentrations relative to slow (bold lines) and quick (fine lines) transfer calculated from inverse modeling: (a) event water tracer and (b) magnesium.
over the whole studied period, proving that the assumption about the existence of two different flow components (slow and
quick) describes the function of the karst aquifer correctly; that is, the equation of transport (1) is valid at the catchment scale.
Nevertheless, only one hydrological cycle does not allow im-
pulse responses to be defined beyond 128 days. This truncation
prevents the model from fitting base flow of Cernon properly (Figure 4). Base flow cannot be removed from streamflow for shortening impulse responses because of hydrograph recon- struction. Comparable results are obtained for the flow and fluxes (Figures 5a and 5b).
2200 PINAULT ET AL.: INVERSE MODELING--KARST SYSTEM FUNCTIONING
Table 3. Concentration of the Event Water Tracer Observed in Spring Water During the Studied Period a
Spring Event Water Tracer C1 in Reservoir A[C1] Ca in Reservoir A[Ca] SO 4 in Reservoir /•[SO4]
Boundoulaou C1 3.44 0.82 68.63 4.94 <0 Cernon Ca 3.43 0.62 53.67 5.46 <0 Durzon Ca 4.45 0.74 55.89 5.79 -0 Espdrelle Ca -0 61.07 8.97 •0 Hom•de Ca -0 62.63 9.77 -0 Lavencou SO4 <0 <0 7.94 La Mouline Ca •0 52.85 7.84 5.31 •0
aOnly tracers such as Ac(i) > 0 can be used as markers of event water: Concentrations in event water must be higher than those of the reservoir (the higher the contrast, the more accurate the calculations). Tracer concentration in the reservoir is estimated from the base line. For the Lavencou spring the only tracer of event water is sulfate that originates from Lias marls. For Boundoulaou, Cernon, and Durzon both C1 and Ca can be used independently as event water tracers. Concentration of event water tracer is measured in mg/L.
calculated so that variable flow (the sum of slow and quick components) can be expressed according to rainfall for zero
evapotranspiration in winter. To meet these conditions, the
threshold a(t) is nearly tangent to the time axis in winter. These catchment areas are compared with those shown in Table 2 from Ricard and Bakalowicz [1996]. It is important to consider discrepancies between the modeled and measured values presented in Table 2. The values calculated from rain- fall/spring flow time series are systematically higher than the values from Ricard and Bakalowicz [1996] because of a defi- ciency in the rainfall sampling technique with only one rain gauge available at La Cavalerie and underevaluated rainfall
rates. Nevertheless, the bias between our model and the mea-
surements is constant everywhere across the plateau (around 4o%).
6.1. Functions D,,(t) and o•(t) Used in Inverse Modeling
of Spring Flow
The effective rainfall threshold l•(t), i.e., the minimum rain- fall height that generates an increase in flow from the spring, is represented in Figure 6a. Epikarst recharge is strongly linked to delayed infiltration contributing to base flow. At the end of summer, recharge reaches 40 mm/d in 1995 and 60 mm/d in 1996 for every spring because, owing to fast and delayed infil- tration, epikarst discharge occurred during the dry season. The threshold l•(t) decreases more or less rapidly in autumn, de- pending upon both the storage capacity of the unsaturated zone and delayed infiltration. Recharge does not occur in win- ter, and the effective rainfall threshold undergoes small mod- ulations in spring according to rainfall events. All thresholds
are almost indiscernible from karsts to karsts.
Figure 6b exhibits the proportion of rainwater involved in the flush flow effect a(t). The amplitude of the flush flow effect is strongly variable both during the year and between karst systems. It decreases more or less rapidly after rainfall events, depending on karst conduit structure.
in and in Used in Inverse
6.2. Input Concentrations c s Cq
Modeling of Fluxes
Figures 7a and 7b show the input concentrations
C
_ins and Cq
infor both tracers. Those concentrations are expressed as trigo- nometric series, the periodicity of which is one cycle a year. They reflect the temporal variability of the event water tracer
concentration at the input of the hydrosystem (Figure 7a) as
well as the preevent water tracer concentration in the reservoir
(Figure 7b). Event water tracer concentration is expressed in
comparison with the base concentration represented in Figure
3a and Table 3, i.e., the event water tracer concentration in the
reservoir.
Temporal variability of Ca input concentration in event wa- ter is significant for Cernon, Esp•relle, and La Mouline since
this concentration is close to the base concentration during
spring, which means that the contrast between input concen-
tration and concentration in the reservoir vanishes after abun- dant effective rainfall events because of the dilution of inter-
in and
stitial water in the unsaturated zone. The components c s in
C q are relatively close when significant quick transfer occurs
during midwinter.
in and in behave differ-
As for chloride,
the components
c s
Cq
ently, and the concentration contrast is especially marked in quick transfer, which may result from anthropic activity in winter. The same observation is valid for sulfate, which may be due to its precipitation during the slow transfer; the geochemistry of sulfate is poorly known in this particular
context.
Temporal variability of magnesium concentration in the res- ervoir strongly depends on the karst. In some of the karst
systems the reservoir acts as a buffer (Durzon and Hom•de).
In Durzon, the buffer effect may be due to the dissolution of
magnesium in the unsaturated zone; other observations will
corroborate this assumption when the hydrographs are recon- structed. In Homade the absence of quick transfer may en- hance magnesium dissolution in the saturated zone.
6.3. Slow Components of the Unit Hydrographs
Figure 8a shows'the slow components of normalized impulse responses for flow and fluxes for every karst. Slow components
of impulse responses behave differently according to the spring
concerned, and they contain information about the structure of
the karsts, i.e., the conduit network. At first, impulse responses
exhibit a sharp increase owing to fast infiltration following a rainfall event and then decrease in intensity when slow or
delayed infiltration occurs, with relaxation time being closely
linked to water pathways. At the end of the time period the responses disperse as mass transport is ruled by discharge from both phreatic and unsaturated zones. The normalized impulse response of the event tracer flux is shorter than the unit hy- drograph because event water loses its identity when it is in transit for long periods of time because of mixing processes. In contrast, the impulse response of preevent water increases less
rapidly after the rainfall event than the unit hydrograph since
spring water results from the mixing of both preevent and
event water.
6.4. Hydrograph Separation
Hydrograph separation provides relevant information about the contribution of preevent and event water to the flow of the
PINAULT ET AL.' INVERSE MODELING--KARST SYSTEM FUNCTIONING 2201 0.12 o.os ;',
0.04 "•
0.00 , ' 0 (a) Boundoulaou • ;10. 20 lag time (days) 50
(b) 0.08 Boundoulaou 0.06
0.04
,••.•
0.02
0.00 , • , -0 10 20 lag time (days) 50
0'04
1•,
• m\ ••
-Cernon
0.02 ' , ,, :, ,. ',
0.00
0 10 20 lag time (days) 50
0.02
0.01
0.00
Cernon
0 10 20 lag time (days) 50
0.10
0.05
0.00
i•,
Durzon
ß . •
0 10 20 lag time (days) 50
0.15
]
ß
Esp•relle
0.10
:,,,
0.05 ' •'
0 10 20 lag time (days) 50
0.08 0.06 0.04 0.02 0.00 Durzon
0 10 20 lag time (days) 50
0.08 .
0.06 0.04 0.02
0.00 ...
0 10 20 lag time (days) 50
0.15 0.10 0.05 0.00 Hom•de
'
0 10 20 lag time (days) 50
0.08 0.O6 0.04 0.02 0.00 Hom•de
0 10 20 lag time (days) 50
0.05
0.04
t ;'
Lavencou
0.03 ' • .•, •0.02 •
ß , t
,, ,
O.Ol o.ooo lO 20 lag time (days) 50
0.04
0.02
0.00
Lavencou
0 10 20 lag time (days) 50
0.20 0.15 0.10 0.05 0.00
]!;
La
Mouline
, , , ,0 10 20 lag time (days) 50
0.08
La
Mouline
0.O6 0.04
0.02
_•/•
o.oo , , , ,-T-'- , •I
0 10 20 lag time (days) 50
Figure 8. (a) Normalized
impulse
responses:
unit hydrograph
(bold
lines)
and impulse
responses
of fluxes
relative
to the preevent
water
tracer
Mg (fine lines)
and to the event
tracer
(dotted
lines).
(b) Comparison
of
the slow component
of unit hydrograph
(bold lines) and its reconstruction
from the two subcomponents
relative to preevent and event water (fine lines).springs. Fitting the impulse response of the flow (the slow component) to the two weighted impulse responses calculated
for both tracers carries out this separation. Such an approach
is useful for checking the validity of using tracers for partition-
ing the flow into preevent and event water and, consequently,
to ascertain the conformity of the model. Hydrograph recon-
struction from both components is shown for every spring in Figure 8b. Weighting factors obtained from the least squares
2202 PINAULT ET AL.: INVERSE MODELING--KARST SYSTEM FUNCTIONING
Table 4. Contribution of the Different Components of Flow Over the Whole Studied Period a
Event
Spring Quick Transfer, % Water, % Preevent Water, % Storage Ratio, hm3/km 2
Boundoulaou 15.2 39.3 (32.4) 45.5 (52.4) 0.1058 Cernon 11.8 5.9 (3.6) 82.3 (84.5) 0.3473 Durzon 12.1 0.0 (0.0) 87.9 (87.9) 0.2111 Esp•relle 11.7 28.7 59.7 0.0458 Hom•de 2.9 30.2 66.8 0.0967 Lavencou 27.1 18.7 54.2 0.1179 La Mouline 28.1 15.1 56.7 0.6471
aThe storage ratio is the dynamic storage (hm 3 = 10 6 m 3) related to the extension of the recharge area (in km 2) from Ricard and Bakalowicz
[1996].
method are represented in Table 4; the part of transfer func- tions involved in calculations is such that the lag time is in- cluded between 0 and 50 days. Although transfer function order is 128, only the beginning of transfer functions is reliable enough to calculate weighting factors, owing to the shortness of the period of observation.
In the case of Boundoulaou, Cernon, and Durzon both chlo-
ride and calcium are identified as useful event water tracers.
Weighting factors obtained from both tracers are not signifi- cantly different, although dissolution kinetics of chloride in rainwater is more rapid than the kinetics for calcium. Calcium dissolution is slightly postponed for Cernon spring, with the reconstructed hydrograph plotting significantly below the unit hydrograph as long as the lag is less than 3 days (Figure 8b).
Hydrograph separation into preevent and event waters can- not be performed for Durzon since impulse response of mag- nesium flux is very close to the unit hydrograph because mag- nesium concentration behaves steadily throughout the hydrological cycle (Figure 3), which discloses the presence of magnesium in the so-called event water, because of its long residence time in the epikarst, as shown by field investigations [Bakalowicz, 1994; Plagnes, 1997]. It seems that every effective rainfall event flushes the water that was stored previously in the epikarst while magnesium dissolution partly occurred. This suggests that no significant mixing occurs between preevent and event water, leading to stratification. For this reason we
cannot calculate tracer concentration in event water because
both preevent and event water tracers are present simulta- neously. The characteristic behavior of stored water in this environment is due to the high storage capacity of dolomite, since epikarst develops at the top of a thick carbonated series without any karst conduit in the infiltration zone because per- meability is low. In other words, two independent reservoirs are required to explain karst functioning, a deep saturated, or phreatic, zone characterized by high magnesium concentra-
tion, calcium concentration close to the base concentration
(about 55 rag/L, Table 2), and a perched saturated zone char- acterized by high concentrations of magnesium, calcium, and
chloride.
The contribution of different flow components, averaged over the studied periods, is represented in Table 4 for all springs. The main contribution is from the slow component. Nevertheless, the flush flow effect is substantial in many springs, especially for Lavencou and La Mouline. For both karsts, quick transfer prevails over slow transfer during winter. Particularly low is the contribution of quick flow in Hom•de, and this karst behavior may be considered as linear for the whole studied period.
Figure 9 shows the decomposition of hydrographs into the
quick component and two slow subcomponents relative to preevent and event water for every spring. The flush flow effect is significant from the beginning of January to the end of February for most springs, Hom•de excepted. For Lavencou and La Mouline, quick transfer constitutes the main part of spring flow.
6.5. Analysis of Unit Hydrographs
The spatial heterogeneity of the saturated and unsaturated zones is expressed by time-modulated flow at the outlet. If a drain permits fast flow, the shape of the flow (or the flux) impulse timing is sharp while the presence of reserves and constricted drains will modulate the floods, dispersing the karstic aquifer response [Mangin, 1994]. Impulse responses for preevent water give information about stored water, whereas impulse responses for event water describe infiltration pro- cesses.
Once the validity of tracers is verified from the hydrograph separation, impulse responses of tracer fluxes represent the unit hydrograph of preevent and event water. The more com- plex the structure of unit hydrographs relative to preevent
water is, the more intricate is the drainage system in the stor-
age zone because head losses cause dispersion of karst re- sponse after a rainfall event. The structures of unit hydro- graphs relative to event water reflect infiltration processes in the unsaturated zone because they show the elapsed time, after
a rainfall event, when event water flows at the outlet. The more
prevailing the slow infiltration is, the lower is the pulse height that follows a rainfall event. Event water unit hydrographs generally show a recession curve that indicates the operation of slow and delayed infiltration in the unsaturated zone.
In Figure 10 every karst system is represented according to the mean lag time of their normalized impulse responses for both preevent and event water. This representation aims to reveal the permeability of the drains of event and preevent water. The alignment of points is startling, Cernon would have been very close to the straight line if the preevent water trans- fer function had not been truncated. Mean lag time of preevent water is underevaluated for Durzon since magnesium dissolu- tion in the upper part of the aquifer makes the unit hydrograph and the magnesium transfer function indiscernible. The dis- tance of the point that represents Lavencou to the line may be
due to the absence of a reliable tracer for the calculation of the
event water transfer function: Sulfate is a last resort, but it does not mark event water only since its dissolution occurs at the
basement of the formation. Probably, the sulfate flux transfer function is a linear combination of both the preevent and the event water transfer functions, which would explain why hy- drograph separation could be performed accurately.
PINAULT ET AL.' INVERSE MODELING--KARST SYSTEM FUNCTIONING 2203 m3/s 2.0 1.0
0.0,
,
,
08/09/95 17/12/95 26/03/96 04/07/96 m3/s 1.5 1.0 0.5 0.0 , , , 08/09/95 17/1 2/95 26/03/96 04/07/96 m3/s 3O 2O 10O,
08/09/95 17/1 2/95 26/03/96 04/07/96 m3/s 10 5 O8/O9/95 Esp6relle 17/1 2/95 26/03/96 04/07/96 m3/s 2.5 . 2.0 1.5 1.0 0.5 0.0 08/09/95 17/12/95 26/03/96 04/07/96 m3/s 1.0 Lavencou 0.5 0.0 , , - , 08/09/95 17/12/95 26/03/96 04/07/96 m3/s 10.0 ß 7.5 5.0 2.5 0.0 08/09/95 17/12/95 26/03/96 04/07/96Figure 9. Hydrograph separation into quick flow (bold lines), preevent (fine lines), and event (medium lines) water
hydrographs for every spring. Preevent water of Durzon in-
cludes the water stored in the epikarst as well as in the satu- rated zone. Lavencou is represented, although the separation between preevent and event water may be biased.
preevent water (days)
75
1
La
Mouline/
70
1
ß/1• Cernon
65
J
Boundou•ou
ß (Lave•ou)
60 55,urzo,
4540 © ombde
25 30 35 40 45 50 55event water (days)
Figure 10. The karsts are represented according to the mean lag time associated with event water (x axis) and preevent water (y axis) unit hydrographs. The more intricate the con- duit network is, the longer the mean lag time is.
Since the mean lag time of water in transit reflects the head losses, i.e., the degree of interconnection as well as the size of drainage circuits, it seems that the structures of unsaturated and saturated zones undergo the same evolution scheme. Probably, the mean lag time decreases throughout karst evo- lution, because both physical and chemical erosion shape the circuits, favoring drainage. Within this evolution scheme the most advanced karsts are Esp6relle and Hom•de whose unit hydrographs exhibit a broad peak after an effective rainfall
event occurs.
7. Synthesis of Karst Characteristics
The main features of Larzac plateau karst systems can be deduced from the analysis of impulse responses by linking the temporal response of the flows to the spatial structure of both storage and infiltration zones.
7.1. Esp6relle and Homi•de
Since event water unit hydrographs exhibit both a high pulse height and a relatively long impulse response, Esp6relle and Hom•de are characterized by the dual permeability of the unsaturated zone. Impulse responses show numerous struc- tures that correspond to the stimulation of the phreatic zone discharge as a result of delayed transport of event water. These structures are particularly well marked in Hom•de impulse responses, and three periods during which stored water dis- charge is stimulated by new water infiltration can easily be identified. The proportion of event water is nearly 30% for both springs. Obviously, this event water is temporarily stored in epikarst and is pushed out by successive rainfall events.
7.2. Cernon and Durzon
Although the mean lag times relative to preevent and event water are different for Cernon and Durzon, both karst systems are characterized by the existence of two differentiated reser- voirs, the saturated zone, and the epikarst. Preevent water is marked by a high concentration of magnesium (Figure 7b), probably due to the high partial pressure of CO2 in stored water. For the Durzon spring the flow and the magnesium flux impulse responses are confused, and the proportion of event water in spring water is very low. The unit hydrograph exhibits