HAL Id: halshs-00543967
https://halshs.archives-ouvertes.fr/halshs-00543967
Preprint submitted on 7 Dec 2010HAL is a multi-disciplinary open access archive for the deposit and dissemination of sci-entific research documents, whether they are pub-lished or not. The documents may come from teaching and research institutions in France or abroad, or from public or private research centers.
L’archive ouverte pluridisciplinaire HAL, est destinée au dépôt et à la diffusion de documents scientifiques de niveau recherche, publiés ou non, émanant des établissements d’enseignement et de recherche français ou étrangers, des laboratoires publics ou privés.
Impact of information on intentions to vaccinate in a
potential epidemic: swine-origin Influenza A (H1N1)
Olivier Chanel, Stephane Luchini, Sébastien Massoni, Jean-Christophe
Vergnaud
To cite this version:
Olivier Chanel, Stephane Luchini, Sébastien Massoni, Jean-Christophe Vergnaud. Impact of infor-mation on intentions to vaccinate in a potential epidemic: swine-origin Influenza A (H1N1). 2010. �halshs-00543967�
1
GREQAM
Groupement de Recherche en Economie Quantitative d'Aix-Marseille - UMR-CNRS 6579 Ecole des Hautes études en Sciences SocialesUniversités d'Aix-Marseille II et III
Document de Travail
n°2010-51
Impact of information on intentions to
vaccinate in a potential epidemic:
swine-origin Influenza A (H1N1)
Olivier CHANEL
Stéphane LUCHINI
Sébastien MASSONI
Jean-Christophe VERGNAUD
December 2010
Impact of information on intentions to vaccinate in a potential epidemic:
swine-origin Influenza A (H1N1)
1Olivier Chanel, CNRS-GREQAM-IDEP, Marseille Stéphane Luchini, CNRS-GREQAM-IDEP, Marseille
Sébastien Massoni, CNRS-CES, Université Paris 1 Panthéon-Sorbonne, Paris Jean-Christophe Vergnaud, CNRS-CES, Université Paris 1 Panthéon-Sorbonne, Paris
November 2010
Abstract
Vaccination campaigns to prevent the spread of epidemics are successful only if the targeted populations subscribe to the recommendations of health authorities. However, because compulsory vaccination is hardly conceivable in modern democracies, governments need to convince their populations through efficient and persuasive information campaigns. In the context of the swine-origin A (H1N1) 2009 pandemic, we use an interactive study among the general public in the South of France, with 175 participants, to explore what type of information can induce change in vaccination intentions at both aggregate and individual levels. We find that individual attitudes to vaccination are based on rational appraisal of the situation, and that it is information of a purely scientific nature that has the only significant positive effect on intention to vaccinate.
Keywords: France; experiment; interactive; information; vaccination; influenza A (H1N1);
attitudes
1
This work was partly supported by program "Riskemotion" ANR-08-RISKNAT-007-01 and a grant from ASTS-PACA. S. Massoni was supported by a Ph.D. fellowship from the Ministère de l'Enseignement Supérieur et de la Recherche. The authors thank the Provence-Alpes-Côte-d'Azur Regional Council and IDEP for technical support, M. Sweetko and M. Teschl for their comments on the manuscript, and two anonymous referees for helpful suggestions. Because no nominative information was collected and no medical or physical act was involved, under French regulations ethics approval was not required and informed consent did not need to be sought from the participants. At the beginning of the survey, participants were given a short summary of the experiment and were told the following “We guarantee the absolute confidentiality of your answers, which are fully anonymous and will only be used for the purposes of scientific research. At no time will we be able to identify you with your answers; only a number links your answers to the different parts of the survey. You have the choice to participate or not”. Corresponding author: Olivier Chanel, e-mail: chanel@univmed.fr.
Introduction
On 18 January 2010, WHO Director-General Dr Margaret Chan said about the swine-origin 2009 A (H1N1) influenza virus: “we did not anticipate that people would decide not to be vaccinated. (…) In today’s world, people can draw on a vast range of information sources. People make their own decisions about what information to trust, and base their actions on those decisions.” (Chan, 2010).
The case of swine flu (H1N1) demonstrates that the public’s support is essential for the success of a vaccination campaign. Epidemiology usually has little to say about behavioral considerations (see Daley & Gani, 2001; Medlock & Galvani, 2009; Yang Yang et al., 2009; Eisenberg, et al., 2009; or Wallinga et al., 2010), while economic theory suggests that since vaccination campaigns may be plagued by an externality problem, people do not take into account the positive effect their vaccination has on others and a type of prisoner dilemma arises (see Brito et al., 1991; Geoffard & Philipson, 1997; Francis, 2004; Gersovitz & Hammer, 2004; or Boulier et al., 2007). The cost effectiveness ratio of the vaccination campaign to prevent the spread of swine flu is defined as the ratio of the cost of the campaign to the number of flu cases avoided. It was computed according to epidemiological forecasts and based on the hypothesis that all the vaccines bought were actually injected. However, the real cost effectiveness ratio ends up as very high in countries where a large proportion of the population refused to be vaccinated (less than 10% in Italy, France, United Kingdom, Belgium, China or Mexico for instance, French Senate Report, 2010).
The fact that the health authority has to choose the number of vaccine doses well in advance implies that public support for a vaccination campaign is a crucial policy variable in the efficiency of a health policy (Enserink, 2004). In France, the health authority clearly did not manage to counteract the rapidly formed public reservations about the value of being vaccinated (according to major French opinion poll institutes). Indeed, Table 1 shows that after a majority willingness in early September 2009, the great majority of French citizens refused to be vaccinated, even in mid-December which marked the first epidemic peak in France and the beginning of the vaccination campaign. Luckily, since the swine flu was less severe than a seasonal flu, the consequences were only financial.
However, this decreasing trend in intentions to vaccinate does not indicate flagging public concern about swine flu, as shown by the Web search volumes on Google for the most common French term for swine flu (“grippe A”).
[FIGURE 1 ABOUT HERE]
Hence, intentions to vaccinate and the need for information regarding swine flu do not seem to evolve in the same direction. Yet almost no in-depth studies have examined how, and to what extent, these trends may be linked. Note however two studies on a similar topic, that respectively assess whether perceptions of the swine flu outbreak affected changes in behavior (Rubin, et al., 2009), or the effects of information framing on intentions to vaccinate self or female children against human papillomavirus (Leader, et al., 2009). Herein, we propose an experiment examining how different types of information - related to others' intentions on vaccination, public opinion about a swine flu vaccination campaign, others' beliefs about a swine flu pandemic, or quantitative scientific information provided through experts - can influence vaccination decisions.
Method
Experimental design
Every year, a non-academic conference entitled « Sciences and Citizenship » is held in Marseilles, the second largest French city, at the Provence-Alpes-Côte-d'Azur (PACA) regional council voting room. It is open to the general public, and announced through advertisements in local newspapers and via different mailing lists. On December 3, 2009, we recruited all 175 attendees at this conference during a one-hour slot devoted solely to the experiment. Prior to the experiment, participants were questioned about their socio-economic background, beliefs and knowledge and attitudes to vaccination, as well as health status. The experiment consisted of interactive questions eliciting respondents’ intentions and opinions regarding swine flu vaccination. Intentions were elicited by providing participants with five options corresponding to a gradient in the likelihood of vaccination: “No, I will not get vaccinated”, “I will probably not get vaccinated”, “I do not know”, “I will probably get vaccinated”, “Yes, I will get vaccinated”.
Data were collected using an electronic voting system that records participants' choices in real time (see also Chanel et al., 2006, who use the same electronic voting system to elicit willingness to pay to reduce air pollution related effects). This gives immediate feedback to participants via individual screens, large public screens and over loudspeakers, to ensure that all respondents have the same information. Intentions to vaccinate are elicited five times, a different type of information being provided before each eliciting of intentions.
Participants start by expressing their initial intention regarding vaccination (stage 1).
Stage 1: “Do you intend to be (or have you already been) vaccinated against swine flu?”
At this stage, no information is provided about swine flu, therefore initial intentions are based on the prior stock of information and experience of participants. The result of this vote is then presented to the participants, who are again asked their intentions (stage 2). They can either revise their intentions on vaccination expressed in stage 1 or stick to their initial choice.
Stage 2: “Now that you know the participants’ intentions regarding vaccination, do you intend to be vaccinated (or for those who have already been vaccinated, if you had to choose again now, would you still be vaccinated) against swine flu?”
Stage 3 involves successively presenting four attitudinal questions regarding the vaccination
campaign (two with a positive slant and two with a negative slant).
Stage 3: “What is your opinion about each of the following statements?”
Attitudinal question 1 (positive slant): “The vaccination campaign against swine flu is necessary because the flu is likely to affect a large proportion of the public and to have serious consequences for many people.”
Attitudinal question 2 (positive slant): “The vaccination campaign against swine flu is necessary because it is vital to limit the risks of contagion and to protect other people.” Attitudinal question 3 (negative slant): “The vaccination campaign against swine flu was unnecessary because this flu is benign and the money spent could have been put to better use.”
Attitudinal question 4 (negative slant): “The vaccination campaign against swine flu was unnecessary because the vaccines are potentially more dangerous than the flu itself.” After each question, the results are presented to the participants, who are again offered the opportunity to revise their intentions in stage 3, with results again disclosed. This procedure of collecting and presenting the collective attitudes towards vaccination mimics media reports or opinion polls (680 reports on swine flu on the 6 major French TV news broadcasts between April 24 2009 and September 30 2009 according to INA Stat, 2009) and reflects the controversy over the usefulness and potential dangers of vaccination. It may be valuable for people taking others’ behavior into consideration or relying on others’ opinions before making up their mind.
In stage 4, two quantitative subjective belief questions are asked regarding the number of individuals that may fall ill due to swine flu and the number of deaths that may occur. For each question, five numbers of flu victims (and the corresponding percentages) are proposed and participants have to choose the figure best representing their beliefs.
Stage 4 Quantitative subjective belief question 1: “Greater Marseilles has a population of about 1 million. In your opinion, without vaccination roughly how many people will catch swine flu over the winter?”
a less than 20,000 (i.e. less than 2%) b from 20,000 to 50,000 (i.e. from 2% to 5%) c from 50,000 to 100,000 (i.e. from 5% to 10%)
d from 100,000 to 200,000 (i.e. from 10% to 20%) e more than 200,000 (i.e. more than
20%)
Quantitative subjective belief question 2: “In your opinion, without vaccination how many people will die of swine flu over the winter in Greater Marseilles?”
a less than 20 (from 0.001% to 0.002%) b from 20 to 50 (from 0.002% to 0.005%) c from 50 to 100 (from 0.005% to 0.01%) d from 100 to 200 (from 0.01% to 0.02%) e more than 200 (more than 0.02%)
The results are again presented to the participants, who are again asked about their intentions on vaccination against swine flu (stage 4), with the results of the votes again being disclosed.
Stage 5 involves a round table with two renowned health academics (an epidemiologist and a professor of health economics), both in favor of vaccination, briefly presenting the issues in the swine flu vaccination campaign and answering questions / reactions from the participants. During the round table session, lasting 25 minutes, quantitative information is also provided on the expected number of cases, hospitalizations, intensive care and deaths throughout the swine flu epidemic, as well as the actual number of deaths observed in France at the date of the survey, the number of deaths during an average seasonal flu outbreak and the number of severe adverse reactions due to vaccination in Canada (United Press International, 2009). Moreover, a risk information sheet is handed out individually to help participants process the risk information on the expected probability of contracting and of dying from swine flu. Risks are presented on a (logarithmic) graphic scale adapted from Calman & Royston (1997), Corso Hammitt & Graham (2001) and Chanel & Chichilnisky (2009). Following the round table, participants are again asked about their intentions regarding vaccination against swine flu, for the last time (stage 5).
Sample characteristics
We check the representativeness of our sample against the PACA population through descriptive statistics and tests on socio-economic characteristics (see Table 2) and also collect data on general health and attitude toward vaccination (see Table 3). We find that the two major biases of our sample are overrepresentation of large household size and high education, while age, gender and mean income do not significantly differ. Note that despite these biases, the level of vaccination intentions in stage 1 (19%) was similar to that obtained by opinion poll institutes at the same date (see Table 1) and that less than 2% of the sample had already been vaccinated, in line with national vaccine coverage at this date.
[TABLE 2 ABOUT HERE]
[TABLE 3 ABOUT HERE]
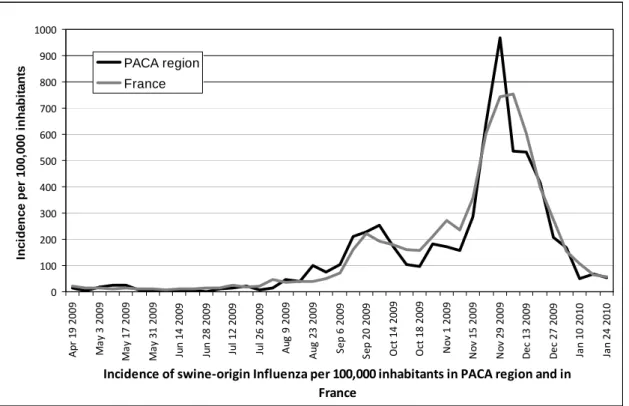
Regarding public concern about swine flu, we use the Google trends for the most common French term “grippe A” and we find that trends in the PACA region mirror those in France (see Figure 1). Figure 2 reveals that the incidence of swine flu per 100,000 inhabitants follows the same pattern in PACA region and in France over the period April 2009 – January 2010.
[FIGURE 2 ABOUT HERE]
Overall, the PACA region does not significantly differ from France regarding intentions to vaccinate and incidence rates.
Results
Determinants of initial intention to vaccinate
We start by explaining the initial intention to vaccinate with a logistic regression on socio-economic variables, general health variables, attitudes toward vaccination in general, swine flu in particular and the sources of information on flu. Variables with p-value lower than .2 are included in Table 4 and correctly predict 84.6% of the intentions. Because the education variable is not significant, the fact that our sample is overeducated is not likely to affect our results. Nor is the household size variable significant, ruling out the possibility of vaccination intentions being affected by a desire to protect relatives. We find that vaccinating against flu in the past (VaccFlu), as well as high scores on participant’s self-assessed absolute health status (HealthAbsol), vaccination attitude (VaccBehav) and self-estimated knowledge about vaccination (KnowVacc_H) all increase the intention to vaccinate, whereas being a Female decreases the intention to vaccinate. Regarding sources of information, consulting Internet (InfoWeb) seems to decrease the intention to vaccinate, whereas consulting medical staff (InfoDoct) seems to increase it.
[TABLE 4 ABOUT HERE]
Evolution of intentions
We focus now on how participants’ intentions on vaccination evolve depending on the type of information provided. Figure 3 presents aggregated results at each of the five stages. The “Yes” and “No” shares remain more or less stable across the first four stages, but at the last stage there is a marked decrease in “No” answers (from 75 % in the first four stages to 55% in the last stage) and a strong increase in “Yes” answers (from 19% to 32%). Confidence
intervals in Figure 3 indicate that only the intentions expressed in stage 5, the final stage, differ from the first intentions.
[FIGURE 3 ABOUT HERE]
Because individual variations in intentions could cancel each other out if only examined in aggregate, we present disaggregated results in Figure 4, showing how participants individually react to information provided, and how their intention to vaccinate changes. Figure 4 shows the evolution of participants’ intention to vaccinate over two successive stages, with “Positive” standing for an evolution towards a more positive intention, “Negative” an evolution towards a less positive intention and “Constant” no evolution. As in Figure 3, the intentions are constant and very stable until stage 4. Over the first four stages, the share of participants not changing their mind does not significantly differ (on average 80.8 %). Nor does the share of participants expressing an increased intention to vaccinate significantly differ from the proportion expressing a decreased intention over the first four stages (8.1% vs. 11.1%). The picture changes between stages 4 and 5, where the number of constants significantly decreases to 57% (p-value < 0.0001), whereas the number of positive changes significantly increases to 38% (p-value < 0.0001) and the number of negative changes significantly decreases to 6% (p-value = 0.0039) (two-sample tests of proportion).
[FIGURE 4 ABOUT HERE]
Let us turn now to the full patterns of change across the 5 stages by participant. Among the 5*5*5*5=625 possible patterns, only 64 are observed (among which 18 correspond to more than one participant) and lead to remarkably clear results. Firstly, this confirms that only a small number of participants revise their intentions between stages 1 and 2 (16.2%), stages 2 and 3 (18.5%), stages 3 and 4 (21.4%), whereas 42.8% participants make revisions between stages 4 and 5. Secondly, two marked patterns emerge: for 45.7% of participants, a constant pattern during the entire procedure and for 20.2%, a constant pattern over the first four stages but an increase between stages 4 and 5. These patterns indicate that although most individuals do not appear to be responsive to information provided, whatever its type, the round table and associated quantitative scientific information provided between stages 4 and 5 gives rise to a significant revision in favor of vaccination. These descriptive findings are confirmed by
Determinants of evolution
Elicited intentions are consistent with participants’ attitudes and beliefs. Figure 5 focuses on how perceptions regarding the usefulness of vaccination impacts the intentions elicited in stage 3. The sample is split into two groups: participants who express positive opinions regarding the usefulness of the vaccination campaign and participants who express negative opinions. Compared to the latter, participants considering the campaign useful have both a higher intention to vaccinate (38.5% vs. 1.3% with p-value < 0.0001) and a much lower intention not to vaccinate (51.3% vs. 87.5% with p-value < 0.0001).
[FIGURE 5 ABOUT HERE]
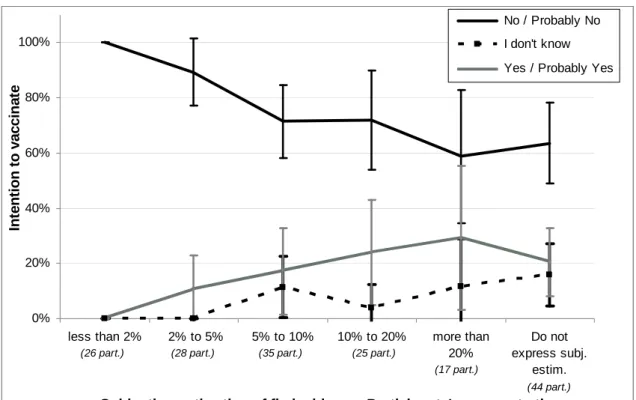
Figure 6 shows the impact of participants’ subjective estimation of the incidence of flu on their intention to vaccinate elicited in stage 4. The higher the expected incidence expressed by the participant, the higher his/er intention to vaccinate and the lower his/er intention not to vaccinate. The difference between negative and positive intentions is significant, except for participants estimating flu incidence as higher than 20% (p-value = 0.2058).
[FIGURE 6 ABOUT HERE]
Finally, who changes his/er mind in stage 5? Participants’ opinions on the usefulness of the information provided between stages 4 and 5 were sought and coded as Science_Pos if positive, Science_Neg if negative and Science_DK if participant answered “I don’t know”. We classify the evolution of intentions between stages 4 and 5 (s5_4), into three categories (decrease in intention, no change and increase in intention). For the 71% of participants that judge the scientific information provided useful, increase in intention is significantly higher than for those who judge it useless (42.4% vs. 20.0%, p-value = 0.0053), while decrease in
intention is the same (4.8% vs. 5.0% p-value = 0.5204). We also explain the evolution of
intention with an ordered logit regression on all variables including attitude to vaccination, opinion about the usefulness of the vaccination campaign, subjective estimation of flu incidence and opinion on the information provided. The corresponding model correctly predicts 65.5% of the intentions and is shown in Table 5 (only variables with p-value lower than .2 are included).
[TABLE 5 ABOUT HERE]
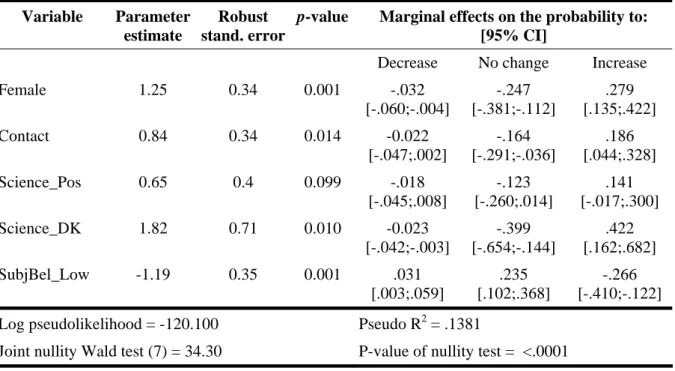
We find that, compared to those who have a negative opinion of the usefulness of the information provided, those who have a positive opinion (Science_Pos) or who “don’t know” (Science_DK) are more likely to evolve toward intention to vaccinate. Being a Female and knowing someone with swine flu(Contact) also favor a positive evolution toward intention to vaccinate, whereas participants with a low subjective estimation of the incidence of flu (i.e. 5% or less) or who “don’t know” (SubjBel_Low) are less likely to evolve toward intention to vaccinate: as expected, they are more difficult to convince.
Discussion
These results clearly show that individual attitude to vaccination is based on personal appraisal of the situation. First, it seems that reluctance to vaccinate is not intended as a “free-ride” on others’ vaccinations. People clearly understand that they cannot rely on high vaccine coverage. The fact that participants did not react to the information provided in stage 2 about the low level of intentions to vaccinate confirms that they were not thinking strategically. Second, formulating opinions about the vaccination campaign (stage 3) and beliefs about the risk of contamination (stage 4) does not influence intentions to vaccinate, even when feedback about other people's opinions has been provided. This means that participants did not use the information provided by the feedback on others’ behaviors and opinions.
Third, the scientific information provided in stage 5 is the crucial factor and leads to a positive change in intentions to vaccinate. Our results thus indicate that providing scientific information can help health authorities bring the public’s willingness to vaccinate into line with the optimal vaccination coverage to prevent major epidemics. Nevertheless, this result should be carefully interpreted for two reasons. First, as the experiment took place when the swine-flu epidemic was at its peak in France (early December 2009), we can expect that intentions to vaccinate were strongly anchored and well-defined among the participants. Accordingly, the types of information given in the first four stages may not have been powerful enough to change the participants’ beliefs, although providing them well before the epidemic might have had a positive effect on intentions to vaccinate. The second reason is due to differences in format between stage 5 and the four earlier stages. In fact, the earlier stages were short, with impersonal presentations of information (like media communications),
whereas the fifth stage was longer (25 minutes) and involved more personal and intensive interactions between participants and the two experts. Although the very high positive evolution of intentions revealed here makes it likely that the impact of scientific information on intentions to vaccinate will be robust, the experiment does not separate out and weight the respective influences of the multiple features involved at stage 5 (scientific information, timing, oral intervention, debate, etc.). Additional controlled experiments exposing different subgroups to variations of stage 5 that use differing single information channels would reveal the respective extent to which these features affect beliefs and behaviors. For instance, an interesting question is whether the same effect would be observed with a subgroup of participants only watching a video recording of the debate. If indeed an active participation in a public debate is not key to the effect we observed, this would be good news for public health intervention in the real world, making cheaper options viable.
The final question is how best to propagate scientific information in a practical way. Clearly, the conditions of stage 5 are hardly replicable for a sizable segment of the population in the run up to a possible epidemic. A successful information channel needs to guarantee that people trust the information provided. Traditional media and Internet seem to be poor candidates: we found that people informed by these media rather than by medical staff were less in favor of vaccination. The family doctor on the other hand may be a good source of information: s/he is usually the first person consulted for health problems and can immediately provide vaccination, once the patient has decided in favor of it. However, this may only work for people who are in regular contact with their doctor. The question of optimal mass media communication of credible scientific information is therefore open but two directions in addition to the family doctor seem possible. The first is healthcare websites provided by health practitioners, which inform the public about health issues and public health interventions, an option discussed in the French Senate Report (2010) or Tang & Yang (2010) (see for instance the French sites http://www.atoute.org/, as well as the Spanish site http://www.elblogalternativo.com, the Australian site http://www.healthyskepticism.org, or the US site www.medhelp.org which offered an arena for constructive debates during the swine flu pandemic). The second is television broadcasts that present relevant objective health data, organize debates among health specialists and allow interactivity with viewers through telephone, SMS, Internet and surveys.
References
Boulier, B.L., Datta, T.S., & Goldfarb, R.S. (2007). Vaccination externalities. B.E. Journal of Economic Analysis & Policy, 7(1), Article 23.
Brito, D., Sheshinski, E., & Intriligator, M. (1991). Externalities and compulsory vaccinations. Journal of Public Economics, 45(1), 69-90.
Calman, K. C., & Royston, G. (1997). Risk language and dialects. British Medical Journal, 315(7113), 939–942.
Chan, M. (2010). Progress in public health during the previous decade and major challenges ahead. Report by the Director-General to the Executive Board at its 126th session, Geneva, Switzerland, January 18th.
Chanel, O., & Chichilnisky, G. (2009). The influence of fear in decisions: Experimental evidence. Journal of Risk and Uncertainty, 39(3), 271-298.
Chanel, O., Cleary, S., & Luchini, S. (2006). Does public opinion influence willingness-to-Pay? Evidence from the field. Applied Economics Letters, 13(13), 821-824.
Corso, P. S., Hammitt, J. K., & Graham, J. D. (2001). Valuing mortality-risk reduction: Using visual aids to improve the validity of contingent valuation. Journal of Risk and Uncertainty, 23(2), 165–184.
Daley, D.J, & Gani, J. (2001). Epidemic modelling: An introduction. Cambridge: Cambridge University Press.
Eisenberg, J., Aiello, A., Spicknall, I., Monto, A., & Reingold, A. (2009). Protecting the herd from H1N1. Science, 326, 934.
Enserink, M. (2004). Crisis underscores fragility of vaccine production system. Science, 306, 385.
Francis, P.J. (2004). Optimal tax/subsidy combinations for the flu season. Journal of Economic Dynamics and Control, 28, 2037-2054.
French Senate Report (2010), Rapport de la commission d’enquête sur le rôle des firmes pharmaceutiques dans la gestion par le Gouvernement de la grippe A (H1N1)v, Report N° 685, July 29, 163 p.
Geoffard, P.-Y., & Philipson, T. (1997). Disease eradication: Private versus public vaccination. American Economic Review, 87(1), 222-230.
Gersovitz, M., & Hammer, J.S. (2004). The economic control of infectious diseases. Economic Journal, 114, 1-27.
Greenberg, M., Lai, M., Hartel, G., Wichems, C., Gittleson, C., Bennet, J., Dawson, G., Hu, W., Leggio, C., Washington, D., & Basser, R. (2009). Response to a Monovalent 2009 Influenza A (H1N1) Vaccine. New England Journal of Medicine, 361, 2405-2413.
IFOP (2009). Les Français et la grippe A - Vague 4. Opinion poll
http://www.ifop.com/media/poll/985-1-study_file.pdf. (Accessed 08.31.10).
INA Stat (2009). Le baromètre thématique des journaux télévisés. 15, 4 p. INSERM (2010), Réseau Sentinelles, UPMC, http://www.sentiweb.fr.
Leader, A.E., Weiner, J.L., Kelly, B.J., Hornik, R.C., & Cappella, J.N. (2009). Effects of information framing on human papillomavirus vaccination. Journal of Women's Health, 18(2), 225-233.
MediaprismGroup (2009). Enquête sur la grippe A (Online survey on 14,000 internet users in December 10-11), Report, 26 p.
Medlock, J., & Galvani, A. (2009). Optimizing influenza vaccine distribution. Science, 325, 1705-1708.
Rubin, G.J., Amlôt, R., Page, L., & Wessely, S. (2009). Public perceptions, anxiety, and behaviour change in relation to the swine flu outbreak: cross sectional telephone survey. British Medical Journal, 339, b2651.
Tang, X., & Yang, C.C. (2010). Identifing influential users in an online healthcare social network. IEEE International Conference on Intelligence and Security Informatics: Public Safety and Security, 43-48.
TNS Sofres (2009). Les Français et le vaccin contre la grippe A. Opinion poll.
http://www.tns-sofres.com/points-de-vue/4CD3B342DAD14BE09991120E57D565FD.aspx. (Accessed 08.31.10).
United Press International (2009). Adverse reactions to H1N1 vaccine showing. 11/18/2009, Ottawa. http://www.upi.com/Top_News/International/2009/11/18/Adverse-reactions-to-H1N1-vaccine-showing/UPI-49261258573820/ (Accessed 08.31.10).
Wallinga, J., van Boven, M., & Lipsitch, M. (2010). Optimizing infectious disease interventions during an emerging epidemic. Proceeding of the National Academy of Sciences U.S.A, 107, 923-928.
Yang Yang, Sugimoto, J., Halloran, E., Basta, N., Chao, D., Matrajt, L., Potter, G., Kenah, E., & Longini Jr., I. (2009). The transmissibility and control of pandemic influenza A (H1N1) virus. Science, 326, 729-733.
Table 1: Intention to vaccinate according to opinion polls. Sources: (1) IFOP: 1 007
respondents, (2) TNS Sofres: 975 respondents, (3) IFOP: 965 respondents, (4) IFOP: 958 respondents, (5) Mediaprismgroup: 14 000 respondents.
Sept. 3-4 2009 Phone (1) Sept. 22-23 2009 Phone (2) Oct. 22-23 2009 Phone (3) Nov. 12-13 2009 Phone (4) Dec. 10-11 2009 Internet (5) Total, YES 55% 30% 17% 20% 22% - Yes, certainly 29% 14% 7% 7% 10% - Yes, probably 26% 16% 10% 13% 12% Total, NO 45% 65% 82% 79% 78%
- No, probably not 21% 23% 33% 30% 37% - No, certainly not 24% 42% 49% 49% 41%
Table 2 Socio-demographic data and representativity tests (N=175)
Variable name Description Sample mean Sample Std. dev Missing PACA mean Equ. Testa
Age Participant age (years) 39.58 19.84 2 41.11 .310
Before_57 Participant was born before
1957b (=1) .353 .479 2 .346 .855 Edu_no Edu_basic Edu_second Edu_bachelor Edu_master Educational qualifications: Unqualified (=1) Lower secondary (=1) Higher secondary (=1) University undergraduate (=1) Master degree (=1) .040 .288 .085 .192 .373 .195 .454 .279 .395 .485 0 0 0 0 0 .153 .447 .166 .111 .121 <.001 <.001 <.001 .010 <.001
Female Gender (female=1) .497 .509 2 .520 .551
Income Monthly participant personal
income (EUR)
1 731 1 638 17 1 536 .136
NbPers Number of persons in the
household
2.94 1.553 3 2.26 <.001
a
Significance of the equality test of sample mean to PACA mean.
b
This year was chosen as subjectsborn before 1957may have a better “immune response that might result from previous exposure to H1N1 viruses that were displaced from circulation by the H2N2 subtype in the 1957–1958influenza pandemic” (Greenberg et al., 2009).
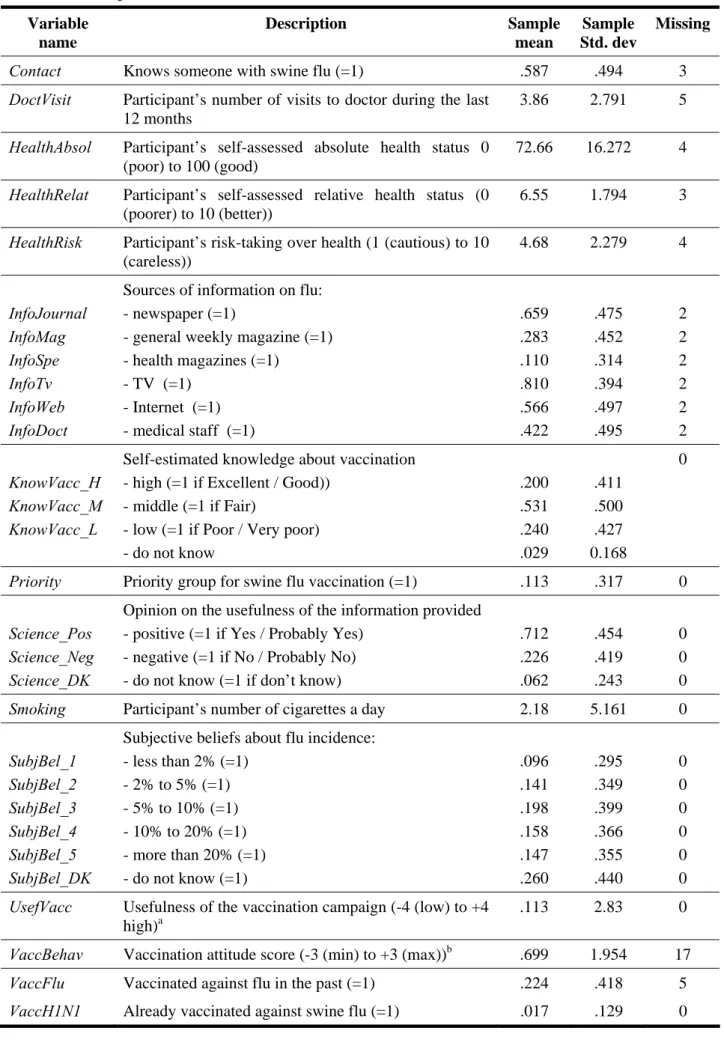
Table 3 Description of the variables collected (N=175) Variable name Description Sample mean Sample Std. dev Missing
Contact Knows someone with swine flu (=1) .587 .494 3
DoctVisit Participant’s number of visits to doctor during the last
12 months
3.86 2.791 5
HealthAbsol Participant’s self-assessed absolute health status 0
(poor) to 100 (good)
72.66 16.272 4
HealthRelat Participant’s self-assessed relative health status (0
(poorer) to 10 (better))
6.55 1.794 3
HealthRisk Participant’s risk-taking over health (1 (cautious) to 10
(careless)) 4.68 2.279 4 InfoJournal InfoMag InfoSpe InfoTv InfoWeb InfoDoct
Sources of information on flu: - newspaper (=1)
- general weekly magazine (=1) - health magazines (=1) - TV (=1) - Internet (=1) - medical staff (=1) .659 .283 .110 .810 .566 .422 .475 .452 .314 .394 .497 .495 2 2 2 2 2 2 KnowVacc_H KnowVacc_M KnowVacc_L
Self-estimated knowledge about vaccination - high (=1 if Excellent / Good))
- middle (=1 if Fair)
- low (=1 if Poor / Very poor) - do not know .200 .531 .240 .029 .411 .500 .427 0.168 0
Priority Priority group for swine flu vaccination (=1) .113 .317 0
Science_Pos Science_Neg Science_DK
Opinion on the usefulness of the information provided - positive (=1 if Yes / Probably Yes)
- negative (=1 if No / Probably No) - do not know (=1 if don’t know)
.712 .226 .062 .454 .419 .243 0 0 0
Smoking Participant’s number of cigarettes a day 2.18 5.161 0
SubjBel_1 SubjBel_2 SubjBel_3 SubjBel_4 SubjBel_5 SubjBel_DK
Subjective beliefs about flu incidence: - less than 2% (=1) - 2% to 5% (=1) - 5% to 10% (=1) - 10% to 20% (=1) - more than 20% (=1) - do not know (=1) .096 .141 .198 .158 .147 .260 .295 .349 .399 .366 .355 .440 0 0 0 0 0 0
UsefVacc Usefulness of the vaccination campaign (-4 (low) to +4
high)a
.113 2.83 0
VaccBehav Vaccination attitude score (-3 (min) to +3 (max))b .699 1.954 17
VaccFlu Vaccinated against flu in the past (=1) .224 .418 5
a
This variable is a score based on the answers to the four attitudinal questions on the usefulness of the vaccination campaign. Possible answers are Yes / Probably Yes (+1), No / Probably No (-1) and I don’t know (0). UsefVacc is the sum of the four individual scores.
b
This variable is a score based on the answers to three questions: “Apart from flu vaccine, do you usually get vaccinated when it is recommended but not compulsory (hepatitis A and B)?”, “Do you (or would you) get your children vaccinated when it is recommended but not compulsory?”, “Do you remember to renew your vaccination?”. Possible answers are Yes (+1), No (-1) and Sometimes (0).
VaccBehav is the sum of the three individual scores.
Table 4: Logistic regression of positive intention to vaccinate in stage 1 (N=156).
Variable Parameter estimate Robust stand. error p-value Marginal effects 95% CI Constant term -4.22 1.26 0.001 - - Female -1.25 0.56 0.025 -0.114 [-.209;-.188] HealthAbsol 0.02 0.02 0.115 0.002 [-.001;.005] VaccFlu 1.67 0.54 0.002 0.217 [.044;.390] VaccBehav 0.44 0.19 0.020 0.039 [.009;.069] KnowVacc_H 1.11 0.52 0.033 0.129 [-.210;.280] InfoDoct 0.85 0.52 0.102 0.080 [-.014;.175] InfoWeb -0.60 0.47 0.202 0.056 [-.150;.038] Log pseudolikelihood = -54.750 Pseudo R2 = .2542
Joint nullity Wald test (7) = 24.10 P-value of nullity test = .0011
Table 5: Ordered logistic regression of evolution of intention between stage 4 and 5 (n=171).
Variable Parameter estimate
Robust stand. error
p-value Marginal effects on the probability to: [95% CI]
Decrease No change Increase
Female 1.25 0.34 0.001 -.032 [-.060;-.004] -.247 [-.381;-.112] .279 [.135;.422] Contact 0.84 0.34 0.014 -0.022 [-.047;.002] -.164 [-.291;-.036] .186 [.044;.328] Science_Pos 0.65 0.4 0.099 -.018 [-.045;.008] -.123 [-.260;.014] .141 [-.017;.300] Science_DK 1.82 0.71 0.010 -0.023 [-.042;-.003] -.399 [-.654;-.144] .422 [.162;.682] SubjBel_Low -1.19 0.35 0.001 .031 [.003;.059] .235 [.102;.368] -.266 [-.410;-.122] Log pseudolikelihood = -120.100 Pseudo R2 = .1381
Figures
Figure 1: Web search volume for “grippe A” in France and PACA region, and intention to
vaccinate (from Table 1). Web search volume is expressed in terms of percentage of maximum volume. The peak was reached in the third week of November.
0% 10% 20% 30% 40% 50% 60% 70% 80% 90% 100% Ap r 19 20 09 Ma y 3 20 09 Ma y 17 20 09 Ma y 31 20 09 Ju n 14 20 09 Ju n 28 20 09 Ju l 12 2 009 Ju l 26 2 009 Au g 9 20 09 Au g 23 20 09 Se p 6 20 09 Se p 20 20 09 Oct 4 20 09 Oc t 18 20 09 No v 1 20 09 No v 15 20 09 No v 29 20 09 De c 13 20 09 De c 27 20 09 Ja n 10 20 10 Ja n 24 20 10 Web search volume for Grippe A (PACA region) Web search volume for Grippe A (France) Intentions to vaccinate
Figure 2: Incidences of swine-origin Influenza per 100,000 inhabitants in PACA region and
in France (source: INSERM, 2010).
Incidence of swine‐origin Influenza per 100,000 inhabitants in PACA region and in France 0 100 200 300 400 500 600 700 800 900 1000 Ap r 19 20 09 Ma y 3 20 09 Ma y 17 20 09 Ma y 31 20 09 Ju n 14 20 09 Ju n 28 20 09 Ju l 12 20 09 Ju l 26 20 09 Au g 9 20 09 Au g 23 20 09 Se p 6 20 09 Se p 20 20 09 Oc t 14 200 9 Oc t 18 200 9 No v 1 20 09 No v 15 20 09 No v 29 20 09 De c 13 20 09 De c 27 20 09 Jan 10 20 10 Jan 24 20 10 In ci d e n ce p e r 100 ,000 i n h a b it a n ts PACA region France
Figure 3: Evolution of intentions over the five stages with 95% Confidence Interval (CI)
(“No” and “Probably No” as well as “Yes” and “Probably Yes” responses are merged).
0% 10% 20% 30% 40% 50% 60% 70% 80% 90% s1 s2 s3 s4 s5 Stages In te n ti o n to v acci n at e Yes /Probably Yes No / Probably No
Figure 4: Evolution of individual intentions from stage to stage with 95% CI.
0% 10% 20% 30% 40% 50% 60% 70% 80% 90%
s1 to s2 s2 to s3 s3 to s4 s4 to s5 Changes from stage to stage In te n ti o n to va cc in at e Positive Constant Negative
Figure 5: Intention to vaccinate in stage 3 according to opinions expressed in the four
attitudinal questions regarding the vaccination campaign with 95% CI.
0% 10% 20% 30% 40% 50% 60% 70% 80% 90% 100%
Usefulness of vaccination Uselessness of vaccination
Attitudes regarding the vaccination campaign
In te n tio n t o v a c c in a
te Yes / Probably Yes
I do not know No / Probably No
(78 part.) (80 part.)
Figure 6: Intention to vaccinate at stage 4 for different subjective estimations of flu incidence
with 95% CI. 0% 20% 40% 60% 80% 100%
less than 2% 2% to 5% 5% to 10% 10% to 20% more than 20%
Do not express subj.
estim.
Subjective estimation of flu incidence: Participants' answers to the question "How many people will catch swine flu over the winter?"
In te n ti o n t o va cc in at e No / Probably No I don't know Yes / Probably Yes
(44 part.)
(26 part.) (28 part.) (35 part.) (25 part.)