Optik139(2017)61–71
Contents lists available atScienceDirect
Optik
j o u r n a l h o m e p a g e :w w w . e l s e v i e r . d e / i j l e o
Original
research
article
Analysis
of
bitemporelles
images
to
follow-up
the
flooding
phenomenon
in
the
western
high
plains
of
Algeria
Abdelhalim
Guerroudj
a,b,∗,
Mohamed
Hadeid
a,d,
Akram
Seddiki
c aGeographyDepartment,Oran2University,Oran,AlgeriabAmarTelidjiUniversity,Laghouat,Algeria
cGeomaticsLaboratory,SpaceTechnicsCenter,Arzew,Algeria dResearchLaboratoryEGEAT,Oran2University,Oran,Algeria
a
r
t
i
c
l
e
i
n
f
o
Articlehistory: Received31December2016 Accepted13March2017 Keywords: Highplains Floods SpatiotemporalGeographicInformationSystem"GIS" AnalyticHierarchyProcess"AHP" Estimatedmodel
Urbanspace
a
b
s
t
r
a
c
t
Intheselastdecades,theHighPlainsSteppeofAlgeriahavebeenmarkedbyanintense
degradationaffectingtheland,duetoseveralfactorssuchasthefloods.Theproposed
solutionsthatallowtocombatthesephenomenaandretainthenatureoftheseareasremain
inadequateduetotheabsenceofidentificationmodel,trackingandfloodforecasting.
Thisarticleshowstheresultsofthespatiotemporalstudyofparametersthatdefinethe
naturalphenomenageography,inotherwords,itisthefirsttimewhere,thefollow-up
spatiotemporalaggravatingfactorstheflood,thenseetheireffectsonthemapoftherisk
hazard.
Thealgorithmicdiagramofourstudyfocusesonthedevelopmentandtheapplicationof
techniquesforthepurposeofthecharacterizationandmonitoringofthespatio-temporal
dynamicsofenvironmentalsystemsatthewatershedscale“wadielbiodh”,inorderto
inte-gratethespatialdataandmapsinGeographicInformationSystem(GIS)thatwillallow
toestablishorimplementaforecastingmodelwhichhelpsintheprotectionoftheurban
spaceandtoanticipatetheinterventionoflocalauthorities.
©2017ElsevierGmbH.Allrightsreserved.
1. Introduction
Themulti-timesatelliteimageryusedtodevelopdynamicfloodriskmapsandtrackgeographicallyrisks,thatcontribute indamagesattenuationaccordingtothesedisasters.
Theavailabilityofsatellitedata,therepetitivenessoftheiracquisition,andtheanalysisoftheimagesmulti-temporal havehelpedtoexpandtheapplicationsofremotesensingtoincludethesurfaceearthchangedetectionandthefollow-up ofthedynamicphenomena[4].
Detectionofchangeinremotesensingisaprocessthatidentifiesdifferencesstatesofanobjectorphenomenonby carryingoutobservationswithseveraldates.Itessentiallyinvolvestheabilitytoquantifythetemporaleffectsbyusing multi-datedata[2].
Theaimofthisstudyistodevelopaprocessapplicationofcharacterizationtechniquesandmonitoringofthe spatio-temporaldynamicsofenvironmentalsystemsatthewatershed scaleof“wadielbiodh”,thecombinationofGeographic
∗ Correspondingauthorat:GeographyDepartment,Oran2University,Oran,Algeria.
E-mailaddresses:[email protected],[email protected](A.Guerroudj),[email protected](M.Hadeid),[email protected](A.Seddiki).
http://dx.doi.org/10.1016/j.ijleo.2017.03.047
Table1
Typologyandsourcesofcollecteddata.
Organization/Direction Datatype Properties
TheNationalAgencyforHydraulicResources(ANRH) GeologicalMap e=1/200000 TheNationalInstituteofCartographyandRemoteSensing(INCT) TopographicMap e=1/50000
DirectionofMétéorology DataRaifall Seriesoftenstations(10yearsinterval) EarthScienceDataInterface(ESDI) SatelliteImage(LANDSAT) Spatialrésolution:30(m)
Acquisitiondate:2001,2014(spring)
Fig.1.Analysisandprocessingphases.
InformationSystemGISandtheMulti-criteriaanalysis(MCA),allowsthedecision-makingbydelimitationanddefinition risk’sareaintheorderoftheweightingofthefactorsstudied.
RegardlessoftheuseofGISandtheMCA,thespaceimagesclassificationisessential,techniquesofanalysis,position classificationofimagesresultingthematicallowtoseethechangeineachparameterdefiningtherisk.
Finally,inordertohaveacorrectandaccuratedecision,thedynamicmapsweredevelopedbycombiningamultisource data,allowtomakeacomparativestudytakingintoaccountallobtainedresults.
2. Methodology
Inordertoachieveourobjectives,athree-phaseapproachwasdefined.Duringthefirstone,wehavecollectedthe necessarydatafromdifferentinstitutionsandservices“Table1”.Foreachtypeofdata,weappliedapreliminarytreatment asrequiredGIS/MCAintegrationformats(SpaceTechnicsCenter,ANRH,INCT,MeteorologyDepartment).
Theextractionoftheinformationaboutthechangeofthefactorsstudiedbythetimeisthesubjectofthesecondphase bytheapplicationofthemethodsofdetectionofchangesqualitative/quantitativeandtheinterpretationoftheresultsofa temporalspaceof13years.
ThefinalphaseusethespatialanalysistechniquesandMCAtodevelopthegeographymapsofthehazardfloodrisk duringthetwodates2001and2014,theinterpretationandreadingofthemapsmustbedonebyacomparisonwiththe previousphaseresults(Fig.1).
2.1. Choiceofstudyarea
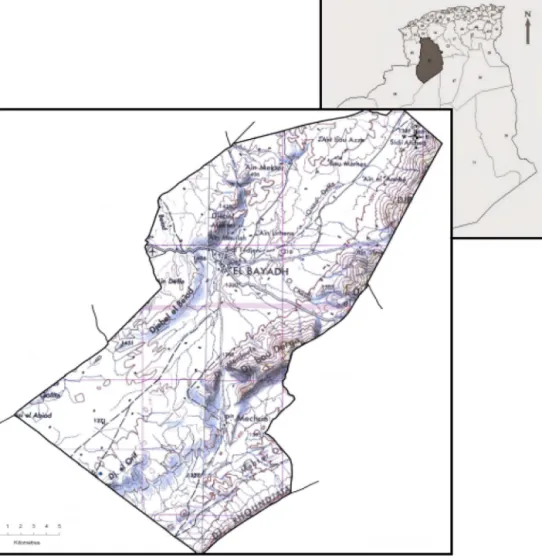
Inoursituation,thechoiceofthestudyareaisstipulatedbytheavailabilityofnecessarydataforthepracticalrealization oftheprojectontheonehand,ontheotherhandtheareathatwehaveselectedisanareaaffectedbythefloodinOctober 2011andin1953accordingtothehistory.
ElBayadhisamunicipalityinthewilayaofElBayadh,whichitisthechief-town,located370kmsouth-eastofOran, 520kmsouth-westofAlgiersand500kmnorth-eastofBechar.Itcoversanareaof463.50km2.Thepopulationisestimated at120,948inhabitantsaccordingtotheGeneralCensusofPopulationandHabitat2015(Fig.2).
2.2. Pretreatmentsandcombinationofimagedata
TheyareclassifiedintheTable1,thesetofdatacollectedbasedoftheirtypologyandtheprovideragency. 2.2.1. Realizationofthelandusemap
ForLandsatTMimages,radiometrycorrectionhasbeenappliedtoimprovethecontrastthatisnecessaryforthechoice oftrainingsitesinthesupervisedclassification.Thetypeofradiometriccorrectionislinearstretch.
Theimagewasre-projectedfromWGS84systemtotheNorthSahara1959UTMsystem.
Afterthegeometricandradiometriccorrection,theimagewasclassified,byapplyingthemaximumlikelihoodalgorithm toidentifyfourmainclasses:soil,vegetation,urban,career(Fig.3).
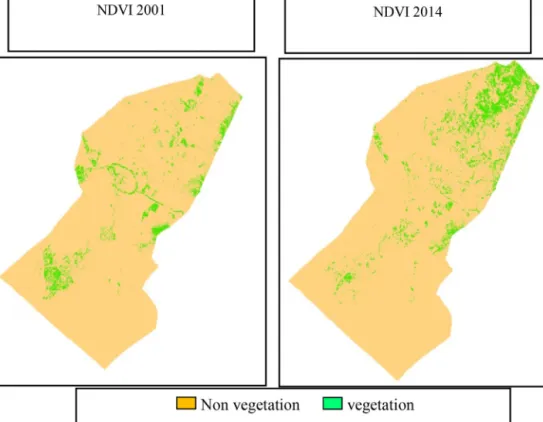
2.2.2. Analysisofvegetationcover
TheNormalizedDifferenceVegetationindicatoris“NDVI”anindicatorthatidentifiesthevegetationobject,basedonthe redandnearinfraredchannelimageTM.Intheprocessofrealizationoffloodriskmaps,itisusedasaninformationlayer onplantsandnon-plantareas(Fig.4).
A.Guerroudjetal./Optik139(2017)61–71 63
Fig.2. LocationoftheStudyarea.
Fig.4.ObjectvegetationmasksbycalculationofNDVI2001andNDVI2014indices.
A.Guerroudjetal./Optik139(2017)61–71 65
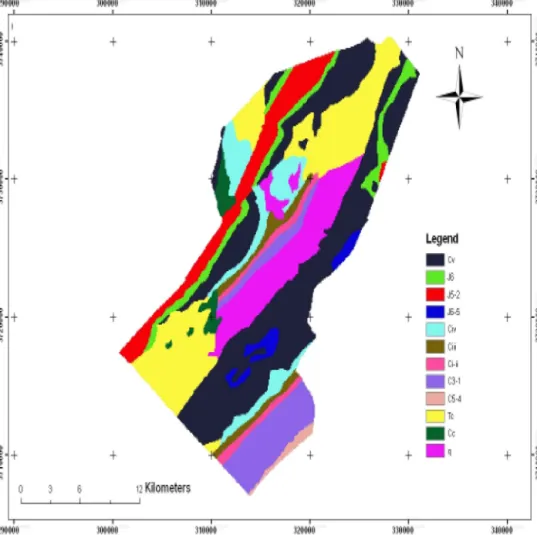
Fig.6.GeologicalmapofEl-Bayadhmunicipality.
2.2.3. Studyofthetopography
Theslopesofthemapisanessentiallayerinnaturalhazardsstudies,thefactthatitdefinedthefieldtopographyinthe formofclasses.InourcasethemapwascreatedbasedonaDTMafterimprovement.
ThenumericalmodeloflandacquiredistheGtopo90notcharacterizedbyits30msamplingandprecisionvariable altitudemeasurements.Forthis,wefollowedaprocessofimprovingitsinformationqualitythroughtheintegrationof contourlinesandspotthetopographicmap.Similarly,improvedproducthasbeenre-projectedfromWGS84systemtothe NorthSahara1959systemtogeneratetheslopemap(Fig.5).
2.2.4. Extractionofgeologicalinformation
WeextractedthegeologicalmapwhichcorrespondstotheextentofthemunicipalityofEl-Bayadh,thisextractionhas allowedustoidentifyrocksgeologicalunitscomponents.
Afterextraction,wehavetakeninformationfromgeologistsscientistsaboutthepropertiesorthesensitivityofthese rockstotheflood.
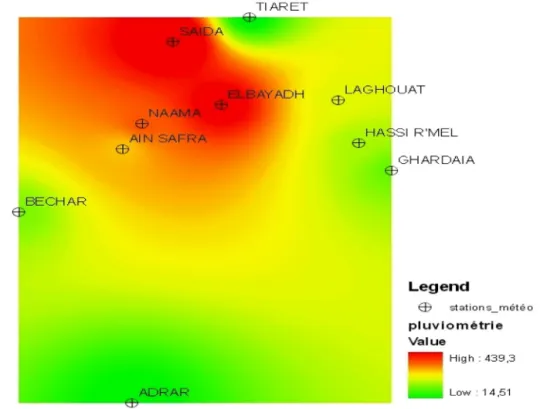
theseinformationwasusedascriteriatoclassifythegeologicalmapaccordingtothesubjectstudy(Fig.6). 2.2.5. Realizationrainfallmap
Afteranalyzingtheseriesofmeteorologicalobservations,wemadestatisticalcalculationstoapplylateraninterpolation algorithmofrainfallmeasurementsfromtenstations:El-Bayadh,Naama,AinSefra,Laghouat,HassiR’Mel,Ghardaia,Saida, Tiaret,BecharandAdrar(Fig.7).
2.3. Changedetectionbysatelliteimagery
AfteranalyzingdataontheOued-El-Bayadhpool,wechosetoworkfirstonthelandcoverchange,evolutionordegradation andhowwillinfluencetheriskmapping?
Fig.7.Generationofrainfallmap.
Table2
A.Guerroudjetal./Optik139(2017)61–71 67
Fig.8. MergingofNDVI2001andNDVI2014indices.
Thisphase isnota comparativestudyinthesenseofalgorithmicstudybut ratheranapplication ofqualitativeor quantitativedetectionalgorithmstoensuretheinformation.
Thereareseveralchangesofdetectionmethodsintheliterature[1–3],forourcase,weusedtwomethods:Methodmelt indices,andComparisonmethodpost-classification.
2.3.1. Fusingindexmethod
Thevegetationindexusesthevegetationspectralsignature(veryhighinfraredreflectanceandverylowcloseinred), thisindexisarelativelyreliableindicatorofchlorophyllactivityofvegetation[5].
Weappliedtreatmentonvegetationindicescalculatedfromourbi-temporalimages.
Theinterpretationoftheresultsobtained“Fig.8”hasallowedustoidentifyvegetation(newandold)inacomprehensive manner.
Thismethodoffusionhastheadvantageofquantifyingchange,althoughtheaccuracyisnotbetterbecausethe quantifi-cationisdoneonthebasisofamanualthresholdingofthetwoindices.
Theappliedsolutionhaslimitationsasregardsthechangedetectionforobjectsofsmalldimensions. 2.3.2. Post-classificationanalysesmethod
Post-classificationcomparisonmethodsprovideinformationaboutthenatureofthechanges,andhavetheadvantageof comparingobjectclassesinpairs,whichmakesiteasiertoextractchangesaccurately[3].
Thestatisticalanalysisoftheresultsoftheclassificationsofthebothdatesmakesitpossibletoestimaterelatively (classificationaccuracy–thematicconfusion)therateofchangebetweenthetwodates.
Forthepaircomparison,theresultobtained“Fig.9”forclassificationsoffourclasses:soil,vegetation,quarry,andurban, comprises16combinationsofclasses.
Thecomparisonapproachofclassificationsrequires havinggoodresultsoffield trips.Theproblemofomissionand shadowmaydistorttheinterpretationofcertainobjects(Fig.10).
Fig.9.Resultsofcomparedpostclassification.
A.Guerroudjetal./Optik139(2017)61–71 69
Thechangedetectionmethodsappliedinthisphaseshowasignificantchangeespeciallyontheturfofthemunicipality ofElBayadhinanintervalof13years,ourgoalisnottoinvestigatethecausesofthischange,butviewisthatthischange affectsthefloodhazardmapandhowtointerpretthischange?
2.4. Mappingfloodhazard:approachandanalysisresults
Theknowledgeofthefactorsaggravatingthefloodinghazardandtheperiodicmonitoringoftheirvariations,increase ourunderstandingofthephenomenon,alsoallowsustoidentifyareaslikelytobehitbyfloodinganddeterminetheirdegree ofrisk.
2.4.1. Mapselabortation
WehaveselectedtheMCAalgorithmAHP(AnalyticalHierarchyProcess)tomergedatawithadvancedweightingforthe developmentoffloodriskmap.TwotypesofpretreatmentsareappliedbeforeintegratethemintotheGISprocessontwo levels:
• Firstlevelontheanalysisofdataacquiredaccordingtotheirgeometricalproperties,scales,resolutions. • Thesecondlevelisanadvancedlevel,istocreatethematicmapsandmappingoffloodrisks.
Thefloodriskmapobtainedbyfusionisarepresentationbyclassesthatshowthedegreeofrisk,butalsoarepresentation ofheterogeneousmergedpixelswhichmakesinterpretationdifficultfornon-experts.Tosolvethisproblem,wehavechosen spatialunitsofgeographicalintegrationwhicharethewatershedboundaries.
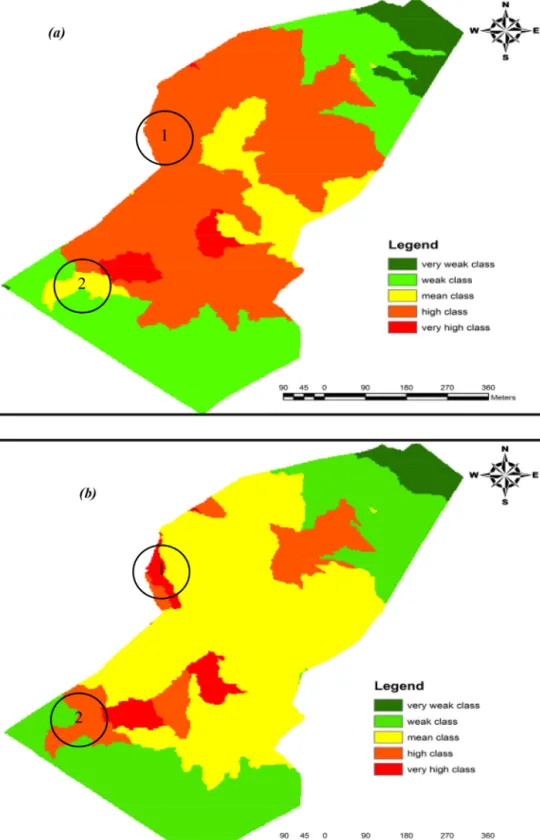
“Fig.11”showstheresultofthespatialmulti-criteriacombinationbyintegratingofriskinformationbywatershed. bythelectureoftheMapsoftwodatesshow5classeslandsthatdifferintermsofrisk,inotherwords,itrepresentsa decision-makingmapatthemunicipallevelwherethelandsareclassifiedandidentified.
2.4.2. Comparativestudyandanalysisofresults
Thechangesaredetectedandriskmapsareestablished,wenowlookingfortherelationshipbetweenthechangeinthe riskmapbetweenthetwodatesandthechangeofthelandmapandtheNDVI.
twosampleswereselectedtofindthelinksandchecktheinfluenceoftherecordedchanges,thecomparativeanalysis ofthetwosamplesisshowninTable2.
Inthefirstsampleandfromtheindexmeltingresult,degradationofvegetationisverynoticeable,whichisthesame resultobtainedbyanalysisposteclassification,changeofthevegetationinground.
Thischangehasincreasedtheriskoffloodingbypassingfromhighclasstoveryhighriskclass.
Ontheotherhandinthesecondsample,fromtheresultoftheindexmelting,degradationofvegetation,thisresult isconfirmedbytheanalysispostclassificationchangedetectionmethod,thathasbeenappliedinwhereachangeofthe vegetationingroundhasbeendetected.
Theeffectofthischangerepresentedinthefloodriskmapbyconvertingthemeanclasstothehighclass.
3. Conclusion
Themainobjectiveofthisresearchwasinfirsttimetoanalyzetheriskgeographically(istosay)i.e,identifytheparameters thatincreasestheriskoffloodinginasteppezoneElbayadh(NorthWestAlgeria)whichisanareaaffectedbytheflooding inOctober2011.
Theuseofmulti-criteriaanalysisandGIS,combinestheseparameterstoachievethefloodhazardmapswithouttaking intoconsiderationthereturnperiod,theimplementationofsuchamap,despiteitsdifficulty,doesnotmakearealproblem, butitistostudytheparametersthatcanchangeoverthetime.
Inordertochangedetection,weusedthegivenmultidates-TM(2001and2014)whosepurposewasmonitoringthe evolutionofthefactorsincreasingorattenuatingthephenomenonstudied.
Thestudyofchangealsoallowedustoidentifyareaslikelytobeaffectedbyfloodinganddeterminetheirdegreeofrisk. Acomparisonofthehazardmapswasmadesubsequentlytothelink:riskfactor&decisionmaking.
Weestimatethattheresultsofthisworkcouldformasupportofaiddecisionintermsofprevention,forecasting,and protectionofareasagainstthethreatofflooding.
Theresultsofthismapping(offloodhazardmap)arerepresentedschematicallybyasimplewayandallowtodifferent actors(users)inthefloodriskmanagementframe,usingthemtoknowhowtomanagetheterritorybeforeandafterthe crisis.
Appliedchangedetectionmethodsshowasignificantchangeespeciallyinthesward.Thischangecorrespondinthe hazardmaptoaconversionofriskclasses.Achangethatmustbetakenintoaccountbydecisionmakersinthedevelopment projectsandurbanplanningtocreateofnewurbanareas.
A.Guerroudjetal./Optik139(2017)61–71 71 References
[1]AnaïsMarshall,FrédéricBertrand,Détectiondeschangementsdanslesoasispéruviennes,analysemultitemporelleàpartirdel’indicedevégétation NDVI,2009.
[2]AntoineLefebvre,ThomasCorpetti,LaurenceHubert,Détectiondechangementsdansdesimagesàtrèshauterésolutionspatialeparanalysede texture:applicationenmilieuurbain,2009.
[3]AshokSundaresan,K.VarshneyPramod,ManojK.Arora,RobustnessofChangeDetectionAlgorithmsinthePresenceofRegistrationErrors,2007.
[4]KaroliinaKolehmainen,MonitoringandAnalysisofUrbanLandCoverChangesoverStockholmRegionbetween1986and2004using,2008.
[5]TaewooKim,YongcheolSuh,Yang-WonLee,RemoteSensingandSpatialMetricsComparisonofchangedetectionmethodsintermsofthreshold determination,2000.