HAL Id: inserm-00468705
https://www.hal.inserm.fr/inserm-00468705
Submitted on 23 Aug 2010HAL is a multi-disciplinary open access archive for the deposit and dissemination of sci-entific research documents, whether they are pub-lished or not. The documents may come from teaching and research institutions in France or abroad, or from public or private research centers.
L’archive ouverte pluridisciplinaire HAL, est destinée au dépôt et à la diffusion de documents scientifiques de niveau recherche, publiés ou non, émanant des établissements d’enseignement et de recherche français ou étrangers, des laboratoires publics ou privés.
pressure measurements to the Framingham hypertension
risk equation: the Whitehall II Study.
Mika Kivimäki, Adam Tabak, G David Batty, Jane Ferrie, Hermann Nabi,
Michael Marmot, Daniel Witte, Archana Singh-Manoux, Martin Shipley
To cite this version:
Mika Kivimäki, Adam Tabak, G David Batty, Jane Ferrie, Hermann Nabi, et al.. Incremental pre-dictive value of adding past blood pressure measurements to the Framingham hypertension risk equa-tion: the Whitehall II Study.. Hypertension, American Heart Association, 2010, 55 (4), pp.1058-62. �10.1161/HYPERTENSIONAHA.109.144220�. �inserm-00468705�
December, 2009
HYPERTENSION/2009/144220, Version 3
Incremental Predictive Value of Adding Past Blood Pressure Measurements to the
Framingham Hypertension Risk Equation: the Whitehall II Study
Mika Kivimäki, Adam G. Tabak, G. David Batty, Jane E. Ferrie, Hermann Nabi, Michael G.
Marmot, Daniel R. Witte, Archana Singh-Manoux, Martin J. Shipley
From the Department of Epidemiology and Public Health, UCL, London, UK; Finnish Institute of Occupational Health and University of Helsinki, Helsinki, Finland; Semmelweis University Faculty of Medicine, 1st Department of Medicine, Budapest, Hungary; Medical Research Council Social & Public Health Sciences Unit, Glasgow, UK; INSERM, AP-HP, Paris, France.
Short title: Hypertension Risk Prediction with Repeat Measures
WORD COUNT: Abstract 248, Text 1940
Corresponding Author: Prof. Mika Kivimäki, Department of Epidemiology and Public Health, University College London, 1-19 Torrington Place, WC1E 6BT London, United Kingdom. Tel: +44 207 679 8260, Fax +44 20 7419 6732 (m.kivimaki@ucl.ac.uk).
Abstract
Records of repeated examinations of blood pressure are increasingly available for primary care
patients, but the utility of this information in predicting incident hypertension remains unclear
because cohort studies with repeat blood pressure monitoring are rare. We compared the
incremental value of using data on blood pressure history to a single measure as in the
Framingham hypertension risk score, a validated hypertension risk prediction algorithm.
Participants were 4314 London-based civil servants (1297 women) aged 35 to 68 who were free
from prevalent hypertension, diabetes and coronary heart disease at baseline examination (the
Whitehall II study). Standard clinical examinations of blood pressure, weight and height, current
cigarette smoking and parental history of hypertension were undertaken on a 5-yearly basis. A
total of 1052 incident (new-onset) cases of hypertension were observed in two 5-year
baseline-follow-up data cycles. Comparison of the Framingham risk score with a score additionally
incorporating 5-year blood pressure history showed, at best, modest improvements in indicators
of predictive performance: C-statistics (0.796 vs 0.799), predicted-to-observed ratios (1.04,
95%CI: 0.95-1.15 vs 0.98, 95%CI: 0.89-1.08) or Hosmer-Lemeshow chi-square values (11.5 vs
6.5). The net reclassification improvement with the modified score was 9.3% (95%CI:
4.2%-14.4%) resulting from a net 17.1% increase in non-hypertensives correctly identified as being at
lower risk, but a net 7.8% increase in hypertensives incorrectly identified as at lower risk. These
data suggest that despite the net reclassification improvement, the clinical utility of adding
repeat measures of blood pressure to the Framingham hypertension risk score may be limited.
Key Words: Hypertension ● prevention ● primary prevention ● public health ● risk assessment ● risk factors.
INTRODUCTION
Preventive interventions can delay the onset of hypertension (systolic/diastolic blood
pressure>140/90 mm Hg).1-4 Current risk prediction tools to target preventive interventions at
individuals with the highest risk of hypertension, such as the Framingham hypertension risk
score,5,6 are based on clinical data taken from a single examination. However, records of repeat
blood pressure examinations are increasingly available for primary care patients. We therefore
examined whether adding past blood pressure measurements to the Framingham hypertension
risk algorithm actually improves its predictive power.
METHODS
Population and Study Design
Data are taken from the Whitehall II study, a large-scale prospective cohort study of 10,308 civil
servants (6895 men, 3413 women) aged 35-55 at the start of the study (Phase 1, 1985-1988).7
Since the Phase 1 medical examination, follow-up examinations have taken place approximately
every 5 years: Phase 3 (1991-1993), n=8104; Phase 5 (1997-1999), n=6551; and Phase 7
(2003-2004), n=6483.
The present analysis was based on 2 history-baseline-follow-up screening cycles, each
with 3 blood pressure examinations, the first for blood pressure history, the second for blood
pressure at baseline and the third for follow-up blood pressure (Figure 1). Participants were
eligible for inclusion if they attended three consecutive screenings between Phase 1 and Phase 7.
This resulted in 6210 and 5691 eligible participants at the two baseline phases, Phase 3 and
Phase 5. At the baseline for both screening cycles, we successively excluded participants who
respectively), had cardiovascular disease (n=75 and n=137), diabetes (n=39 and n=62), or
missing data on any risk factors (n=313 and n=826). After these exclusions, 4141 participants at
Phase 3 and 2779 participants at Phase 5 remained and formed the sample for the analyses.
Assessment of Risk Factors and Prevalent Disease
Assessment of risk factors has been described previously.6 Briefly, we measured systolic and
diastolic blood pressure twice in the sitting position after 5 minutes rest with the Hawksley
random-zero sphygmomanometer (Phases 1 to 5) and OMRON HEM 907 (Phase 7)
(hypertension risk prediction was not sensitive to the measure of blood pressure used).6 The
average of each of the systolic and diastolic blood pressure readings was used. Current smoking
and parental hypertension were self-reported. Weight was measured in underwear to the nearest
0.1 kg on Soehnle electronic scales. Height was measured in bare feet to the nearest 1 mm using
a stadiometer with the participant standing erect with head in the Frankfort plane. Body mass
index (BMI) was calculated as weight (kilograms)/height (meters) squared.
Prevalent coronary heart disease was defined using MONICA criteria,8 or positive
responses to questions about chest pain9 and physician diagnoses, or evidence from medical
records, or positive ECG findings. Diabetes was defined as a fasting glucose ≥7.0 mmol/L, a 2-hr postload glucose ≥11.1 mmol/L (75g oral glucose tolerance test), reported doctor-diagnosed
diabetes, or use of diabetes medication.10
Assessment of Incident Hypertension
Hypertension was defined according to the 7th report of the Joint National Committee on
(systolic/diastolic≥140/90 mmHg or use of antihypertensive medication).1 At both screening
cycles, we determined incident (new cases) hypertension by presence of hypertension at
follow-up among participants free of this condition at baseline.
Statistical Analysis
Participants were followed across the two screening cycles until incident hypertension or last
study phase, whichever came first, contributing to a total of 6920 person-examinations (each
participant contributed observations to one or two person-examinations) (Figure 1). As in
previous analyses,6 we selected at random 60% of these observations (0, 1 or 2 per participant) for a ‘derivation’ dataset and allocated the remaining 40% of the observations to a ‘validation’
dataset. We developed a risk prediction score based on the derivation data, using the same
variables as those used for the Framingham hypertension risk score and, additionally, records of
systolic and diastolic blood pressure from the phase preceding the baseline. We identified
significant predictors and interaction terms for incident hypertension in multivariable adjusted
Weibull regression models for interval censored data. To examine the robustness of this model,
we repeated the analysis in a subcohort limited to the participants of the first data cycle only (ie
individuals with data on blood pressure history obtained from phase 1, other risk prediction
components including the Framingham risk score at phase 3, and incident hypertension status at
phase 5).
We calculated a risk prediction score (‘the repeat measure risk score’) for the validation
dataset from the β-coefficients obtained from the derivation dataset and calculated the
Framingham risk score, using the β-coefficients derived in the Framingham study5
as described
risk score in the validation dataset using three methods: first, discrimination based on
C-statistics (1 indicates perfect discrimination and 0.5 indicates no discrimination); second, the
predicted-to-observed risk ratio calculations and calibration indicated by the Hosmer-Lemeshow
chi-square statistics (<20 indicates good calibration); and, third, net reclassification index (NRI)
to examine whether prediction based on the Framingham risk score was significantly improved
following reclassification based on the repeat measure risk score.11
We then developed two alternative repeat measure risk prediction scores in the derivation dataset: the average blood pressure risk score and the ‘usual’ blood pressure risk
score. For the first algorithm, we calculated the average of the current and previous blood
pressure measurements from different time points and entered this, instead of current and
previous blood pressure measurements, in the risk prediction score. To obtain the latter score, we calculated ‘usual’ systolic and diastolic blood pressures at the previous time point according
to the formula: UBPi = BPbm + (RDR x (BPbi - BPbm) where UBPi refers to each participant’s
usual blood pressure, BPbm to the average blood pressure in the population, RDR to the
regression dilution ratio, and BPbi to the participant’s blood pressure.12 We derived the
regression dilution ratio for a non-hypertensive population by using the mean values of the
previous and current blood pressures which were computed within quartiles of the previous
blood pressure. The difference in mean blood pressure between the lowest and highest quartiles for the previous blood pressure (Δ1) and the current blood pressures (Δ3) were calculated and
their ratio (Δ3/Δ1) used to estimate the regression dilution ratio. We then entered 'usual' blood
pressure as a component of the risk prediction algorithm in addition the Framingham score
blood pressure risk scores in the validation dataset in a similar manner to that used for the repeat
measure risk score.
All analyses were run with SAS version 9.2.
RESULTS
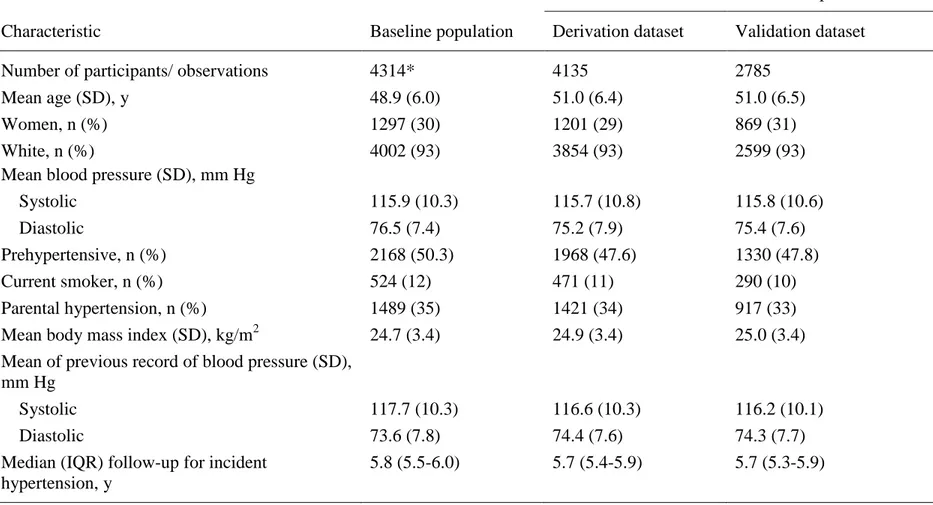
Table 1 presents clinical features for the baseline participants (those 4141 with Phase 3 as the
baseline and additionally those 173 whose first baseline was phase 5) and the derivation and
validation subcohorts. As expected, the cohorts were very similar. During the 2 examination
cycles (median length from baseline to follow-up 5.8 years), we recorded a total of 1052
incident hypertension cases.
Repeat Measure Risk Prediction Score
The multivariable-adjusted Weibull β-coefficients for incident hypertension, based on the
derivation dataset, showed a significant effect of blood pressure history on hypertension
independently of the Framingham score components (please see http://hyper.ahajournals.org,
Table S1) and this finding was replicated in a sensitivity analysis of participants from the first
data cycle only (Table S2). The coefficients from the derivation dataset were used to calculate
the repeat measure risk score for the validation dataset.
The observed 5-year risk of incident hypertension was 13.1 per 100 (438 incident
hypertension cases). The C-statistic was 0.796 for the Framingham risk score and 0.799 for the
repeat measure risk score, indicating good discrimination for both. The agreement between the
predicted and observed incidence of hypertension was also equally good for the Framingham
and the repeat measure risk score [12.8 per 100, 0.98 (0.89 to 1.08)]. Hosmer-Lemeshow
chi-square values of 11.5 for the Framingham score and 6.5 for the repeat measure risk score were
both lower than 20, indicating good calibration.
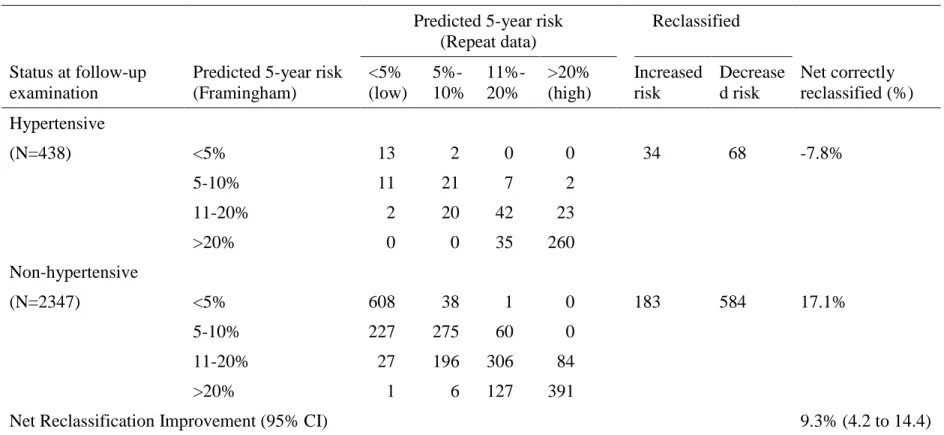
Table 2 shows the reclassification of individuals between risk categories after replacing
the Framingham risk score with the repeat measure risk score. The net reclassification
improvement was 9.3% (95% CI 4.2 to 14.4), suggesting that replacing the Framingham risk
score with the repeat measure risk score results in a statistically significant improvement in the
prediction of incident hypertension. Repeating this analysis with other categorizations of risk led
to similar results [for risk categories: <5%, 5%-20%, >20%: NRI 6.5% (2.2 to 10.8); for risk
categories: <5%, 5%-10%, >10%: NRI 10.2% (6.7 to 13.8)].
If the >20% predicted 5-year risk of developing hypertension category is used as the
criterion to initiate preventive intervention, the risk prediction with repeat measure score would
lead to 20.2% (475/2347, Table 2) of the subjects unnecessarily targeted for preventive
treatment compared to 22.4% (525/2347) using the Framingham score. Use of the repeat
measure score would correctly predicted 65.1% (285/438) of the incident hypertension cases
while the corresponding figure for the Framingham score is slightly greater (67.4% (295/438).
With a 10%-predicted-risk threshold for the intervention, the corresponding figures for the
repeat measure score and the Framingham score would be 41.3% vs. 48.5% (969 vs. 1138
unnecessary treatments) and 84.2% vs. 87.2% (369 vs. 382 correctly targeted treatment).
Risk Prediction Score Based on Average and Usual Blood Pressures
The multivariable-adjusted Weibull β-coefficients for incident hypertension, based on the
http://hyper.ahajournals.org, Table S3) to be stronger than those of blood pressure history and
baseline blood pressure as separate terms (Table S1). However, the C-statistic of 0.794 and the
predicted-to-observed ratio of 0.96 (95% CI 0.88 to 1.06) did not indicate superior predictive
performance for the risk score based on average blood pressure compared to the Framingham
risk score or the repeat measure risk score. The reclassification improvement of individuals
between risk categories after replacing the Framingham risk score with the average blood
pressure risk score was 5.8% (95% CI 0.1 to 11.4)(Table S5), suggesting that replacing the
Framingham risk score with the average blood pressure risk score results in a modest
improvement in the prediction of incident hypertension. However, comparing this risk score
which incorporates average blood pressure with the risk score which incorporates current and
previous blood pressure as separate terms resulted in a reclassification improvement of -3.4%
(95% CI -7.0 to 0.1) (Table S5). This suggests that the explicit use of separate terms for current
and previous blood pressure is more beneficial than the use of average blood pressure in the
prediction of future hypertension risk. When using 'usual' blood pressure, these terms in the risk
score gave larger hazard ratios for incident hypertension (Table S4) than those based on
observed previous blood pressure (Table S1). However, the predictive performance of using ‘usual’ blood pressure together with the current blood pressure in the risk score gave identical
results, in terms of prediction, to those using observed previous and current blood pressure.
DISCUSSION
In this study of a large non-hypertensive British population, repeat measures of blood pressure
independently predicted the risk of developing hypertension. However, information from repeat
measures of blood pressure and use of average or usual blood pressures in the risk algorithm
improved indices of calibration and the ability of the Framingham hypertension risk score to
discriminate future hypertension events only marginally.
We observed a 9.3% improvement in reclassification of hypertension risk by using past
blood pressure measurements in addition to the Framingham risk score variables. This
improvement was a result of a 17.1% increase in non-hypertensives correctly identified as being
at lower risk but also a 7.8% increase in hypertensives incorrectly identified as at lower risk.
Thus, the adoption of the repeated measures risk prediction model would reduce any harm
related to unnecessary preventive treatments (e.g., waste of health care resources, side-effects
related to the treatment), but increases missed prevention opportunities. The reduction in the
number of unnecessary treatments was meaningful only when applying a low (10% rather than
20%) risk threshold for treatment, but it came with the cost of missing 2-3% of patients who
actually develop hypertension.
Perspective
This appears to be the first report estimating the clinical utility of adding past blood pressure
data to the Framingham hypertension risk score. Despite the statistically significant net
reclassification improvement, our findings suggest that incorporating previous blood pressure
records or estimates of average or usual blood pressure in the risk score provides relatively
Sources of Funding
Medical Research Council; British Heart Foundation; Wellcome Trust; Health and Safety
Executive; Department of Health; Agency for Health Care Policy Research, UK; John D and
Catherine T MacArthur Foundation Research Networks on Successful Midlife Development and
Socio-economic Status and Health; National Heart, Lung, and Blood Institute (R01HL036310)
and National Institute on Aging (R01AG013196 and R01AG034454), NIH, US; Academy of
Finland, Finland; BUPA Foundation, UK; and European Science Foundation. GDB is a
Wellcome Trust Fellow. AS-M is supported by a "European Young Investigator Award" from
the European Science Foundation. MM is supported by an MRC Research Professorship. MJS is
supported by the British Heart Foundation.
Conflict(s) of Interest/Disclosure(s) Statement
References
1. Chobanian AV, Bakris GL, Black HR, Cushman WC, Green LA, Izzo JL, Jr., Jones DW,
Materson BJ, Oparil S, Wright JT, Jr., Roccella EJ. Seventh report of the Joint National
Committee on Prevention, Detection, Evaluation, and Treatment of High Blood Pressure.
Hypertension. 2003;42:1206-1252.
2. Effects of weight loss and sodium reduction intervention on blood pressure and
hypertension incidence in overweight people with high-normal blood pressure. The
Trials of Hypertension Prevention, phase II. The Trials of Hypertension Prevention
Collaborative Research Group. Arch Intern Med. 1997;157:657-667.
3. Julius S, Nesbitt SD, Egan BM, Weber MA, Michelson EL, Kaciroti N, Black HR,
Grimm RH, Jr., Messerli FH, Oparil S, Schork MA. Feasibility of treating
prehypertension with an angiotensin-receptor blocker. N Engl J Med.
2006;354:1685-1697.
4. He J, Whelton PK, Appel LJ, Charleston J, Klag MJ. Long-term effects of weight loss
and dietary sodium reduction on incidence of hypertension. Hypertension.
2000;35:544-549.
5. Parikh NI, Pencina MJ, Wang TJ, Benjamin EJ, Lanier KJ, Levy D, D'Agostino RB, Sr.,
Kannel WB, Vasan RS. A risk score for predicting near-term incidence of hypertension:
the Framingham Heart Study. Ann Intern Med. 2008;148:102-110.
6. Kivimäki M, Batty GD, Singh-Manoux A, Ferrie JE, Tabak AG, Jokela M, Marmot MG,
Davey Smith G, Shipley MJ. Validating the Framingham Hypertension Risk Score.
7. Marmot MG, Davey Smith G, Stansfeld S, Patel C, North F, Head J, White I, Brunner E,
Feeney A. Health inequalities among British civil servants: the Whitehall II study.
Lancet. 1991;337:1387-1393.
8. Tunstall-Pedoe H, Kuulasmaa K, Amouyel P, Arveiler D, Rajakangas AM, Pajak A.
Myocardial infarction and coronary deaths in the World Health Organization MONICA
Project. Registration procedures, event rates, and case-fatality rates in 38 populations
from 21 countries in four continents. Circulation. 1994;90:583-612.
9. Rose GA, Blackburn H, Gillum RF, Prineas RJ. Cardiovascular Survey Methods. 2nd ed.
Geneva: World Health Organization; 1982.
10. WHO. Definition, diagnosis and classification of diabetes mellitus and its complications.
Geneva: World Health Organization; 1997.
11. Pencina MJ, D'Agostino RB, Sr., D'Agostino RB, Jr., Vasan RS. Evaluating the added
predictive ability of a new marker: from area under the ROC curve to reclassification and
beyond. Stat Med. 2008;27:157-172.
12. Gasowski J, Li Y, Kuznetsova T, Richart T, Thijs L, Grodzicki T, Clarke R, Staessen JA.
Is "usual" blood pressure a proxy for 24-h ambulatory blood pressure in predicting
FIGURE LEGENDS
Table 1. Characteristics of the Participants
Person-examinations across follow-up
Characteristic Baseline population Derivation dataset Validation dataset Number of participants/ observations 4314* 4135 2785
Mean age (SD), y 48.9 (6.0) 51.0 (6.4) 51.0 (6.5)
Women, n (%) 1297 (30) 1201 (29) 869 (31)
White, n (%)
Mean blood pressure (SD), mm Hg
4002 (93) 3854 (93) 2599 (93) Systolic 115.9 (10.3) 115.7 (10.8) 115.8 (10.6) Diastolic 76.5 (7.4) 75.2 (7.9) 75.4 (7.6) Prehypertensive, n (%) 2168 (50.3) 1968 (47.6) 1330 (47.8) Current smoker, n (%) 524 (12) 471 (11) 290 (10) Parental hypertension, n (%) 1489 (35) 1421 (34) 917 (33) Mean body mass index (SD), kg/m2 24.7 (3.4) 24.9 (3.4) 25.0 (3.4) Mean of previous record of blood pressure (SD),
mm Hg
Systolic 117.7 (10.3) 116.6 (10.3) 116.2 (10.1)
Diastolic 73.6 (7.8) 74.4 (7.6) 74.3 (7.7)
Median (IQR) follow-up for incident hypertension, y
5.8 (5.5-6.0) 5.7 (5.4-5.9) 5.7 (5.3-5.9)
*Includes all participants with phase 3 as the baseline (n = 4141) and additionally those whose first baseline was phase 5 (n = 173).
Table 2. Reclassification of the Predicted Risk of Incident Hypertension between Phases of Follow-up, Based
on the Framingham vs. Repeated Measures Risk Prediction Score in the Validation Dataset (2785
Observations).
Predicted 5-year risk (Repeat data)
Reclassified
Status at follow-up examination
Predicted 5-year risk (Framingham) <5% (low) 5%-10% 11%-20% >20% (high) Increased risk Decrease d risk Net correctly reclassified (%) Hypertensive (N=438) <5% 13 2 0 0 34 68 -7.8% 5-10% 11 21 7 2 11-20% 2 20 42 23 >20% 0 0 35 260 Non-hypertensive (N=2347) <5% 608 38 1 0 183 584 17.1% 5-10% 227 275 60 0 11-20% 27 196 306 84 >20% 1 6 127 391