HAL Id: hal-03018472
https://hal-paris1.archives-ouvertes.fr/hal-03018472
Submitted on 22 Nov 2020HAL is a multi-disciplinary open access archive for the deposit and dissemination of sci-entific research documents, whether they are pub-lished or not. The documents may come from teaching and research institutions in France or abroad, or from public or private research centers.
L’archive ouverte pluridisciplinaire HAL, est destinée au dépôt et à la diffusion de documents scientifiques de niveau recherche, publiés ou non, émanant des établissements d’enseignement et de recherche français ou étrangers, des laboratoires publics ou privés.
non-humans
Ivan Chase, Raphaël Douady, Dianna Padilla
To cite this version:
Ivan Chase, Raphaël Douady, Dianna Padilla. A comparison of wealth inequality in hu-mans and non-huhu-mans. Physica A: Statistical Mechanics and its Applications, Elsevier, 2020, �10.1016/j.physa.2019.122962�. �hal-03018472�
A Comparison of Wealth Inequality in Humans and Non-Humans
Ivan D. Chase 1, *, Raphael Douady 2, Dianna K. Padilla 3
1 Department of Sociology and Graduate Program in Ecology and Evolution, Stony Brook
University, Stony Brook, NY, USA
2 Department of Applied Mathematics and Statistics, Stony Brook University, Stony Brook, NY,
USA
3 Department of Ecology and Evolution, Stony Brook University, Stony Brook, NY, USA
* Correspondence to: Department of Sociology, Stony Brook University, Stony Brook University, Stony Brook, NY 11794-4356, USA.
E-mail address: ivan.chase@stonybrook.edu.
HIGHLIGHTS
● We present the first description of “wealth” inequality in a non-human animal ● We describe the distribution of snail shells occupied by a hermit crab species
● The distribution of shells resembles the common form of human wealth distributions ● Hermit crabs may provide an animal model of the dynamics generating wealth inequality ● Shell distribution in hermit crabs provides a baseline to compare to human inequality
Keywords:
Wealth distribution
Power-law (Pareto) distributions Fat tails
Vacancy chains Hermit crabs
Human-animal comparisons
ABSTRACT
Inequality in the distribution of material resources (wealth) occurs widely across human
groups. The extent of inequality, as measured by the Gini coefficient, is less in small-scale
nation states. In many societies, the statistical distribution of wealth takes a characteristic form:
unimodal, skewed to the right, and fat-tailed. However, we have relatively little systematic
information about the distribution of material resources in nonhuman animals even though such
resources are vital to their survival and fitness. Here we present the first description of inequality
in material resources in an animal population: the distribution of gastropod (snail) shells
inhabited by the hermit crab Pagurus longicarpus. We find that the shell distribution for the
crabs strongly resembles the characteristic form of wealth distribution in human groups. The
amount of inequality in the crabs is more than that in some small-scale human groups but less
than that in nations. We argue that the shell distribution in the crabs is not simply generated by
biological factors such as survival and growth of either crabs or gastropods. Instead, the strong
resemblance in the human and hermit crab distributions suggests that comparable factors, not
dependent upon culture or social institutions, could shape the patterns of inequality in both
groups. In addition to the similarity in their inequality distributions, human and hermit crabs
share other features of resource distribution, including the use of vacancy chains, not seen in
other species. Based upon these parallels, we propose that P. longicarpus could be used as an
animal model to test two factors – individual differences and intergenerational property transfers – that some economists theorize as major factors influencing the form of wealth distributions in
humans. We also propose that inequality in hermit crabs could provide a baseline for examining
human inequality.
1. INTRODUCTION
Inequality in material possessions, or wealth, occurs widely in human societies.
Researchers have documented it in contemporary as well as historical societies, and in large- as
distribution of material possessions in nonhuman animals, even though things such as nests,
dens, shelters, and territories are important to survival and fitness [5]. Here, we present, as far as
we know, the first description of “wealth” inequality in an animal population: the statistical
distribution of empty gastropod (snail) shells occupied by individuals of the hermit crab Pagurus
longicarpus (but see [6] for a comparison of human wealth inequality and species
abundance).We compare the distribution we find in the crabs with that in various human groups.
It might seem surprising to compare inequality in humans and hermit crabs since, in most
respects, they are very different as species. Their evolutionary lines split over 550 million years
ago, and hermit crabs are completely without culture and social institutions. However, human
resources and snail shells as used by hermit crabs do share a number of abstract qualities.
Resources in both species are often scarce, discrete, owned by identifiable individuals, and
quantifiable in size or value. In addition, in many cases, both shells in hermit crabs and resources
in humans are distributed through the process known as vacancy chains (defined below).
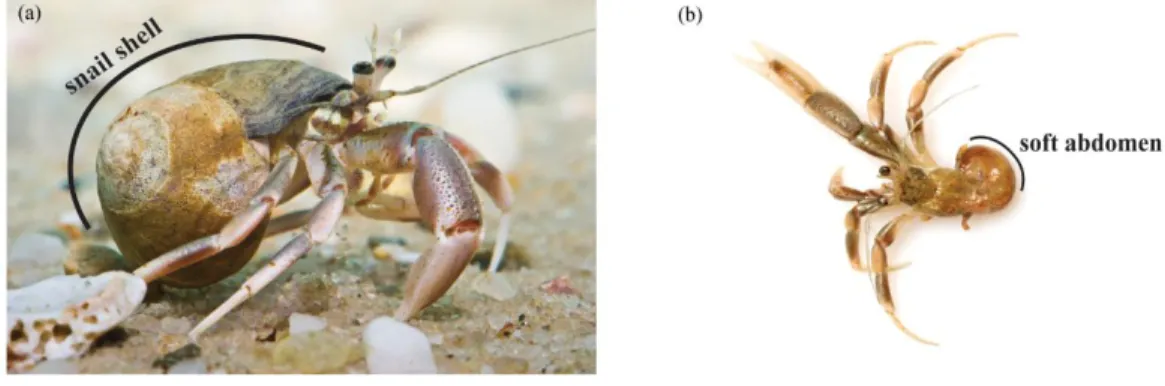
Fig. 1. P. longicarpus hermit crab. (a) The crab in its snail shell. (b) The crab removed from its
Virtually all of the approximately 1100 species of hermit crabs have soft abdomens
(Figure 1) and live in and carry around the shells of dead gastropods (snails) as portable shelters
for protection against predators and desiccation [7,8]. Because hermit crabs grow throughout
their lives, they must frequently find new and larger shells. However, most hermit crabs cannot
kill snails. Instead, new shells enter a population of crabs when predators, disease, or
environmental conditions kill gastropods [9,10]. Consequently, new shells are often in short
supply, especially those needed by larger individuals [11,12,13].
How could the distribution of wealth in humans compare to the distribution of shells in
hermit crabs? One possibility is that the two distributions should be very different. It seems
reasonable that human wealth distribution should reflect complex mechanisms based upon
culture and social institutions, while the shell size distribution should be driven simply by
biological forces such as survival and growth in either the crabs or the gastropods whose shells
the crabs occupy. That is, if biological forces determined shell distribution it should reflect either
(1) the size distribution of surviving crabs (assuming the proper shell sizes were available from
dead snails) or (2) the size distribution of shells from dying gastropods. In other words,
according to these two hypotheses, either the biological factors of crab growth or snail deaths
should determine the distribution of shell sizes occupied by the crabs.
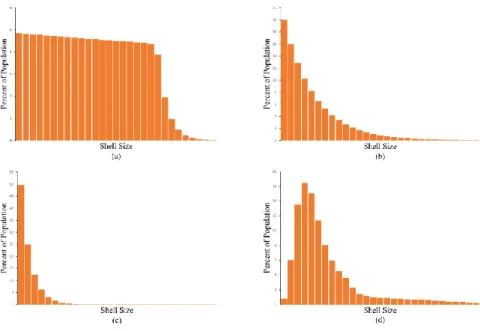
We have adapted the three classic survivorship patterns from ecology [14] to predict what
the shell distributions should be according to these hypotheses. If the first hypothesis were
correct, that the shell distribution was determined by crab growth and survival, the distribution
could fit any one of the three classic patterns: Type I if all size classes of crabs had a high
probability of survival until senescence (Figure 2a), Type II if the crabs had a constant rate of
In the second hypothesis were correct, that the shell distribution was determined by the
survival patterns in the snails, research indicates that the distribution should resemble a Type III
pattern. Gosselin and Qian [15] report, for example, that most gastropod species studied have a
Type III survivorship pattern (Figure 2c). Due to the very high rate of death in very small snails,
the great majority of crabs should be in very small shells with much smaller percentages in shells
just a bit larger.
A third hypothesis is that the crab shell distribution takes a form like those commonly
reported for humans (Figure 2d). These latter wealth distributions are typically unimodal,
right-skewed, and fat-tailed. Perhaps, in contrast to the first two hypotheses, there are some
fundamental forces that create similar inequality distributions across species, even in the absence
of culture.
Fig. 2. Four possible distributions of shell sizes occupied by P. longicarpus. Distributions (a) –
have a high probability of survival until senescence (Type I curve). (b) Individuals have a
constant rate of mortality (Type II curve). (c) Most individuals die at an early age (Type III
curve). (d) The typical form of a human wealth distribution. (Note: Curves (a) – (c) are not
drawn on log scales as is usual for survivorship curves.)
2. METHODS
2.1 Sampling. We studied the distribution of shell sizes in Pagurus longicarpus, a small hermit
crab common on the eastern coast of the North America from the Gulf of Mexico to Nova Scotia,
Canada. We gathered the crabs (N = 297) on several low tides in a pool approximately 140 m by
35 m at West Meadow Beach on Long Island, New York (40˚56’41”N, 73˚8’41”W). We
collected the crabs at random locations within the pool using a 0.5 x 0.5 m quadrat and carefully
sorted through the sandy substrate to make sure we did not miss crabs in small shells. Because
we only sampled in one location, future studies should sample hermit crabs in various locations
to assess the generality of our findings.
2.2 Removing Crabs from Their Shells. We removed the hermit crabs from their shells by brief
immersion in warm (35°C) fresh water. We then weighed each crab (damp weight ± 0.001 g)
and measured its carapace length (digital calipers, ± 0.01 mm). The crabs ranged in weight from
0.003 g to 0.522 g and in carapace length from 1.3 mm to 7.66 mm. After measuring the crabs,
we gave each a new shell and returned them to the beach approximately 400 m from where they
were collected.
2.3 Measuring Shells. We dried the shells taken from the crabs at 60°C for at least 24 hours and
then weighed them, measured their length (maximum dimension along the coiling axis) and
condition of each shell. Following many other studies on hermit crabs, we used shell weight as
the best measure of resource size for our crabs [7,12,16]. Nearly all of the crabs were in Tritia
(Ilyanassa) trivittata and Tritia (Ilyanassa) obsoleta shells. Since these species have
geometrically similar shells, we used shell weight as a measure of size for both species. The
weights of the shells ranged from 0.022 g to 0.984 g.
2.4 Gini Coefficient. The Gini coefficient measures the inequality of the distribution of a
numerical quantity in a given population, for instance, the wealth of individuals or households,
or the size of animals. Intuitively, if all individuals in the sample have the same wealth or size,
Gini = 0. If one of them has all of the wealth, and all the others have zero wealth, then Gini = 1 –
1/n (where n is the population size). In practice, given a series of values x1,…, xn of the quantity
in the sample population, the Gini coefficient is given by the following formula [17]:
Gini = ∑ |𝑥𝑖 − 𝑥𝑗| 𝑛 𝑖,𝑗=1 (2𝑛 ∑ 𝑥𝑖 𝑛 𝑖=1 ) ⁄
2.5 Hill Estimation of a Power-Law Exponent. When a sample (x1,…,xn) is distributed
according to a power law, the resulting fat tail prohibits using usual moments of the distribution
to estimate parameters. In this case it is preferable to use the Hill estimator to get an estimate of
the power law exponent that drives the thickness of the tail [18].
If the sample follows a Pareto law with exponent α, the proportion of data points above a given threshold is proportional to –. If one rearranges the sample (x
[1],…,x[n]) in decreasing
order (assuming we are estimating the right hand side tail of the distribution), x[1] is the largest
the number k of samples of data points larger or equal to should be –α = x
[k]– . Then by
taking the logarithm, we get: Ln(k) = – Ln(x[k]) + with = Ln().
To use the Hill estimator of the power law exponent, one selects a portion of the largest elements of the sample (x[1],…,x[k]), with k = n (more precisely the integer part of n, typically
= 10% - 15%, with 13% the value which is used in our calculations). One then performs a linear regression (with constant) of (y1,…,yk) with yi = Ln(i) against (1,…,k) with I = Ln(x[i]).
Because yi increases whereas I decreases, the slope is negative and the coefficient α, which is
the negative of the slope, is positive. The intercept is useful to determine the distribution quantiles.
3. RESULTS
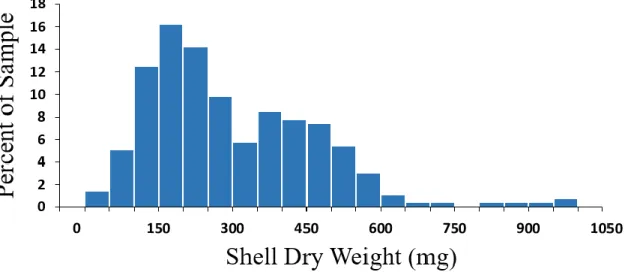
The distribution of shell sizes that we found in a random sample of 297 crabs (Figure 3)
does not resemble any of those distributions suggested by the first two hypotheses (Figure 2a-c).
In particular, the actual shell distribution is not like Figure 2c, which is based upon a Type III
pattern that is common in many snails and other marine invertebrates [15]. Consequently, the
shell distribution does not appear to be a simple reflection of the biological features of either crab
or snail growth and survival.
The distribution observed (Figure 3) does, however, resemble the one in Figure 2d - the
common form of human wealth distributions. Like those distributions, it has a major mode and is
skewed to the right with a fat tail. However, the observed distribution also has a secondary mode
the 300 to 349.9 mg. range. This deficit could have arisen through statistical randomness, or it
could be due to causes that are not relevant for understanding the equilibrium distribution.
Fig. 3. The observed distribution of shell sizes occupied in P. longicarpus. Shell size is indicated
by weight in milligrams. This distribution resembles those commonly found for wealth in human
groups.
In general the distribution of shells exhibits a level of inequality more like that in small-scale
human groups rather than in large-scale, nation-based ones. First, the Gini coefficient for the
crabs is 0.32 (0.02 standard deviation of the estimation of the Gini with two-sided , 5%
confidence interval = 0.285 – 0.35). This is greater than the estimates for some small-scale
human groups but less than those for present nation states. For example, Kohler et al. [4] report
median Ginis for samples of hunter-gatherers, horticulturalists, and agriculturalists as 0.17, 0.27,
and 0.35, respectively, while Borgerhoff Muldler et al. [3] give average Ginis for material wealth
in samples for the same kind of groups at 0.36, 0.52, and 0.57. The Ginis for nation states run
from about 0.55 for Japan to 0.80 for the United States [19]. By coincidence, Piketty [14] suggests that the Gini in an “ideal” human society would be 0.33.
Second, the extent of the right skew in the shell distribution for the crabs is not as
extreme as that in large-scale human societies. In large-scale human societies, some people
accrue enormous amounts of wealth compared to the median levels in their groups. This
produces a more extreme right tail in the distributions for those societies. For example, in the
contemporary United States the richest 1% of the population owns nearly 40% of the total wealth
[20]. In our sample of hermit crabs, however, there are no Warren Buffets or Jeff Bezoses, and
the top 1% of the crabs only owns about 3.2% of the total shell weight. However, our sample
may somewhat underrepresent the skew of the shell distribution. Just as even a large sample
would probably underrepresent the proportion of exceedingly rich people in a human population,
our sample may have missed some crabs with very large shells. In fact, there are reports that P.
longicarpus crabs are capable of occupying larger shells than the ones used by crabs in our
sample [21].
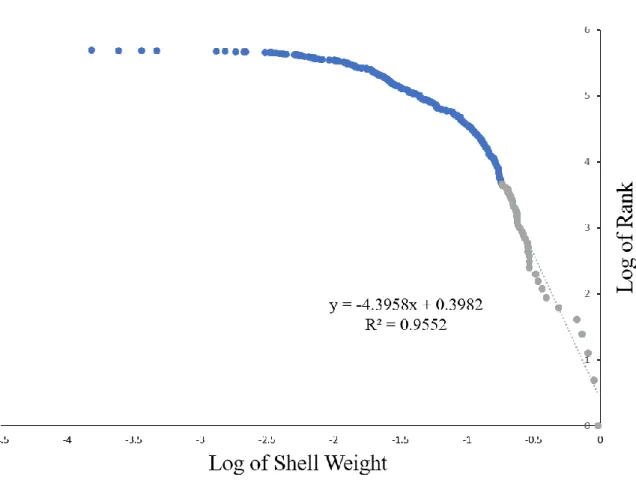
Third, the power-law exponent for the shell distribution is considerably smaller than that
for many large-scale human societies. Many researchers suggest that the tails of human wealth
distributions can be modeled by a power-law or Pareto distribution [22,23]. Power-law
distributions are characterized by some quantity raised to a negative power, and the size of that
exponent can provide a measure of the fatness of the tail of a wealth distribution. Smaller
negative exponents indicate fatter tails and larger negative powers denote thinner tails. Typical
estimates for the exponents in the power-law portions of wealth distributions in large-scale,
market-based human groups are in the range of a little more than -1.0 to a little under -3.0. Our
estimate of the power-law exponent for the shell distribution is -4.4 (Figure 4). Thus, the right
nations (but see [24] for the problems in estimating power-law exponents in wealth and other
distributions).
Fig. 4. Hill estimation of the power-law exponent for the shell distribution. The exponent is
given by the slope of the log-log regression of the ranks of the shells versus their size. The
regression is for the 39 largest shells in the sample. For a sample of n = 39, given the slight bias of this estimator for small samples, an unbiased estimate of the shape parameter is around -4.7, while its uncertainty (standard deviation of the error) is α√2 n⁄ = 0.98.
Our results indicate that the distribution of shells occupied in P. longicarpus is generally
similar in form to distributions of wealth in human societies, especially those in small-scale
human groups. What could cause this similarity? One possibility is that the resemblance could be
purely coincidental. Many different mechanisms can produce unimodal distributions skewed to
the right with fat tails. Consequently, the two distributions could be generated by entirely
different kinds of mechanisms. By the same token, it is also possible that the likeness of wealth
distributions in different human groups is also coincidental and generated by different
mechanisms, say, for example, in hunter-gatherers and developed nations.
A second possibility is that analogous factors in both hermit crabs and humans generate
the similarity in their inequality distributions. If this were the case, those analogous factors
would have to be of the most basic sort since, as noted above, hermit crabs are so different in
most respects from human beings.
What could those comparable factors be? Researchers have suggested two possibilities
for explaining the forms of human inequality distributions that we propose might also work for
hermit crabs: individual differences and resource transfer. Approaches using individual
differences to account for human inequality distributions, such as human capital theory and a
variety of mathematical models, assume that people gain wealth in relation to their talents (such
as training, education, and personality) plus, in some cases, random events [25,26,27,28]. In
contrast, the intergenerational property transfer approach assumes that the form of the wealth
distribution is strongly influenced by bequests and gifts from one generation to another
[3,27,29,30,31,32]. A bequest is a property transfer made to one individual upon the death of
Researchers attempt to evaluate these two approaches by building models based upon
them and then comparing the wealth distributions thus generated with wealth distributions
derived from empirical studies. Some of the liabilities of this reverse engineering, or attempt at
inverse modelling, of social hierarchies are discussed in Chase and Lindquist [33]. However, we
suggest that the core assumptions of these two approaches on the form of inequality distributions
can be experimentally evaluated by using hermit crabs. This would allow us to directly observe
the dynamics actually generating inequality systems.
In hermit crabs there is no deliberate intergenerational transfer of property. However,
crabs do transfer gastropod shells to one another through vacancy chain processes [16], and
experimenters can readily observe these processes under laboratory conditions. In a vacancy
chain, a new resource unit coming into a population sets off a series of transfers among several
individuals allowing them to obtain new and usually larger units. For example, in hermit crabs,
when a snail dies, its shell may be taken by a first crab that leaves its old and usually smaller
shell behind. A second crab will then occupy the abandoned shell left by the first crab and desert
its previous, smaller shell, and so on. In humans, vacancy chains occur in the distribution of
houses, jobs, and cars [34,35,36,37].
A possible experiment to evaluate the importance of property transfers on inequality in
the distribution of snail shells in hermit crabs is as follows: An experimenter assembles a large
number of groups of hermit crabs all having the same-sized, small shells. The experimenter
periodically gives each group of crabs new, empty snail shells of the same size on an identical
schedule. However, the experimenter allows vacancy chains to proceed in half of the groups (the
treatment groups), but not in the other half (the comparison groups). For the comparison groups,
shell transfers from one crab to another. In the treatment groups, allowed to use vacancy chains,
the experimenter does not remove the old shells abandoned by those crabs taking the initial
shells, allowing shell transfers among crabs. Previous research has shown that about three crabs
get new snail shells in a vacancy chain: one crab gets the initial shell and two get shells via
transfers [16]. If property transfers are an important factor in generating the form of the shell
inequality distribution we observed for the crabs we collected (Figure 3), we would expect that
unimodal, right-skewed, and fat-tailed distributions would emerge over time in the group
allowed to have vacancy chains, but not in the comparison groups.
5. CONCLUSIONS
The distribution of gastropod shell sizes occupied in P. longicarpus is similar in form to
wealth distributions in many human societies. In particular, the characteristics of the shell
distribution (Gini coefficient, extent of skew, and power-law exponent) are more in line with
smaller-scale human populations such as those found in earlier human civilizations and groups
such as hunter-gathers and horticulturalists. This finding suggests the possibility that some
fundamental factors create similar inequality distributions across species. The crab shell
distribution does not seem to represent simple differences in either hermit crab or gastropod
growth and survival rates. Additionally, hermit crabs might be useful as an animal model to
experimentally investigate the importance of various factors on the generation of inequality.
Investigations of this sort would allow us to harness the power of the experimental approach to
provide greater understanding of how inequality systems work.
Finally, our results demonstrate that, in a manner of speaking, inequality is “natural”.
That is, inequality can occur in groups in which individuals own material resources but are
can provide a kind of reference point with which to compare inequality in both smaller- and
larger-scale human societies.
REFERENCES
[1] Flannery, K. & Marcus, J. The Creation of Inequality. (Harvard University Press, 2014).
[2] Piketty, T. Capital in the twenty-first century. (Harvard University Press, 2014).
[3] Borgerhoff Mulder, M. et al. Intergenerational wealth transmission and the dynamics of inequality in small-scale societies. Science 326, 682-688 (2009).
[4] Kohler, T. A. et al. Greater post-Neolithic wealth disparities in Eurasia than in North America and Mesoamerica. Nature 551, 619-622 (2017).
[5] Strassmann, J. E.& Queller, D.C. Privatization and property in biology. Animal Behaviour
92, 305-311 (2014).
[6] Scheffer, M., van Bavel, B., van de Leemput, I. A. & van Nes, E. H. Inequality in nature and society. Proceedings of the National Academy of Sciences, 114, 13154-13157 (2017).
[7] Reese, E. S. The behavioral mechanisms underlying shell selection by hermit crabs.
Behaviour 21, 78-126 (1963).
[8] Vance, R. R. The role of shell adequacy in behavioral interactions involving hermit crabs.
Ecology 53, 1075-1083 (1972b).
[9] Wilber, T. P. & Herrnkind, W. Rate of new shell acquisition by hermit crabs in a salt marsh habitat. Journal of Crustacean Biology 2, 588-592 (1982).
[10] Wilber, T. P. & Herrnkind, W.F. Predaceous gastropods regulate new-shell supply to salt marsh hermit crabs. Marine Biology 79, 145-150 (1984).
[11] Vance, R. R. Competition and mechanism of coexistence in three sympatric species of intertidal hermit crabs. Ecology 53, 1062-1074 (1972a).
[12] Bach, C., Hazlett, B. & Rittschoff, D. Effect of interspecific competition on fitness of the hermit crab Clibanarius tricolor. Ecology 57, 579-586 (1976).
[13] Kellogg, C. W. Gastropod shells: a potentially limiting resource for hermit crabs. Journal of
Experimental Marine Biology and Ecology 22, 101-111 (1976).
[14] Demetrius, L. Adaptive value, entropy, and survivorship curves. Nature 275, 213-214 (1978).
[15] Gosselin, L. A. & Qian, P.Y. Juvenile mortality in benthic marine invertebrates. Marine
Ecology Progress Series 146, 265-282 (1997).
[16] Chase, I. D. Vacancy chains. Annu. Rev. Sociol. 17, 133-154 (1991).
[17] Gini, C. Concentration and dependency ratios. Rivista di Politica Economica 87, 769-789 (1997).
[18] Hill, B. M. A simple general approach to inference about the tail of a distribution. The
Annals of Statictics 3, 1163-1174 (1975).
[19] Davies, J. B., Sandström, S., Shorrocks, A. & Wolff, E.N. The level and distribution of global household wealth. The Economic Journal 121, 223-254 (2011).
[20] Bricker, J. D. et al. Changes in US family finances from 2013 - 2016: evidence from the survey of consumer finances. Fed. Res. Bull. 103, 1-42 (2017).
[21] Weissburg, M., Roseman, L., Chase, I. D. Chains of opportunity: a Markov model for acquisition of reusable resources. Evolutionary Ecology 5, 105-117 (1991).
[22] Pareto, V. Cours d’économic politique. (Droz, 1896).
[23] Drăgulescu, A. & Yakovenko, V. M. Exponential and power-law probability distributions of wealth and income in the United Kingdom and the United States. Physica A: Statistical
Mechanics and Its Applications 299, 213-221 (2001).
[24] Clauset, A., Shalizi, C. R. & Newman, M. E. Power-law distributions in empirical data.
SIAM Review 51, 661-703 (2009).
[25] Mincer, J. Investment in human capital and personal income distribution. Journal of
Political Economy 66, 281-302 (1958).
[26] Becker, G. S. Human capital. (University of Chicago Press, 1964).
[27] Cagetti, M. & De Nardi, M. Wealth inequality: Data and models. Macroeconomic Dynamics
12, 285-313 (2008).
[28] Pluchino, A., Biondo, A. & Rapisarda, A. Talent vs Luck: the role of randomness in success and failure. arXiv preprint arXiv:1802.07068 (2018).
[29] Becker, G. S. & Tomes, N. An equilibrium theory of the distribution of income and intergenerational mobility. Journal of Political Economy 87, 1153-1189 (1979).
[30] Gale, W. G. & Scholz, J. K. Intergenerational transfers and the accumulation of wealth.
[31] Kotlikoff, L. J. & Summers, L. H. The role of intergenerational transfers in aggregate capital accumulation. Journal of Political Economy 89, 706-732 (1981).
[32] Arrow, K. J. & Levin, S. A. Intergenerational resource transfers with random offspring numbers. Proceedings of the National Academy of Sciences 106, 13702-13706 (2009).
[33] Chase, I.D. & Lindquist, W.B. The fragilty of individual-based explaqnations of social hierarchies: a test using animal pecking orders. PLOS One, (2016).
[34] Lansing, J., Clifton, C. & Morgan, J. New homes and poor people: a study of chains of
moves. (University of Michigan Institute for Social Research, 1969).
[35] White, H. C. Chains of Opportunity: System Models of Mobility in Organizations. (Harvard University Press, 1971).
[36] Pinfield, L. T. The Operation of Internal Labor Markets. (Springer, 1995).
[37] Smith, T. H. The Marketing of Used Automobiles. (Ohio State University Press, 1941).
Acknowledgements We thank Stephen Abrams, Mark Aronoff, Mark Granovetter, Lawrence
Martin, Axel Meyer, Everett Waters, Nicholas Wilson, and Lydia Zepeda for comments; Moez
Ahmed, Alyson Hall, Abigail Higgins, Eva Muchnick, and Derek Ng for help with data
collection; Alyson Hall for data organization and analysis; Paul St. Dennis, Jason Jones, and
David Charifson for technical assistance; Lester Lefkowitz for photographs; and Ayush Kumar
and Jiwon Kim for figures. The comments of three anonymous reviewers greatly improved this
paper.
Author Contributions I.D.C. and D.K.P. conceived the project; I.D.C. and D.K.P. collected the
data; R.D. analyzed the data; all authors wrote the paper; and all authors contributed to the
interpretation of the results and commented on the final draft on the manuscript.
Funding: This research did not receive any specific grant from funding agencies in the public,