HAL Id: hal-00680695
https://hal.archives-ouvertes.fr/hal-00680695
Submitted on 19 Mar 2012
HAL is a multi-disciplinary open access
archive for the deposit and dissemination of
sci-entific research documents, whether they are
pub-lished or not. The documents may come from
teaching and research institutions in France or
abroad, or from public or private research centers.
L’archive ouverte pluridisciplinaire HAL, est
destinée au dépôt et à la diffusion de documents
scientifiques de niveau recherche, publiés ou non,
émanant des établissements d’enseignement et de
recherche français ou étrangers, des laboratoires
publics ou privés.
Visualization in cryogenic environment: Application to
two-phase studies
Bernard Rousset, Denis Chatain, Laurent Puech, Pierre Thibault, François
Viargues, Pierre-Etienne Wolf
To cite this version:
Bernard Rousset, Denis Chatain, Laurent Puech, Pierre Thibault, François Viargues, et al..
Visual-ization in cryogenic environment: Application to two-phase studies. Cryogenics, Elsevier, 2009, 49
(10), pp.554. �10.1016/j.cryogenics.2008.10.012�. �hal-00680695�
Visualization in cryogenic environment: application on two phase studies
Bernard ROUSSET
*1, †, Denis CHATAIN
*1, Laurent PUECH
*2, Pierre THIBAULT
*1, François
VIARGUES
*1and Pierre-Etienne WOLF
*2Synopsis: Visualization techniques compatible with low temperature environment are essential in the extension of room
temperature techniques to the study of cryogenic flows. Focusing on two-phase fluids, this paper describes several optical tools developed in severe environments (high magnetic field, superfluid flows,…) to access two-phase patterns (meniscus shape, bubbles and droplets, stratified two-phase flows…).
Keywords: Cryogenic two-phase fluids, Optic laws, Visualization
1. Introduction
During the last decade, visualization techniques related to cryogenic environment have done tremendous improvements, mainly as PIV is concerned1)-2). Our lab
has also a long history in visualization techniques, using more conventional equipment. In the first part of this paper, we will present two-phase flow pattern results obtained with a basic equipment and requiring neither seeding with particles nor expensive PIV. Practical solutions are proposed and illustrated by experiments so every researcher can use it for his own application. Depending on the cryostat and on the type of measurements concerned, either a very simple apparatus with a CCD camera located inside the vacuum vessel itself can be used or more sophisticated optical facilities with several window ports or endoscope lenses if needed. The same classification applies to lightening systems, ranging from classical leds or lamps to laser diodes or even larger power laser beams. In the second part of the paper we describe an experiment using an endoscope for both lightening and visualizing and the last part of the paper is dedicated to He two-phase flow studies with light scattering techniques, photometric measurements and PDPA velocity measurements and particle sizing.
2. Direct visualization using commercial
window ports and CCD camera
2.1 All visualization devices located inside the vacuum vessel
For qualitative observations, one may use direct visualization inside the vacuum vessel and inside nitrogen
shield (if any) of the cryostat. The liquid reservoir containing the fluid (e.g. nitrogen or helium) will be equipped with commercial window viewports3) with
flanges (see Fig. 1). Cheap commercial CCD video camera4) sold for surveillance security by Watec company
works pretty well under vacuum (10-4 Pa).
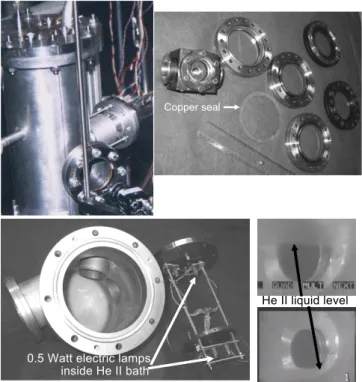
Fig. 1. Optical cryostat used in superfluid helium with leak
tight viewports and lighting system using lamps. The last two photographs showing a helium level are records from a CCD camera located in the outer vacuum vessel.
Experience shows that the camera fails for the duration of the pumping down and then recovers. We suppose that, in operation, the self heating of the camera compensates
Copper seal
0.5 Watt electric lamps inside He II bath
He II liquid level
0.5 Watt electric lamps inside He II bath
the cool down from the support linked to the saturated bath. The CCD camera watches the area of interest (e.g. the heater surface if the objective is to study the boiling). Lightening can be performed using leds located in the vacuum vessel and facing the viewports or even using small commercial electric lights (e.g. as those used in small electric torch) directly located inside the saturated bath. Fig. 1 shows such an arrangement where electric lights have been placed either in the liquid helium or in the vapor helium area.
In the case of a two-phase flow, a direct visualization of the main flow is needed. We have extensively used transparent pipes made of Pyrex pipe as shown on Fig. 2. Factories providing electrical feedthroughs5) often supply
such pipes where the key point is the soldering between the glass and the stainless parts.
Fig. 2. Examples of Pyrex tubes compatible with a cryogenic
environment. A progressive glass-metal junction allows the use of standard flanges, and bellows are used to compensate for thermal expansion.
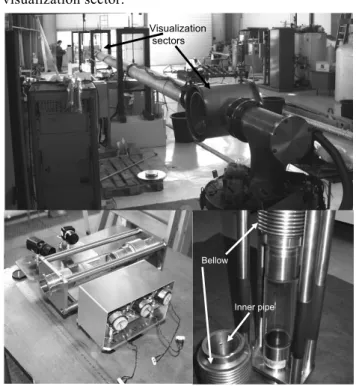
When a visualizing sector is located inside a long cryostat, differential contraction efforts may cause a huge strain on the materials, and bellows can be used for compensation, as long they do not disturb the flow. Design in Fig. 3 shows a solution adopted in case of 22 m stainless steel long line equipped with two visualization sector. The line has a fixed point located 10 m away from one visualization sector, causing the inner pipe to move by 3 cm during cool down from room temperature to liquid helium temperature at the abscissa of the
visualization sector.
Fig. 3. The 22 m long He II cryostat and its two
visualization sectors and below the lighting and CCD recording system located in the vacuum chamber to record flow motion. This tube is equipped with a thermal expansion compensation system using a bellow surrounding the two parts of a main tube to minimize flow perturbation.
2.2 Lightening and visualization are performed outside the vacuum vessel
If equipment for visualization can not be located inside the vacuum vessel, a complete optical cryostat (see Fig. 4) or a cryostat equipped with multiple window ports can be used. This latest solution may be cheaper and less power consuming. In any case, windows both at room and intermediate temperature (e.g. on the 80 K thermal shield if the fluid to be visualized is liquid helium) have to be added. Otherwise infrared thermal radiation coming from room temperature will fall on the cold part, which must be absolutely avoided.
On the contrary, as it can be seen on Fig. 5, the intermediate viewport stops radiations of wavelength typically larger than 5 microns (i.e. all energy of room temperature infrared radiation is absorbed by the viewport) but remains transparent for the visible light which is our aim. Finally the light coming from the lightening has to go through a large number interfaces (front and back of all viewports) before arriving to the camera and care has to be taken to avoid light reflection on all these interfaces.
Visualization sectors
Bellow
Fig. 4. Optical Pyrex cryostat designed by CNRS, and
operating down to 1.5 K for rapid characterization. The two co-axial pyrex vessels used for liquid nitrogen (shield) and liquid helium allow a direct visualization of an experiment, with some degree of distortion due to the many interfaces.
Fig. 5. Optical transmissions of several materials used in
the visible wavelength range and their cut-off in the I.R. range (figure extracted from reference3)).
3. Oxygen nucleate boiling visualization
using endoscopes
In this part, we present an optical device dedicated to the observation of liquid oxygen, boiling under reduced gravity. Observation is performed by shadowgraphy. Two endoscopes are used: one for the light and the other one for the camera. The reduced gravity is obtained by magnetic compensation with a superconductive coil delivering a magnetic field of 2 T at 4.2 K. The cell containing the liquid oxygen at 90 K is introduced in the magnet bore at the bottom of the cryostat.
3.1 Context
The achievement of strong magnetic field has made possible the development of magnetic levitation of diamagnetic substances, such as solids, liquid or living bodies6)-12). One of the interests of magnetic levitation is the possibility to reproduce weightless conditions on earth
and to simulate the zero-gravity environment of the space. The basic principle of magnetic compensation is to use magnetic body force that act on a diamagnetic or paramagnetic fluid in the presence of a magnetic induction gradient.
Our laboratory has acquired a large know-how in magnetic levitation these 10 last years13)-15). Recently, to
study behaviors of fluid in space, we have developed an experimental apparatus named OLGA (Oxygen Low Gravity Apparatus) for the magnetic compensation of gravity on several cubic centimeters of liquid oxygen. The main purpose of this installation is to study pool boiling under variable gravity levels including zero gravity. Pool boiling is a classical experiment for the characterization of boiling heat transfer in a simple configuration. It consists in heating a fluid initially at rest in a cell maintained at a constant temperature and pressure. Heat transfer is characterized by the evolution of heater temperature with respect to the applied heat flux. Here, this cell has been used to check the ability of magnetic compensation to reproduce reduced gravity conditions by measuring the size and departure period of bubbles in nucleate boiling regime as a function of the magnetic compensation.
3.2 Description of the experimental setup
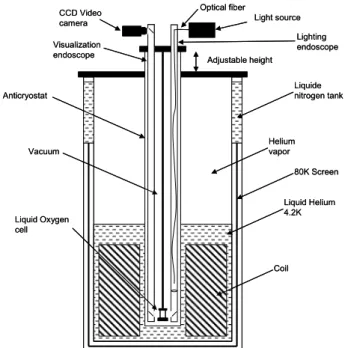
The OLGA facility is mainly composed of three parts: the experimental cell that contains liquid oxygen, the anticryostat which contains the experimental cell and the endoscopes and the cryostat which contains the anticryostat and the coil (see Fig. 6).
Liquide nitrogen tank Helium vapor 80K Screen Liquid Helium 4.2K Coil Anticryostat Vacuum Adjustable height Liquid Oxygen cell Visualization endoscope Lighting endoscope Light source Optical fiber CCD Video camera Liquide nitrogen tank Helium vapor 80K Screen Liquid Helium 4.2K Coil Anticryostat Vacuum Adjustable height Liquid Oxygen cell Visualization endoscope Lighting endoscope Light source Optical fiber CCD Video camera
Fig. 6. Sketch of the OLGA experimental setup.
Liquid Nitrogen level Liquid Helium level
The cryostat contains the supraconductive coil immersed in a helium bath at 4.2 K. The total height of the cryostat is 230 cm; the external diameter is 87 cm.
The supraconductive coil is made of Niobium-Titanium. Its dimensions are 555 mm in height and 650 mm in external diameter.
The anticryostat is a vacuum vessel at the bottom of which is set the experimental cell. It is inserted in the coil bore and is equipped with two endoscopes for visualization. The high vacuum allows insulating the cell from the 4.2 K environment so that the experimental cell can be set to the temperature of liquid oxygen or higher. The anticryostat can be moved in the vertical direction along about 150 mm in order to adjust precisely the position of the cell inside the magnetic field.
3.3 The pool boiling cell
A cell has been designed for the study of boiling heat transfers in oxygen (cf. Fig. 7). The basic principle of the characterization of heat transfer from a solid part (heater) to a fluid is to apply a heat flux to the solid part in contact with the fluid and to measure the increase in temperature of the heater while the fluid temperature is globally maintained constant. In our case, the heater is a horizontal circular flat plate situated at the bottom of the cell. The liquid oxygen in the cell is initially at rest. The temperature of the cell and the pressure are kept constant.
The cell is composed of a sapphire cylinder closed at both ends by two copper flanges. The dimension of the test section is 30 mm in diameter and 36 mm in height. This gives a volume of 25 cm3.
Fig. 7. A view of the experimental cell used for the studies
of heat transfers in liquid oxygen
The lower flange is an assembly of three parts.
i) The inner part is the heater through which the heat flux is transmitted to the liquid oxygen. It is a copper cylinder coupled with a resistance and powered by a current generator. The heater surface in contact with
oxygen is 0.5 cm2 and the maximum power is 17 W,
which correspond to a maximum heat flux of 340 kW/m2.
Fig. 8. Sketch of the optical system (and corresponding
photos) in the anticryostat of OLGA experiment Bottom view :
endoscopes and cell Top view : camera and zoom lens
Bottom view : endoscopes and cell
Top view : camera and zoom lens
Camera Zoom lens Viewport
Light source Optic displacement Light displacement Pumping outlet Cryostat Flange Cell displacement Vacuum Bath vapor Camera endoscope I.D. 40 mm Light Endoscope Cell support Optical fiber Condensing lens Parallel beam Ground glass Mobile mirror Mobile mirror
OLGA endoscope optical design Cell
ii) The external part of the lower flange is equipped with a heat exchanger, an additional heater and a thermometer in order to regulate the cell temperature.
iii) The third part is a thin stainless steel annulus brazed between the heater and the external part. The purpose of this last part is to minimize the conductive heat flux between the heater and the heat exchanger.
The heat exchanger works with cold helium gas. It is possible to heat the heat exchanger in order to regulate the cell temperature with a very high stability (0.01 K).
3.4 The optical device.
Specifications for the optical device
The optical device must work under vacuum (10-6 mbar), and produce a parallel light or a diffusive light. It has to allow visualisation of the full cell.
Due to the large magnetic field (2T), the camera cannot be located close to the cell. This leads to use endoscopes for both illumination and observation of the cell. Of course, their heat load on the cell must be as low as possible.
Adopted design
As may be seen on Fig. 8, the experiment device is set inside an anticryostat (200 mm OD and about 2 meters high) that is adjustable in height. So the position of the measuring cell, attached inside the anticryostat, can be moved in the magnetic field (and field gradient) to adjust the magnetic environment.
Each one of the endoscopes is made of a vertical tube well (40 mm ID) with a mirror inclined at about 45° at its bottom. The corresponding field of view is 30 mm in diameter. Both mirrors can be tilted around an axle, so that their inclination can be varied using cables pulled from the upper part.
It is thus possible, by moving these cables with room temperature motors, to change the orientation of the incoming light, and to scan the whole height (36 mm) of the cell.
For the image endoscope, a second 45° mirror at the upper part deflects the optical axis to a horizontal position for the camera.
Each endoscope is allowed a vertical motion of about 5 centimetres (motors and bellows).
The combination of these vertical translations and the tilt of the mirrors at the bottom of the endoscopes brings a good flexibility to adjust the image observed and the illumination. This movement is driven through a rotating steel string.
Infra-red wave lengths
Infra-red power should be eliminated from the incoming light, as it has no effect on the quality of
illumination for the camera while being harmful for the cryogenics (heat flux deposited on the cold cell). An anti-caloric filter is inserted between the lamp and the optical fiber in order to get rid of these bad wave lengths. Remaining infra-red power is absorbed by the optical fiber itself and the heat is evacuated all along the fiber without reaching the cold cell.
Diffraction
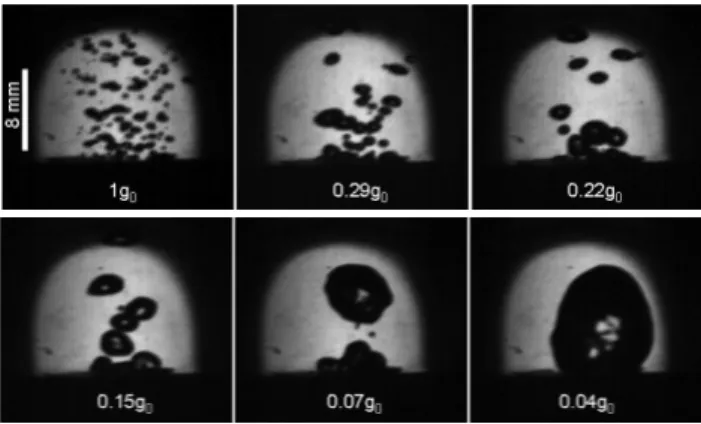
The available room for the endoscopes is quite limited, and that didn't allow the use of an endoscope diameter larger than 40 mm. As the distance between the camera and the cell is about 2 meters, there is a limitation of the separating power that can be reached, due to diffraction of the light. In our case, it has been estimated around 40 or 50 microns. This value is quite large, and it is of the same order of magnitude as the resolution of the CCD sensor of the camera. Such a large value was the subject of some worrying, but practically, the images actually obtained were of sufficient quality for being exploitable as it can be seen in Fig. 9.
Fig. 9. A view of the bubbles size versus the gravity level for
a heat flux of 1 W/cm². we can see that the bubble size increases when gravity level decreases
The camera used is the following: Model: AVT PIKE F-145C FIBER Camera IEEE1394b with Sony sensor * CCD 2/3" (11.2mm Diag) - Color Bayer
* Resolution 1388*1038 - pixel 6.45µm² - 25 im/s Raw * 25im/s (4:1:1), 22im/s (4:2:2), 15im/s (RGB) * Converter 16 Bit - output 8-10-12-14-16bits
* IEEE1394b-S800, 1x copper, 1x LC Fiber (Daisy Chain)
A zoom lens is being used (TAMRON 70 mm x 220 mm) with a focal converter giving a maximal focal length of more than 400 mm. For some experiments, a 600 mm catadioptric lens is used.
Leak tightness
The image endoscope is open to the anticryostat insulating vacuum (about 10-6 mbar) at its bottom end. At its upper end, it is closed tightly by means of a glass view-port. Tightness is easily obtained with an elastomer gasket. For the illumination endoscope, the same solution has been adopted. The optical fiber is set just behind the window glass that closes vacuum. This fiber remains entirely in vacuum. With this solution, any tightness at low temperature may be avoided.
3.5 Summary of OLGA facility visualization
The cryogenic endoscopes developed for the OLGA facility have made it possible to visualize nucleate boiling of liquid oxygen under reduced gravity. The optical system chosen is simple and uses only low cost material. Definition is limited equally by that of the CCD sensor and by diffraction due to the long and narrow tube well of the endoscope. But in the end, valuable images may be obtained. No problem with leak-tightness occurred.
4. HeII co-current two-phase flow
visualization on a 10 m long pipe
This part of the paper describes the optical techniques we used to detect liquid droplets in the helium two phase flow in the Cryoloop experiment16). These include
quantitative light scattering, imaging, and laser phase sensitive anemometry and granulometry (PDPA).
4.1 Context
In the future Large Hadron Collider, the superconducting magnets will be immersed in a static pressurized liquid He II bath cooled by a heat exchanger pipe containing a He II two-phase flow. A key factor of efficiency is the thermal transfer from the magnet bath to the flowing saturated superfluid liquid. The purpose of the Cryoloop experiment was to study the heat transfer capabilities provided by such a flow.
Our measurements have shown that, at high vapor velocity, heat transfer is significantly better than expected from the amount of surface wetted by the liquid height only. This improvement correlates with the apparition of a stratified mist of droplets above the liquid free surface.
Accessing the density of droplets, as well as their size and velocity distributions is of major interest to understand heat exchange performances.
Optically, atomized flows present the invaluable advantage of being naturally seeded by particles, as is the case for bubbly cavitating flows. A specificity of liquid helium is its low refractive index. This implies that light scattered from bubbles or droplets larger than several
microns in diameter is mainly concentrated into a small cone in the forward direction. This consideration is essential to both implement and interpret optical measurements on helium.
4.2 Optics of helium droplets
The low polarisibility of helium leads to a ratio
m=nL/nV between the liquid and vapor refractive index
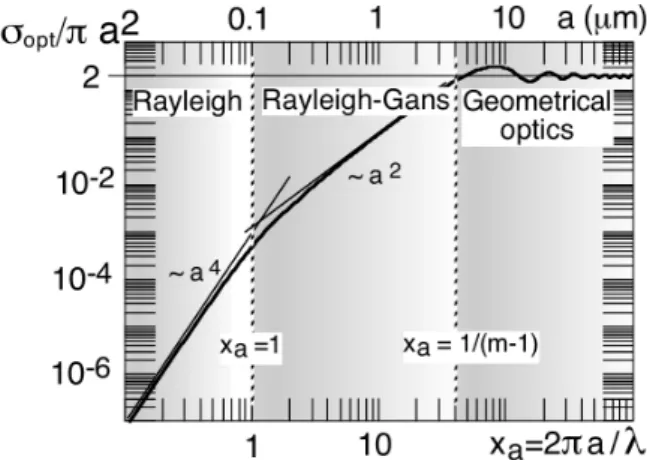
close to 1. The scattering cross-section of the droplets depends on the optical regime. Assuming spherical particles, this cross-section σOPT is shown on Fig. 10 as a
function of the Mie parameter xa=2πa/λ, that is the ratio
of the particle radius a to the light wavelength λ.
Fig. 10. Total optical cross section of helium droplets divided
by their geometric cross-section. The three optical regimes (Rayleigh, Rayleigh-Gans and geometric optics) are shown with corresponding asymptotic behaviors.
Three different regimes17) are observed depending on
xa. In the Rayleigh regime (xa <1), scattering is isotropic
(except for the dipolar effect of polarization), and the scattering cross section scales with the volume of the droplet squared. Here, the low value of (m-1) implies a small scattering cross-section, making the observation of small concentrations of droplets more difficult than with other fluids. For larger values of xa. (keeping xa (m-1)
<1), the phase shift between different regions of the droplet has to be taken into account. This implies an a4
dependence of the cross-section, and an increasing forward anisotropy of the scattering. Due to the low value of (m-1), this Rayleigh-Gans regime is quite extended. Finally, for xa (m-1) >1, one reaches the geometrical
optics regime, where the total cross-section σOPT
approaches twice the geometric cross-section, the factor two corresponding to equal contributions of geometrical optics (refraction and reflection) and of diffraction. The oscillations around this asymptotic value mainly reflect an interference between the transmitted and the scattered
light17). For two-phase helium and a 0.632 µm wavelength
light, this regime corresponds to diameters larger than approximately 3-4 microns, and is the relevant one for the atomized two-phase flow studied there, as the typical diameters are in the 10 micron range. In contrast to the Rayleigh regime, in the geometrical optics regime, the difference with other fluids is not in the total amount of scattering (which only depend marginally on m), but in its angular dependence. Here, the low value of (m-1), implies that reflection is generally weak and that refraction is mainly peaked forward, as we now discuss.
Fig. 11. Mie scattering theory for light scattering in helium,
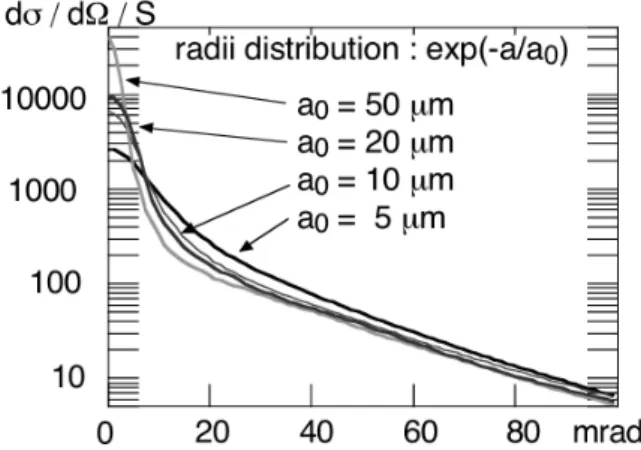
using m = 1,025 and λ=633 nm, covering the full forward (0°) and backward (180°) extension. The differential cross section is normalized by the droplet geometrical cross section. The continuous curve corresponds to an exponential distribution of characteristic radius a=5 µm.
The angular dependence of the differential cross-section dσ/dΩ is shown in Fig. 11 between 0° (forward) scattering and 180° (backward) scattering for particles of 10 and 100 microns in diameter. The many oscillations on the graph are due to interference effects between different light paths. As their positions and widths depend on the radius of the droplet, they are averaged out when one considers a realistic distribution of diameters (exponential for the purpose of the figure). On the scale of this figure, the fast decrease at small angles (below 250 mrad) reflects the angular dependence of the refracted light, while the light at larger angles is dominated by reflection (pure refraction does not occur above 26° for m=1.025). The bump around 800 mrad is the main rainbow17), which, due to the low index of
refraction of helium, occurs in the forward hemisphere, rather than backward for water.
Fig. 12 shows a blow-up of Fig. 11 for small angles. On this scale, the (relatively) slow decay is due to refraction, whereas the sharp peak in a narrow angular cone of width of order λ/a is due to diffraction. As shown by Fig. 12, this diffraction peak increases in height and decreases in
width as the characteristic radius of the size distribution increases. This can be used to get some rough idea of the droplets size. However, due to the dominant weight of the large droplets, to the convolution with the angular width of the laser beam, and (for large concentrations of droplets) to widening by multiple scattering, one cannot expect to measure the size distribution from the shape of the diffraction peak.
Fig. 12. Mie computation of light scattering between 0 and 6°,
using m = 1,025. Comparisons of diffraction peaks are given for exponential distributions with characteristic radii a0=5, 10, 20,
or 50 µm.
The intensity scattered at a given angle is proportional to the integral ∫nP dσ/dΩda, where nP is the density of
droplets of diameter a. In the geometrical regime, and outside the diffraction peak, (dσ/dΩ) for distributed
scatterer sizes is proportional to their geometrical cross sections. Therefore, the scattered intensity from one region is proportional to the local interfacial density
Σ=nPπd322, where d32 is the Sauter mean diameter. If the
spray is illuminated by a parallel laser sheet, its image under a fixed angle then gives the spatial distribution of the interfacial density within the sheet.
For an homogeneous spray, an alternative determination of Σ (averaged along the mean path) is to measure the attenuation of a laser beam as it traverses the spray. Indeed, the transmitted intensity is given by Lambert-Beer law
I(D)=I0e-D/l (1)
where D is the distance traveled inside the spray and l the scattering mean free path in the region traversed by the beam. The beam attenuation thus gives l = 1/ΣOPT ,
where ΣOPT =∫nPσOPT da = Σ/2 , as the total cross-section
is (in average) twice the geometrical cross-section. The comparison between the two types of measurements allows to calibrate the interfacial density Radius
deduced from the image of the spray (note that such a calibration can be made even if the spray is not homogeneous along the beam path, provided one affects the average Σ measured from Lambert-Beer law to the
integral of the image intensity along this beam path).
4.3 Description of cryoloop optical apparatus
In the "Cryoloop" experiment, the two-phase helium flows inside a 40 mm i.d. pipe, which has two visualization sectors.
The first (see Fig. 13) is located downstream, and opens to a stainless steel portion of the pipe. To this aim, two 15 mm diameter holes were drilled across a horizontal diameter of the pipe, the leak tightness being made by flat optical windows, whose flanges were soldered onto the outer surface of the tube.
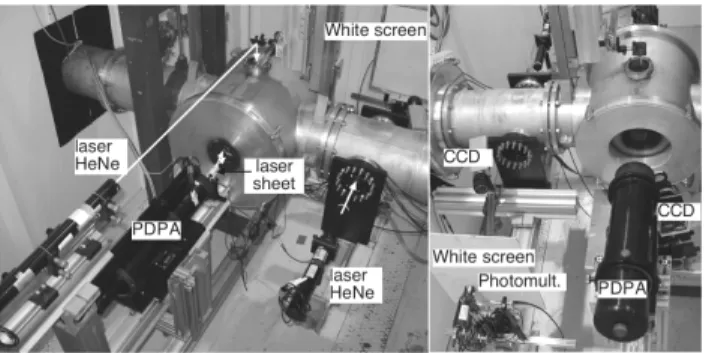
The flow disturbance was minimized by covering the orifices, on the inner surface of the tube, by thin, round, microscope slides. This port is used to shine a laser beam into the pipe. The scattered light illuminates a white screen located about 0.8 m from the exit window, which is imaged with a CDD camera to get the angular dependence of the scattered intensity within about 150 mrad around the forward direction, allowing to determine the scattering regime. The transmitted laser beam traverses the screen through a hole and is measured with a photodiode to get the scattering mean free path from Beer-Lambert law.
Fig. 13. System for photometric measurements in the
Cryoloop experiment. The left picture shows the emission side, with the laser beam accessing from the top, the PDPA emission laser, the diode laser for sheet illumination, and the laser used for measuring the angular dependence of the scattered intensity. The right picture shows the detection side, with the PDPA analyser, the CCD imaging the mist in the Pyrex section of the pipe, and the CCD and a photomultiplier measuring the scattered intensity on and behind the white screen.
The second visualization sector, (see Fig. 13 and
Fig. 14), is used for global imaging, as well as for granulometry and velocity measurements with a Particle
Phase Doppler Analyser (PDPA). It gives access to a portion of the pipe made out of Pyrex glass through three viewports located front, back and top side.
Fig. 14. (Left) Pyrex tube in the visualization section of the
Cryoloop experiment before closer. (Right) Front view at 10° of the inner of the Pyrex tube filled with a calibration grid at room temperature and with superfluid helium in operation.
This allows to visualize the flow over the full pipe cross section, over a 150 mm long portion shown on the enlarged view on Fig. 14. Illumination is provided either by a vertical laser sheet propagating horizontally perpendicular to the pipe axis, or by a laser beam propagating vertically through the top window. The corresponding scattering images of the mist are recorded with the same CCD camera, and are used to determine the spatial distribution of the mist within the pipe.
In both cases (angular and spatial distributions), a dynamic of three to four decades in intensity is required.
This is achieved by combining 8 bits images taken with different exposure times or apertures, or by using a 12 bits camera (Dalsa 1M30P in our case). Absolute measurements also require to calibrate the sensitivity of the system to CCD parameters (exposure time, internal gain) or objective characteristics (aperture, focal length).
This calibration is performed in a separate apparatus where the CCD measures the intensity emitted from a LED and monitored by a calibrated photodiode. By varying this intensity, we can determinate the sensitivity of the CCD to the different parameters, as well as determine its linear range, allowing reliable photometric measurements.
4.4 Optical characterization of a polydispersed spray
Typical examples of scattering measurements for the Cryoloop experiment illustrate the different concepts developed in part 4.2.
Fig. 15. From left to right : Snapshots (100 µs) pictures of a
section of the glass tube at superficial vapor velocities USG=6.6 ms-1 and 8.9 ms-1, and averaged values over 124
pictures with 40 ms exposure time at 7.3 ms-1 and 8.8 ms-1
(Total mass flow of 6.9 gs-1 at T=1.8 K). The snapshot pictures
are focused closer to the exit side (left) of the tube, so that droplets close to the other side are blurred. The average interface position appears as the white curved line in the averaged pictures. (See ref 18)
Fig. 16. Scattered intensity of a laser beam traversing the
spray for increasing input powers (or increasing vapor velocities) (logarithmic gray scale): (a) 0 W (background); (b) 60W ; (c), (d), (e) with background subtracted for 60, 86 and 108 W. (See ref. 18)
Fig. 15 presents snapshots and average pictures of the
pipe for sheet illumination, revealing the presence of a mist above the liquid-vapor interface.
Fig. 16 shows the observed angular dependence of the
scattered intensity as materialized on the white screen. The black spot in the middle is the central hole, which corresponds to the purely forward direction.
The light around the hole is the scattered intensity (the white spots correspond to parasitic reflections of the laser beam). The decay of the scattered intensity away from the hole is the effect of refraction. The pictures are brighter when the vapor velocity increases, because the resulting increase in atomization increases the interfacial density of
droplets. The circular symmetry around the hole reveals that the droplets are not elongated along the flow direction, so are presumably spherical.
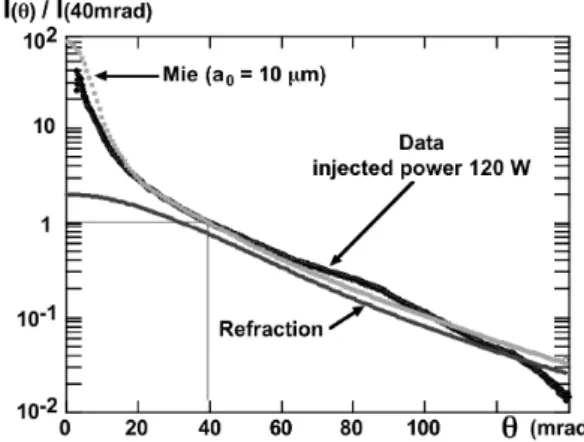
Fig. 17. Angular dependence of scattered light in the cryoloop
experiment
Quantitative analysis of these pictures (shown in Fig. 17
for 120 W) reveals that, for all vapor velocities, the measured angular dependence beyond 40 mrad is that expected for geometrical optics, implying that the typical droplets size is larger than several microns. As for the diffraction peak at smaller angles, it is correctly accounted for by an exponential distribution of sizes, with a characteristic diameter of 20 µm, in agreement with the PDPA granulometry measurements.
4.5 Multiple scattering regime
Multiple scattering, which occurs for D>>l (D being the distance covered by the laser beam inside the two-phase fluid and l the mean free path) makes it generally difficult to evaluate the density of a spray.
1 rare event
Beam spread
Fig. 18. Scheme showing the widening of the beam due to
multiple scattering and a rare scattering event at a large angle. The situation of helium is peculiar in this respect. In the geometrical optics regime, scattering is mainly forward, so that the distance over which the direction of an incident beam remains correlated (the so-called transport mean free path l*) is more than 200 times the scattering mean free path. For distances D between l and
l*, the angular dependence of the scattered light at small
angle results from the multiple convolution of many single scattering events. In contrast, at large angles, scattering involves only one single event at (approximately) this angle, between two series of low-angle scattering events (Fig. 18). As a result, if the angle of observation is large enough, one can use quantitative imaging as in the single scattering regime, provided that one takes into account the widening of the incident beam due to low-angle multiple scattering.
Fig. 19. Computed total scattered intensity for several angles
as a function of average number of collisions. The straight line is the extrapolation of the single scattering regime for θ= π/4 (See reference 19) for explanations).
The crossover, at a given observation angle, from one quasi single scattering regime, where the total scattered intensity increases linearly with t=D/l, to the multiple scattering regime where the intensity decreases with t, has been computed for a model angular dependence of
dσ/dΩ .
Their results, reproduced in Fig. 19, show that the larger the ratio t (the number of scattering events), the larger the minimal angle for the quasi-single scattering description to be valid. In practice, at 45°, the single scattering behavior can be observed up to 10 scattering events along the light path !
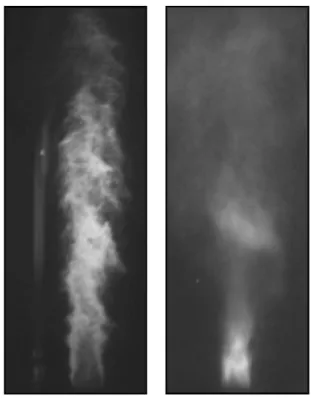
Fig. 20. The LHe/GHe spray under similar condition -left as
viewed atθ∼4°, -right at θ∼45°. (See 19) for explanations). Exposure times are different (0.1 ms and 10 ms). Scale is approximately 1.5:1.
This peculiar behavior is illustrated on Fig. 20, in the case of coaxial (rather than planar in Cryoloop) atomization. The two pictures show the same jet of liquid helium stripped by a faster co-current gaseous helium jet in its periphery19). The jet is illuminated by a large
parallel beam of white light and viewed under two different angles with respect to the illumination direction.
At small angle, the denser region (i.e. center and bottom of figure) appears dark because the light incident on this region has been scattered at larger angles by the process of multiple scattering. However, the same region appears bright when viewed at 45°, which is large enough for the quasi single scattering situation to prevail.
In Cryoloop, the same phenomenon explains that the bottom of the pipe appears bright despite the fact that multiple scattering occurs there.
Fig. 21. Picture of the cryoloop pipe illuminated by a laser
sheet in conditions of strong atomization, and the deduced vertical profile of the interfacial density within the white rectangle. The vertical scale is graduated in terms of both the interfacial density and the ratio of the pipe diameter to the local mean free path. The strong stratification of the mist is due to gravity. The interfacial density is maximum close to the liquid interface. There, the mean free path is small enough compared to the pipe diameter that multiple scattering occurs.
4.6 Velocity and size pdf from PDPA
Quantitative light scattering only gives access to the local interfacial density (plus some rough idea of the characteristic diameter of droplets). In order to determine separately the density and diameter of droplets (which is necessary to evaluate many pertinent parameters, such as the amount of liquid transported by the mist), these measurements have to be completed by other techniques, such as PDPA. The use of PDPA to measure droplet velocities and sizes in helium two phase flows is a natural extension of room temperature measurements in other fluids. However, the previous considerations on helium low refractive index led to adapt scattering angles. Fig. 22
shows the dominant scattering mechanism for the two laser polarization states as a function of the scattering angle in the geometrical optics regime.
In contrast with water, the first order refraction dominates below 15°, and the primary rainbow (2nd order
reflection) is around 40°, that is forward. We therefore chose an angle of 15° to operate in the refraction mode an Aerometrics commercial PDPA20), as shown on Fig. 13,
and described in Ref. 21).
Pa=0 Pa=1 Pa=2 Pa=3 !' ! " r11 r22 t12 t21a t21b 0 30 60 90 120 150theta (°) 1e-05 0.0001 0.001 0.01 0.1 1 10 100 1000 10000 Int. Pa=0 Pa=1 Pa=2 Polar. // Polar. perp.
Fig. 22. Top : scheme of a the scattering of a light ray applied
in two phase water on a spherical particle in the geometrical optic approach. The different rays are labeled as a function of the number Pa of path inside the droplet. Only reflection (P0)
and the two first orders of refraction (P1 and P2) are represented.
Bottom : The intensity scattered by a helium droplet of radius a=10 µm in the geometrical optics approximation.
An example of velocity pdf (or LDA operating mode) in superfluid helium is shown on Fig. 23, for a stratified two-phase flow of helium showing some degree of atomisation at large vapour velocity. The shapes of the pdfs are clearly gaussian, and the droplet velocities agree with the vapour velocity profile for a stratified two-phase flow. Indeed, it can be shown that under most conditions, the particles are dragged with negligible drift. The average longitudinal droplet velocity profiles both in the vertical and transverse pipe direction are summarized on
Fig. 24.
Z=0
Z=40 mm
Study
box
Fig. 23. Typical velocity pdf obtained from PDPA
measurements. (Total mass flow of 13 g/s at T=1.8 K). USG
=6.6 ms-1 in Expt.2, Q
M=13 g/s; slope=0.6%, T~1.8 K. From
right to left : USG =11.2, 10.2, 8.7, 6.7, 5.7 ms-1. Total corrected
counts in probe volume are per second, and droplet velocity is measured at the centre of the pipe.
Fig. 24. Mean velocity profile across the Ø40 mm Pyrex pipe
section. (USG=11.2 m/s, T ≈ 1.8 K, total mass flow 7g/s) Stars:
transverse profile from y=-2 to 20 mm (symmetrized for clarity). Full circles, vertical profile (z=-20 to 20mm) measured from pipe centre.
PDPA was also used to access the droplet size. For that purpose, it uses 3 photomultipliers to determine a droplet size pdf 18). The pdfs for all curves in Fig. 25 show an
exponential decay with a characteristic diameter in the 10 micron range. For increasing vapor velocities, the same figure shows that the number of counts increases accordingly.
Fig. 25. Typical size pdf measurements in He II at 1.8 K at the
centerline and total corrected counts in probe volume are per second. Helium mass flow=13 g/s.
From top to bottom : USG =11.2, 10.2, 8.7, 6.7, 5.7 ms-1.
5. Conclusion
We have presented in this paper various ways to use visualization techniques in cryogenic environment.
Choice of optical accesses for a new project depends both on the facility itself (space available inside the vacuum vessel, possibility to introduce viewport, presence of magnetic field,…) and on the required accuracy/flexibility (visualization components located outside ensure more flexibility).
It has been shown that for two-phase helium, the small difference in refractive index between the liquid and the vapor imposes the visualization angle. Small angles are associated with large signals when needed (e.g. visualization angle for PDPA photomultipliers has to be adapted in consequence), whereas large angles are preferred to extend quantitative measurements in the multiple scattering regime.
In conclusion, it is demonstrated that extension of room temperature visualization techniques to cryogenic environment (eventually by adding cooled viewports, mirrors, endoscopes or CCD camera inside the vacuum vessel) is possible with reasonable investment.
Acknowledgements:
The work concerning OLGA facility is supported by Air Liquide Company and CNES. The authors want to thank D. Beysens, E. Bouleau, P. Bonnay, S. Bressieux, B. Cariteau, D. Communal, J. Chartier, T. Jourdan, C. Lorin, K. Madet, A. Mailfert, J.M. Mathonnet, P. Seyfert and J.C. Vallier for their contribution in the
development of the OLGA facility.
The Cryoloop facility was built with CERN support and with help of CEA/SBT technicians namely M. Bon Mardion, A. Gauthier, G. Marzo and P. Nivelon.
References
1) T. Zhang and S.W. van Sciver: “The motion of micron-sized tracer particles in He II thermal counterflow as observed by the PIV technique,” J. Low Temp. Phys. 138 (2005) 865
2) K. Harada, M. Murkami and T. Ishii: “PIV Measurements for flow pattern and void fraction in cavitating flows of He II and He I,” Cryogenics 46 (2006) 648-657
3) Vacuum generators. Les conquérants, LP911 1, avenue de l’Atlantique ZA de Courtabœuf Les Ulis, 91946, Courtabœuf Cedex, France. http://www.vacgen.com
4) Camera ref.WAT-902A Opto Vision 9, rue Boudeville, 31104 Toulouse cedex 1, France http://www.watec.net.
5) SVT 19 Rue Achille Robelti - 91170 Viry Chatillon, France http://www.frog4webdesign.com/svt/products.html
6) Braunbeck, W. 1939. “Free suspension of bodies in electric and magnetic fields”. Zeitschrift für Physik 112:753–763 W. 7) E. Beaugnon and R. Tournier, " Levitation of water and organic
substances in high static magnetic fields” J. Phys. III 1 (1991) 1423
8) J. M. Valles, Jr., K. Lin, J. M. Denegre and K. L. Mowry, "Stable magnetic field gradient levitation of Xenopus laevis: toward low-gravity simulation" Biophys. J. 73 (1997) 1130
9) E. Beaugnon, D. Bourgault, D. Braithwaite, P. de Rango, R. Perrier de la Bathie, A. Sulpice, and R. Tournier: "Material processing in high static magnetic field. A review of an experimental study on levitation, phase separation, convection and texturation” J. Phys. I 3 (1993) 399
10) M. A. Weilert, D. L. Whithaker, H.J. Maris, and G. M. Seidel, "Magnetic Levitation and Noncoalescence of Liquid Helium" Phys. Rev. Lett. 77 (1996) 4840
11) M. A. Weilert, D. L. Whithaker, H.J. Maris, and G. M. Seidel: "Magnetic Levitation of liquid helium" J. Low Temp. Phys. 1006 (1997) 101
12) D. L. Whithaker, M. A. Wielert, C. L. Vicente, H. J. Haris, and G. M. Seidel: “Oscillations of Charged Helium II Drops” J. Low Temp. Phys. 110 (1998) 173
13) R. Wunengurger, D. Chatain, Y. Garrabos, and D. Beysens: “Magnetic compensation of gravity forces in (p-) hydrogen near its critical point: Application to weightless conditions” Phys. Rev. E Vol. 62 N°1 (2000) 496
14) D. Beysens, D. Chatain, P. Evesque, and Y. Garrabos: “High Frequency Driven Capillary Flows Speed Up the Gas-Liquid Phase Transition in Zero-Gravity Condition” Phys. Rev. Lett. 95 (2005) 034502
15) V. S. Nikolayev, D. Chatain, Y. Garrabos, and D. Beysens, Phys. Rev. Lett. 97 (2006) 184503
16) B. Rousset B., B. Jager, E. Di Muoïo, L. Puech, P. Thibault, R. Vallcorba, R. van Weelderen and P.E. Wolf: “HeII co-current two phase flow at high vapor velocities,” AIP-Conference-Proceedings, 613B (2002) 1311-1318
17) H. C. Van de Hulst: “Light scattering by small particles,” John Wiley & Sons, New York (1957) (Dover paperback reprint, 1981) 18) P.E.Wolf, E. di Muoio, P. Thibault, L. Puech, B. Rousset and R.
van Weelderen: “PDPA characterization of the droplet mist in the cryoloop HeII two phase flow experiment,” Proc. of ICEC-19, Grenoble, France, (2002) 667-670
19) Y. Ladam, P.E.Wolf, P. Thibault and L. Puech: “Light Scattering by a Liquid-Gas Helium Spray,” Euro. Phys. J. (Applied Physics) 14, N°2 (2001), 137-141
20) W.D. Bachalo: “Development of The Phase/Doppler Spray Analyser for Liquid Drop size and Velocity
Characterizations,” Proc.AIAA/SAE/ASME 20th Joint Propulsion Conference, Cincinatti, Ohio (1984)
21) P. Thibault, E. di Muoio, S. Perraud, B. Rousset, P.E.Wolf, and R. van Weelderen: “Mist observation in superfluid He two-phase flow by PDA techniques,” 12th Int. Symp. on Applications of laser techniques to fluid mechanics, Lisboa (2004)
Bernard ROUSSET Working at CEA/SBT in the field of helium cryogenic since 1990, Bernard Rousset is a specialist of large scale facilties and dedicated instrumentation. His studies where supported by large institutes as CERN, NET or ITER.
Funding and time scale linked to the validation of such large projects allow cryogenic facilities sufficiently well instrumented to obtain results which largely overcome their dedicated application. So Bernard Rousset uses this opportunity to build general models. Furthermore, he always tries to compare experimental results and numerical models.
Either he developed the model (as for He II two-phase flow experiment) or he used existing one (as VINCENTA model developped by Efremov institute).
*1 Received August 31, 2007 CEA-Grenoble UMR_E9004, Service des Basses Températures, 17 rue des Martyrs, BP166, 38054 Grenoble cedex 9
*2Institut Néel-CNRS/UJF, 25 rue des Martyrs, BP166, 38042 Grenoble cedex 9