HAL Id: hal-02558404
https://hal.archives-ouvertes.fr/hal-02558404
Submitted on 2 Mar 2021
HAL is a multi-disciplinary open access
archive for the deposit and dissemination of
sci-entific research documents, whether they are
pub-lished or not. The documents may come from
teaching and research institutions in France or
abroad, or from public or private research centers.
L’archive ouverte pluridisciplinaire HAL, est
destinée au dépôt et à la diffusion de documents
scientifiques de niveau recherche, publiés ou non,
émanant des établissements d’enseignement et de
recherche français ou étrangers, des laboratoires
publics ou privés.
Adrien Gruel, K. Ambrožič, C. Destouches, Vladimir Radulović, Alix Sardet,
L. Snoj
To cite this version:
Adrien Gruel, K. Ambrožič, C. Destouches, Vladimir Radulović, Alix Sardet, et al.. Gamma-Heating
and Gamma Flux Measurements in the JSI TRIGA Reactor: Results and Prospects. IEEE
Transac-tions on Nuclear Science, Institute of Electrical and Electronics Engineers, 2020, 67 (4), pp.559-567.
�10.1109/TNS.2020.2974968�. �hal-02558404�
Abstract—The neutron field of various irradiation positions of the TRIGA Mark II reactor of the Jožef Stefan Institute (JSI) has been thoroughly characterized by neutron activation dosimetry and miniature fission chambers techniques. In order to have a fully validated calculation scheme to analyze and plan experiments, the gamma field also has to be experimentally validated. The 10-year long collaboration between CEA and JSI is a perfect framework to carry out such a study, and measurements of the gamma field started in late 2016. Several measurement techniques were investigated in in-core and ex-core positions.
On-line measurements were carried out using miniature ionization chambers manufactured by the CEA and PTW Farmer. Positional dependence was studied, showing a decrease in the delayed gamma contribution to the total gamma flux with increasing distance from the reactor core center.
To characterize the gamma dose in the core, as well as in the periphery, thermo- and optically-stimulated luminescent detectors (TLDs and OSLDs, respectively) were tested. These detectors are commonly used at CEA to measure the gamma dose in a given material, in order to study the nuclear heating in various core elements (control rod, baffle, structural material). Different filters were used in order to assess an integrated dose ranging from a few Gy up to several kGy. Comparisons of experimental results against calculations performed with the JSIR2S code package show a very good agreement. The feasibility of such measurements demonstrates the complementarity between measurements with dosimetry and ionization chambers from low to very high gamma-dose environment, such as in material testing reactors.
Index Terms—CaF2, gamma flux, ionization chamber, LiF,
TRIGA, TLD
I. INTRODUCTION
HE ability of a research reactor to perform precise irradiations (for electronic components, biological samples, sensors,…) lies with its neutron and gamma fields characterization. In steady state operating mode, the neutron field of various irradiation positions of the TRIGA Mark II reactor of the Jožef Stefan Institute (JSI) has already been measured by means of neutron activation dosimetry and miniature fission chambers techniques [1]-[3].
In a reactor core, gamma rays can be emitted promptly after a reaction (from fission or capture for instance), or after a
Submitted May, 14th, 2019
A. Gruel, C. Destouches and A. Sardet are with the CEA, DEN, Cadarache, DER/SPESI, F-13108 Saint Paul lez Durance, France (e-mail:
adrien.gruel@cea.fr).
certain time, which can range from seconds to years, or more (decay of activation and fission products). From the radiation safety point of view, as well as for irradiation purposes, it is mandatory to characterize these contributions, especially shortly after reactor shutdown. Thus, a comprehensive gamma characterization campaign has been carried out, within the framework of the 10-year JSI-CEA collaboration agreement on nuclear instrumentation [4]. The work presented here deals with the gamma measurements performed in late 2016 and 2017. The delayed gamma contribution importance has already been pointed out [5][6], and this study will bring new data to characterize this component into the TRIGA reactor. Complementary to his study, the dose rates were assessed with dosimetry techniques.
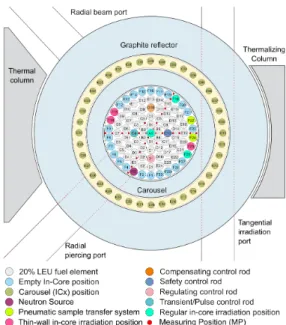
The JSI TRIGA Mark II reactor is a pool type reactor with a maximum steady state power of 250 kW. The core has 91 available positions in a concentric configuration for U-ZrH fuel elements, irradiation positions and control rod positions (Fig. 1). In between these positions, there are also positions with diameter of 10 mm, 8 mm and 6 mm, arranged along two lines across the reactor core, used for miniature detectors (Fig. 2).
K. Ambrožič, V. Radulović and L. Snoj are with JSI, Reactor Physics department. Jamova cesta 39, SI-1000 Ljubljana, Slovenia.
The present work was financially supported by the Research Agency of the Republic of Slovenia (ARRS) and the French Atomic and Alternative Energy Commission (CEA), under the reference n° BI-FR/CEA/16-18-001.
Gamma-heating and gamma flux measurements
in the JSI TRIGA reactor, results and prospects
A. Gruel, K. Ambrožič, C. Destouches, V. Radulović, A. Sardet, L. Snoj
A brief review of existing techniques for the characterization of gamma doses and flux levels in mixed field environments is presented in the first part. The second part of the paper describes the measurement techniques used, while the results and comparisons of measurements and calculations are discussed in the third part.
II. OVERVIEW OF EXISTING MEASUREMENT TECHNIQUES
Depending on the gamma flux level, as well as on the quantity of interest (flux, nuclear heating, dose), various types of gamma-sensitive (and to some extent, neutron-sensitive) sensors can be used.
In low dose and low dose rate environments, up to a few Gy.h-1, such as in medical physics, personal and environmental
dosimetry, space or in zero power research reactors, thermo-luminescent or optically stimulated-thermo-luminescent detector (TLD and OSLD, respectively) techniques are widely used [7]. Depending on the detector material, as well as on its doping elements, they can have a linear response versus the integrated dose from 10-7 Gy up to 10 Gy. Moreover, they appear not to be
sensitive to the dose rate. Except for 6Li-doped fluoride
materials, they are less sensitive to neutrons than to gammas, and are therefore of great interest for the gamma dose characterization in mixed n- fields. For instance, in the center of a thermal zero-power reactor, the neutron contribution to the total dose in CaF2:Mn TLDs was estimated to be around 10%
[8]. The gamma heating can be assessed in different materials with uncertainties better than 5%, providing valuable data for nuclear data improvement or experimental validation of calculation schemes [9]-[11].
Recent efforts outline the possibility of using a single type of TLD to measure doses ranging from µGy to MGy, thus covering 12 orders of magnitude [12], and that it could be used in mixed fields, such as those encountered in research reactors [13]. It has been shown that the luminescence curves of Mg,Cu,P-doped LiF TLD exhibit additional peaks at higher temperatures when subjected to high doses. With an adaptation of the reading protocol, it is then possible to assess very high doses.
Measurements performed with semiconductor radiation-sensitive field effect transistors (RadFETs) have also proven useful for measurements of high dose radiation fields, due to their small size, possibility of active or passive measurements and adjustable sensitivity. Measurements were performed in different irradiation positions in conjunction with an absolutely calibrated PTW Farmer® Ionization Chamber Type 30010. Simulations were used to calculate the cross-calibration factors [14].
Another type of detector that could provide a broad range of measurements are ionization chambers (ICs). Gamma source dose-rates are usually calibrated against such sensors. However, they could be unsuitable for in-core measurements because of their relatively large size (> 1 cm). Miniature ionization chambers (MICs), such as those manufactured by CEA, could be appropriate. They are currently mainly used for gamma flux characterization, but not for dose or dose rate measurements. Their operational range depends on the size of the detector, since the signal originates from the particle interactions with the MIC structures [15]. Therefore, the drawback remains the same as with commercial ICs for low dose environments.
Due to the very high neutron and gamma fluxes in Material Testing Reactors (MTRs), nuclear heating will be substantial and will lead to a temperature increase of the samples. In such environments, the nuclear heating is typically of 1 to 20 W.g-1
(1 to 20 kGy.s-1)
. In this case, the most used sensors are gamma
thermometers (GTs) or differential calorimeters [16][17]. They both enable the measurement of nuclear heating, or nuclear absorbed dose rate, in different materials, according to the device design, by means of a thermocouple.
Because of their relatively low output current, self-powered gamma detectors (SPGDs), which work similarly to self-powered neutron detectors, usually operate at medium or high dose rates, from 102 to 108 Gy.h-1 [18]. Recently developed
SPGDs were proven to show a linear response versus the dose between 10 and 5×10³ Gy.h-1 [19]. Their geometry can be
adapted to suit smaller irradiation positions.
Knowing that one of the major constraints for the use of
Fig. 1. Core configuration during the measurement campaign.
instrumentation in a reactor environment is accessibility, the detectors must be made small enough to fit in tight spaces, a property which ensures as localized as possible results for characterization or experimental validation purposes. Therefore, TLDs seem to be promising candidates to offer the possibility of using a single type of detector for a broad-range assessment of doses and dose rates in research reactors. It should also be noted that alanine dosimeters, based on electron paramagnetic resonance spectroscopy, seem to be able to cover a range of doses from 1 to 1.5×10⁵ Gy, and to be dose-rate
insensitive [20]. They also could be a good candidate for in-core and environmental dose measurements.
The following part describes the sensors that were used during the measurement campaign in the present work, as well as their main characteristics.
III. DESCRIPTION OF THE EXPERIMENTAL SETUP
A. Ionization and fission chambers
We used two types of ionization chambers. The first one, developed by CEA, is a 3-mm diameter and 55-mm long MIC, sealed at the end of a mineral cable. The second one is a commercial PTW Farmer® Ionization Chamber Type 30010, labelled PTW IC (30-mm long sensitive length, 16-mm diameter) absolutely calibrated to dose in water. By modelling the calibration procedure [22], air kerma and absorbed dose calibration factors were obtained to 1% precision. These detectors are devoted to gamma radiation detection.
To monitor the irradiations we used a Miniature Fission Chamber (MFC), of same geometry as the MIC, but with a fissile coating of a few micrograms of 235U on the anode, to have
a very high sensitivity to thermal neutrons.
CEA-made MIC and MFC measurements were carried out using Keithley 6517B picoammeters, with a sampling time of 1 second.
B. Optically stimulated luminescent detectors and thermoluminescent detectors
1) Characteristics
To assess gamma doses ranging from a few Gy up to kGy we used TLDs. These detectors were inserted in 2-mm thick aluminium cylinders to ensure the charged particle equilibrium. Two types of TLD were used: TLD400 (CaF2:Mn) and TLD700
(7LiF:Mg,Ti) obtained from ThermoFisher Scientific. The dose
reader used was a Harshaw model 3500, which can heat a single TLD up to 400 °C. The readout process for the TLD400 is the following: pre-heating at 150 °C for 5 s, then heating up to 350 °C at a rate of 10 °C.s-1 (total readout time: 30 s). For
TLD700, the read out consists of pre-heating at 140 °C for 10 s, then heating up to 280 °C at a rate of 15 °C.s-1 (total readout
time: 23 s) [9]. Prior to each irradiation, the residual dose in the detectors is annealed (1 h at 400 °C + 2 h at 100 °C).
In order to avoid the saturation of the photomultiplier tube while reading dosimeters with integrated doses higher than a few Gy, and also to avoid any electronic settings modification of the readout setup, we used neutral optical filters. The efficiency of the filter, 10%, 1% and 0.1%, corresponds to the fraction of the transmitted radiation. The filter efficiency
according to the wavelength was assessed by transmittance measurements at JSI, between 190 and 1100 nm. Results are shown on Fig. 3. Transmittance exhibit a clear dependency to incident wavelength. The efficiencies stated by the manufacturer seem to be given for a reference value around 500 nm. To take into account potential wavelength shifts between measurements (for instance to compare measurements of a given detector irradiated at different doses, or to compare the results of different detectors irradiated the same dose) the calibration step was performed with each filter.
For the background doses in the different positions, nanoDots OSLDs from Landauer were also used. They are made of carbon-doped aluminium oxide discs (5-mm diameter, 0.15-mm height) encapsulated in polyester (total height of 0.35 mm). These discs are stored in rigid plastic carriers of dimensions 10×10×2 mm, so as to protect them. During the experiments, the OSLD discs were extracted from the plastic carriers in order to be irradiated inside aluminium pillboxes, along with the TLDs, to ensure charged particle equilibrium. The integrated dose is read thanks to light stimulation of the detector, with a Landauer microStar reader [23]. The read out process is non-destructive, so the integrated dose can be read several times, since the light stimulation keeps more than 99% of the information in the detector. On the other side, the detector cannot be annealed afterwards, the dose is then cumulated if the same detector is used several times. Since the detector sensitivity is strongly affected beyond a cumulated dose of 10 to 20 Gy, they are only used for the small dose range.
2) Calibration
The relation between the charge integrated in the detector (in nC) and the dose (in Gy) is determined by calibration measurements in a reference gamma field.
For doses below 2 Gy (measurements without filters), the calibration was carried out at the radiation protection division of CEA Cadarache. The aluminium pillboxes containing the detectors were placed in front of a 60Co source, at a distance of
80 cm. The KERMA (Kinetic Energy Released per unit MAss) in air rate was around 500 mGy.h-1, and measurements were
carried out for various doses between 100 mGy to 2 Gy by adjusting the exposure time. Thus, irradiations were performed with a constant dose rate, except for the source radioactive decay. The distance is adjusted with a remote-controlled sliding
Fig. 3. Filter transmittance versus wavelength. 1.E-03 1.E-02 1.E-01 1.E+00 1.E+01 1.E+02 200 300 400 500 600 700 800 900 1000 1100 Tr an sm itt an ce [% ] Wavelength [nm] 10% 1% 0.1%
table, and assumed to be perfectly reproducible. The irradiation time is programmed to the second. The uncertainty on the dose rate, calibrated against a standard ionization chamber, is 0.8%. The main uncertainty is on the TLD response reproducibility. It was experimentally assessed for TLD400 to be of 3.3% [9]. As it was not measured for TLD700, it is assumed to be equal. However, it has been shown that at doses beyond a few grays, a permanent sensitivity loss can be observed for this type of TLD, even with optimized annealing process [24].
Within this dose range, TLD responses appear to be proportional to the dose. The final uncertainty on the calibration coefficient, determined individually for each TLD, is around 1.9%.
The high dose calibration, carried out with filters, was performed at CEA Saclay on the PAGURE and POSEIDON
60Co irradiators, where the dose rate can reach several kGy.h-1.
In order to be able to carry out one irradiation, the readout, and the annealing process in a single day, the dose rate was adjusted for each irradiation in order to keep exposure time around one hour. It is assumed that the TLD responses are not sensitive to the dose rate. For each one of the three filters, 3 to 4 irradiations were carried out (see Tab. I).
In the readout process, TLDs are heated in a nitrogen atmosphere. Despite this nitrogen flow in the reader, some parasitic peaks due to residual moisture in the reader may appear, which can significantly contribute to the charge read for the lower dose readings with filters. To overcome this effect, a Hampel filter [25] is applied on the raw glow-curve before the integrated charge calculation (see Fig. 4). Afterwards, the background integrated signal coming from the photomultiplier tube (estimated every five readouts) is also subtracted from the TLD signals. It should be noted that the largest background contribution to the total signal is only of 1% for the TLD700 measurements at 1.5 Gy with the 0.1% filter. It has also been checked that non-irradiated detectors gave negligible signals compared to those measured.
The following uncertainties are taken into account into the calibration estimation:
- Dose rate uncertainty: it is provided by the calibrated IC used to determine the source dose rate at the measurement location, before irradiation. Depending on the distance (therefore on the dose rate), it amounts to 0.50% (below 50 Gy.h-1) or 0.65% (above 50 Gy.h-1).
- The positioning uncertainty is evaluated by propagating an estimated 3-cm distance difference between the calibrated IC and the TLDs. It affects the dose rate by 0.05%.
- Irradiation duration: in PAGURE and POSEIDON, the
60Co sources are extracted from their shielding
(respectively, storage pool) by mean of an elevator from below the irradiation room. As the counting time starts when the sources are fully extracted, there is an additional time to be added to the programmed one, linked to the sources movement. The equivalent additional time was experimentally assessed to be around 30 seconds in PAGURE, and below 10 seconds in POSEIDON. It is considered in the total integrated dose calculation. Considering rather high uncertainties on these transient times, it results in an additional uncertainty on the total integrated dose of 0.1%. - The last uncertainty is on the TLD response
reproducibility (see above).
Filtering and background subtraction operations are assumed not to contribute to the overall uncertainty.
To take into account the behaviour of the TLDs responses for the considered dose ranges, experimental data are fitted with a second order polynomial:
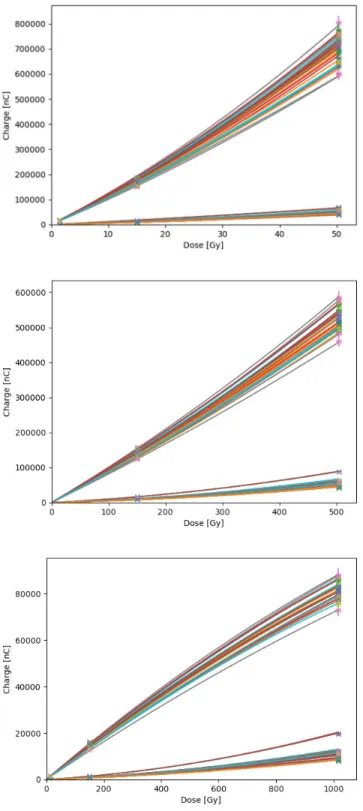
𝑄 = 𝑎𝐷 + 𝑏𝐷 (1) where 𝐷 is the integrated dose (Gy) and 𝑄 the charge read (nC), after filtering and background subtraction. Final calibration curves are shown on Fig. 5.
An orthogonal distance regression of the data is performed with the Python package scipy.ODR [26][27], in order to take into account both uncertainties on the integrated dose (dose
TABLEI
SUMMARY OF THE HIGH DOSES CALIBRATION IRRADIATIONS
Target dose (Gy) 10% Filter 1% 0.1%
1.5 x x x 15 x x 50 x 150 x x 500 x 1000 x
Fig. 4. Example of raw data filtering and correction on a TLD700 glow-curve, after a 15 Gy irradiation, read with the 0.1% filter.
rate, position, time) and the read charge (reproducibility). The dispersion of the linear coefficient 𝑏 for TLD400 is around 5%, and around 13% for TLD700. The dispersion of the quadratic coefficient 𝑎 for TLD400 is around 18% and around 15% for TLD700.
Indeed, the limitation of this calibration is the rather low number of measurements in a very large dose range. Therefore,
local changes of the calibration factors can remain hidden. However, it has the advantage of enabling the measurement of doses on a very broad range and with a single detector with the same experimental procedure.
IV. RESULTS
Several steady state power levels were investigated with reactor power ranging from 50 W to 250 kW. After reactor shutdown by rapid control rod insertion (SCRAM) the delayed contribution was also measured with MICs, MFC and TLDs. The methodology to distinguish the delayed and prompt gamma component from MIC and MFC measurements is described in [28]. To assess the delayed contribution with TLDs, they were inserted at different times after a SCRAM, in the central channel.
The MFC was inserted in the MP17 position, the reference gamma detector PTW IC was into the F25 position, into an irradiation channel. To assess the gamma flux dependence against the distance to the core centre, the MIC was moved in different measuring positions (Fig. 2).
We measured the dose with TLDs in the central channel A1, the peripheral position F26 and in the IC40 position of the carousel, inside the graphite reflector. TLDs were introduced in aluminium containers (the same as during the calibration), and packed into a polyethylene cylinder (Fig. 6). They were inserted at the bottom of the irradiation channels, while the reactor power was stable.
A. Prompt gamma flux characterization
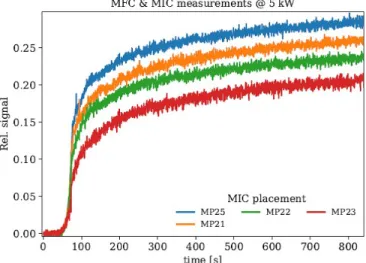
Regarding the gamma flux dependence on the position inside the core, we observed a clear decrease of the delayed contribution, linear with the distance to the core center (Fig. 7). Measurements carried out so far showed that the delayed contribution, estimated after 10 minutes of irradiation, obeys the following equation:
Delayed 𝛾 fraction = −6.25 × 10 . 𝑟 + 0.314 (2) 𝑟 being the distance (in centimeters) from the core center. This seems to originate from the environment of the measurement, since central measuring positions are surrounded by more fuel elements than the peripheral ones. The delayed contribution ranges roughly from 20 % (periphery) up to 30 % (inner position) of the total gamma flux after 10 minutes of reactor operation.
Fig. 5. Calibration curves for the different filters for all detectors. Top: 10% filter, middle: 1% filter, bottom: 0.1% filter. On each figure, the lower set of curves correspond to the TLD700.
Fig. 6. TLDs experimental setup for in-core measurements. Each aluminum container encloses one TLD400 and one TLD700.
The thorough description and complete results of the delayed gamma contribution analysis can be found in [28].
B. Gamma dose measurements
For gamma dose assessment in the different positions, a background measurement (3.5 min irradiation) and four irradiations at different power levels and lasting different times were carried out:
- 20 minutes at 0.2 kW - 10 minutes at 4 kW - 5 minutes at 80 kW - 2 minutes at 200 kW
The integrated doses during the last two irradiations should be equal, provided that the TLDs are not dose-rate sensitive.
For TLD700, the glow-curves after irradiations at higher power levels than 4 kW show a large shape difference with regard to the ones at lower power (Fig. 8). A second peak clearly appears, that was previously small compared to the main one. For low power irradiations, this second peak is assumed to be linked to the neutron contribution to the integrated dose. Indeed, the heights ratio can be used for neutron calibration of LiF TLDs [29][30]. Here, this peak could also be linked to the glow-curve shape modification due to the high integrated dose. In this case, the heating law for the readout is inadequate to accurately assess these doses. The TLD400 glow-curve shape does not seem to change significantly according to the integrated power (Fig. 9). However, experimental results show the same saturation phenomenon for the last two irradiations. This saturation issue could be either intrinsic to the detector (sensitivity modification), or caused by an inappropriate readout protocol, since it was not modified for this dose range. Further studies should be carried out at higher dose range in the calibration geometry to explain this behavior.
Two corrections are applied to the raw measured doses: the cavity correction factor and the energy and anisotropy factor. The first one corresponds to the fact that the calibrating reference quantity (gamma KERMA in air) does not correspond to the real energy deposited inside the detector. This factor is calculated using a fine Monte Carlo modeling of the calibration setup, taking into account the detectors and their surroundings. In the geometry used here, this factor is 1.040 ± 0.2% [10]. The second correction factor is meant to take into consideration the difference between the gamma calibration flux (mono-directional and with two energy peaks at 1.173 MeV and 1.332 MeV) and the reactor flux (isotropic with a continuous distribution from keV to several MeV). The value of this correction is taken from [10], since our configuration is very close. This correction factor is worth 1.040 ± 0.1%. Those calculations were made with the Monte Carlo code MCNP [31]. The measured total dose 𝑄 is the sum of gamma and neutron contributions:
𝑄 = 𝜂 𝐷 + 𝜂 𝐷 (3) where 𝜂 (respectively 𝜂 ) is the gamma (respectively neutron) sensitivity and 𝐷 (respectively 𝐷 ) is the gamma (respectively neutron) dose. Therefore, the gamma dose can be written:
𝐷 = − 𝐷 (4) The second term is the neutron contribution, divided into two
Fig. 7. Delayed gamma contribution measured with the MIC at 5 kW with regard to the position [28].
Fig. 8. Normalized TLD700 glow-curves after different irradiations. Total time of the readout: 23 s, time temperature profile in red.
0 50 100 150 200 250 300 350 400 0.0 0.2 0.4 0.6 0.8 1.0 1 10 19 28 37 46 55 64 73 82 91 10 0 10 9 11 8 12 7 13 6 14 5 15 4 16 3 17 2 18 1 19 0 19 9 Te m pe ra tu re [ °C ] In te ns ity [A .U .] Channel number BdF_F26 200W_20min_IC40 4kW_10min_F26 80kW_5min_F26 Temperature
Fig. 9. Normalized TLD400 glow-curves after different irradiations. Total time of the readout: 30 s, time temperature profile in red.
0 50 100 150 200 250 300 350 400 0.0 0.2 0.4 0.6 0.8 1.0 1 10 19 28 37 46 55 64 73 82 91 10 0 10 9 11 8 12 7 13 6 14 5 15 4 16 3 17 2 18 1 19 0 19 9 Te m pe ra tu re [ °C ] In te ns ity [A .U .] Channel number BdF_F26 200W_20min_IC40 4kW_10min_F26 80kW_5min_F26 Temperature
components, the first one for the thermal sensitivity, the second one for the epithermal sensitivity [9][11]. Assuming a cut-off energy 𝐸 , taken here at 0.625 eV, this neutron component can be written:
𝐷 = 𝑅𝜙 + 𝐷 (5) with 𝑅 is a response factor, in Gy.cm2, 𝜙 is the thermal
neutron fluence, 𝜂 𝜂⁄ is the relative neutron sensitivity between 𝐸 and 10 MeV, and 𝐷 is the calculated neutron dose between 𝐸 and 10 MeV. The two values 𝑅 and 𝜂 𝜂⁄ are taken from the literature, and for TLD400 are 0.45 Gy.(1012 neutron.cm-2)-1 ± 100% [32] and 0.288 ± 60%
[33], respectively. The calculations of the thermal neutron fluence and of neutrons doses were carried out with MCNP model of the core and of the detectors and surroundings.
The absolute background doses and the doses measured at 0.2 kW and 4 kW by TLD400 and OSLDs are presented in Tab. II. OSLDs were only used for background measurements. The uncertainties (given at 1𝜎) correspond to the maximum between the standard uncertainty propagation and the discrepancy between detectors. For the background measurements in F26 and IC40, there is a good agreement between both types of sensors.
The total prompt gamma air KERMA has been calculated in various core positions in [34]. By adding to the prompt component a delayed contribution, calculated as:
𝐾 ,tot= Delayed γ fraction𝐾 ,prompt (6)
one can estimate the total gamma air KERMA rate in the dosimeter positions, per unit power. The delayed 𝛾 fraction is evaluated from Eq. (2). Results are presented in Tab. III. Measurement uncertainties are defined here as the quadratic sum of the standard deviation between the averaged dose rates of the two irradiations (around 10%) and of the uncertainty on the neutron dose evaluation (from Eq. (5)). The uncertainties can be quite large, especially for the calculation in the core periphery, but there is a very good agreement between calculations and measurements. In the A1 position, the neutron contribution is 5% ± 55%, it is 6% ± 68% in the F26 position, and 8% ± 93% in the IC40 position.
C. Delayed contribution
The delayed gamma contribution was assessed after a 4 kW irradiation. TLDs were inserted at different times after SCRAM and spent different amount of time in the core (Tab. IV).
On the top plot of Fig. 10, one can see that the difference between MFC and MIC signal after SCRAM is related to the delayed neutrons. The decaying behavior of the TLD400 dose rate agrees with the behavior of the MIC. The bottom plot of Fig. 10 displays plots of relative MIC and TLD signals. The relative MIC signal is obtained by dividing the MIC signal with the constant value just before the reactor SCRAM. The TLD relative signal is obtained by normalizing the TLD values to the MIC signal averaged on the TLD time of integration, either on the first TLD measurement, from 2 to 122 seconds (red squares) or the second one, from 5.5 to 10.5 minutes (black triangles):
𝐷̇norm, =
̇
̇ or ∫ 𝐼(𝑡)d𝑡 (7)
where 𝐷̇ is the TLD dose rate measurement 𝑖, 𝐼(𝑡) the MIC signal, 𝑇 the time of integration of measurement 𝑖.
TABLEII
ABSOLUTE DOSE MEASUREMENTS IN ALUMINUM (GY)
Pos. Detector Background 3.5min 20min 200W 10min 4 kW
A1 TLD400 32 1.6% 119 10.2% 1055 2.0%
F26 TLD400 OSLD 8 8 12.1% 1.1% 34 - 10.0% - 309 - 5.4% -
IC40 TLD400 OSLD 1.1 1.0 7.3% 4.9% 6 - 8.0% - 80 - 2.5% -
TABLEIII
COMPARISON OF CALCULATED AND MEASURED TOTAL GAMMA AIR KERMA (GY.KW-1.MIN-1)
Pos.
Calculation Measurement
K,prompt fractionDelayed 1 K,tot Unc. K,tot Unc.
A1 19.6 31% 28.6 5.2 26.7 2.4
F26 5.6 19% 6.9 1.4 7.5 0.6
IC40 1.1 11% 1.3 1.2 1.6 0.3
1Delayed fraction uncertainty: 15%
TABLEIV
CHARACTERISTICS OF THE DELAYED MEASUREMENTS WITH TLDS
Time of insertion after SCRAM Integration duration
2 seconds 2 minutes
5.5 minutes 5 minutes
16 minutes 10 minutes
The relative signals of the MIC current and dose rates determined with TLD after a reactor SCRAM match one another very well, within 10% in both cases, except for the last point. The latter indeed shows a very high uncertainty linked to the discrepancy between TLDs. In addition, the MIC signal appears to be very noisy for currents below 1 nA, leading to a more difficult analysis. The slight difference between the two normalizations is attributable to the partial sensitivity of the TLDs to the neutron field, more specifically delayed neutrons, still present shortly after a reactor SCRAM. For the first TLD measurement after the SCRAM, the average neutron contribution is 0.1 Gy.min-1, representing less than 1% of the
total signal. However, the difference is of 1.5%, comparable to the measurement uncertainty, making it difficult to analyze.
Dose rate calculations, including the electron and gamma sources due to decay of radioactive products were calculated using the JSIR2S code package [35]. The reactor power was simulated in 109 steps, following the measured reactor power to a logarithmically interpolated precision of 1% at 4 kW and 15% at 10 W. The measured and modeled reactor power, as well as FC and IC signals in their respective positions as measured during and after 4 kW reactor power excursion, are displayed in Fig. 11. The absorbed dose calculations were performed in 10 steps during each TLD irradiation (Fig. 12). The transport part was performed using the ENDF/B-VII.1 nuclear data library [36], while the isotopic inventory calculations were performed using the JEFF 3.3 nuclear data library [37]. The comparison between calculated and measured doses during experiments is presented in Tab. V. The last experimental measurement (from 32 minutes after the SCRAM during 137 minutes) was not calculated. Uncertainties on the calculated values are between 3 to 4.5 % for each step. The experimental values and the calculated ones are in very good agreement. The dose rate calculations after shut down show a very good
agreement with the measured current in the MIC (Fig. 12).
D. Note on temperature
It was supposed that the saturation of the charge read after irradiation could come from self-annealing of the detector during irradiation, caused by its temperature increase. Recently, temperature measurements were carried out by attaching thermocouples onto bare 7LiF:Mg,Cu,P (MCP-7) and natLiF:Mg,Cu,P (MCP-N) TLDs, that show a clear increase
during power excursion [28]. For MCP-7 TLDs, the temperature seems to stabilize around 35 °C after a few minutes at 100 kW, and reached 70 °C at 250 kW (the pool temperature was stable around 25 °C). For MCP-N, the temperature reached 70 °C at 100 kW, and more than 120 °C at 250 kW, due to the larger amount of neutron interactions caused by the presence of
6Li. Temperatures have not been measured for TLD700 nor
TLD400, but they can be assumed to be similar to the ones of MCP-7 (rather low neutron sensitivity). Therefore, it seems quite unlikely that measurements carried out at 80 kW and 200 kW for 5 minutes and 2 minutes respectively, could have been affected by self-annealing.
Fig. 10. Gamma and neutron signals decay after SCRAM. Top: MIC and MFC currents (left axis) compared to dose rates in the TLD400 (right axis). Bottom: comparison of the normalized MIC current and dose rates. Horizontal bars correspond to the time of dose integration for TLDs.
0.5 5.0 50.0 500.0 1.E-10 1.E-09 1.E-08 1.E-07 0.01 0.10 1.00 10.00 100.00 TLD d os e ra te [G y. m in -1 ] M FC a nd M IC c ur re nt [ A]
Time after SCRAM [min]
MIC - MP21 MFC - MP17 TLD400 0.001 0.010 0.100 1.000 0.01 0.10 1.00 10.00 100.00 N or m al iz ed s ig na l [ a. u. ]
Time after SCRAM [min]
MIC - MP21 TLD400 norm 1 min TLD400 norm 8 min
Fig. 11. Measured and modeled reactor power, along with FC and IC measured signals during and after 4 kW power excursion.
Fig. 12. Measured and calculated dose rates into TLD400 (right axis) in the central channel after 4 kW power excursion. The MIC signal in the MP21 channel (left axis) is displayed for comparison against the dose rate calculated values. 0.7 7.0 70.0 1.E-10 1.E-09 1.E-08 1.E-07 0.01 0.10 1.00 10.00 TL D do se r at e [Gy .m in -1 ] M IC c ur re nt [A ]
Time after SCRAM [min]
MIC - MP21 TLD400 TLD400 - calc.
TABLEV
COMPARISON BETWEEN CALCULATED AND MEASURED DOSE AFTER THE 4 KW POWER EXCURSION (GY.MIN-1)
Integration time Measurement Calculation Discrepancy
[2-122] s. 17.6 ± 0.3 17.9 ± 0.2 (1.5 ± 1.7)%
[5.5 – 10.5] min. 8.2 ± 0.4 8.1 ± 0.1 (-0.3 ± 5.4)%
V. CONCLUSION AND OUTLOOKS
This study aimed at comparing measurements and calculations of gamma flux and dose rates in different irradiation positions of the JSI TRIGA reactor.
It is shown that TLD400 can be used for dose measurements with consistent results in the Gy to kGy range, without modifying the readout procedure. No recent studies were found to deal with high-dose measurements with TLD400 (CaF2:Mn)
dosimeters. Irradiations carried out in front of a 60Co source, up
to 103 Gy indicate that they do not present any linearity
change [38]. More recently, a 2008 study [39] shows that they present a linear behavior from 0.1 Gy to 100 Gy. The work presented here seems to prove that this range could be extended. Nevertheless, the calibration process has to be adapted in order to reach a better accuracy on a very large dose range. Further studies should be conducted to see up to what dose the TLD400 detectors can be used with this readout protocol, or if the latter should be modified to assess higher doses. Nevertheless, for both prompt and delayed gamma dose assessment, a very good agreement is observed between measurements and calculations. The TLD700 results were not presented since their readout and annealing protocol was not suited for such high integrated dose levels. Even background measurements with and without filters were not consistent. Further studies on the TLD700 readout protocol are to be performed, based on works on the adaptation of reading procedures for high dose measurement with LiF:Mg,Cu,P detectors [40]-[42].
This study emphasizes the complementarity between on-line and off-line techniques, and the interest of using TLDs for in-core dose monitoring, thanks to their measurement range spanning over several orders of magnitude.
ACKNOWLEDGMENT
The authors wish to thank the operator team of the TRIGA reactor, as well as the SPR/LRIR EDEPE group for the calibration phase at CEA Cadarache.
REFERENCES
[1] L. Snoj et al., Experimental benchmarks at the JSI TRIGA Mark II reactor for validation of computer codes and nuclear data, Proceedings, of European Research Reactor Conference, RRFM 2018, 11-15 March 2018, Munich, Germany.
[2] P. Filliatre et al., Experimental assessment of the kinetic parameters of the JSI TRIGA reactor, Annals of Nuclear Energy, vol. 83, p. 236‑245, sept. 2015.
[3] T. Kaiba et al., Calculations to Support On-line Neutron Spectrum Adjustment by Measurements with Miniature Fission Chambers in the JSI TRIGA Reactor, EPJ Web Conf. 170 04012 (2018).
[4] Review of 10 years of JSI – CEA collaboration on nuclear
instrumentation development, Proceedings of 27th International
Conference Nuclear Energy for New Europe, NENE, 10-13 September 2018, Portorož, Slovenia.
[5] V. Radulović et al., Measurements of miniature ionization chamber currents in the JSI TRIGA Mark II reactor demonstrate the importance of the delayed contribution to the photon field in nuclear reactors. Nuclear Instruments and Methods in Physics Research Section A: Accelerators, Spectrometers, Detectors and Associated Equipment, 804:149 – 154, 2015.
[6] D. Fourmentel et al., Delayed Gamma Measurements in Different Nuclear Research Reactors Bringing Out the Importance of Their Contribution in Gamma Flux Calculations. IEEE Transactions on Nuclear Science, 63(6):2875–2879, Dec 2016.
[7] M. Le Guillou, et al., State of the art on nuclear heating measurement methods and expected improvements in zero power research reactors, EPJ Nuclear Sci. Technol., vol. 3, p. 11, 2017.
[8] H. Amharrak, et al., Analysis and recent advances in gamma heating measurements in MINERVE facility by using TLD and OSLD techniques, IEEE Transactions on Nuclear Science, vol. 59, no. 4, pp. 1360–1368, Aug. 2012.
[9] H. Amharrak, Développement et optimisation de méthodes de mesures d’échauffements nucléaires et de flux gamma dans les réacteurs expérimentaux : identification, maîtrise, traitement et réduction des incertitudes associées, thesis, Aix-Marseille University, 2012. [10] H. Amharrak et al., Development and Optimization of Nuclear Heating
Measurement Techniques in Zero Power Experimental Reactors, IEEE Transactions on Nuclear Science, vol. 61, no. 5, pp. 2515–2526, Oct. 2014.
[11] M. Lemaire, Validation des calculs d’échauffements photoniques en réacteur d’irradiation au moyen du programme experimental AMMON et du dispositive CARMEN, thesis, Aix-Marseille University, 2015. [12] B. Obryk, et al., Method of thermoluminescent measurement of radiation
doses from micrograys up to a megagray with a single LiF:Mg,Cu,P detector, Radiat Prot Dosimetry, vol. 144, no. 1–4, pp. 543–547, Mar. 2011.
[13] B. Obryk, et al., High-dose TL dosimetry of reactor neutrons, Radiat Prot Dosimetry, vol. 180, no. 1–4, pp. 235–239, Nov. 2017.
[14] K. Ambrožič, et al., Application of JSIR2S for dosimetry calibration of Nürfet semiconductor dosimeters at the JSI TRIGA reactor in-between
reactor shutdowns, Proceeding of 28th International Conference Nuclear
Energy for New Europe, NENE, 9-12 September 2019, Portorož, Slovenia.
[15] D. Fourmentel, et al., Measurement of photon flux with a miniature gas ionization chamber in a Material Testing Reactor, Nuclear Instruments and Methods in Physics Research Section A: Accelerators, Spectrometers, Detectors and Associated Equipment, vol. 724, pp. 76– 82, Oct. 2013.
[16] H. Carcreff, et al., Last improvements of the CALMOS calorimeter dedicated to thermal neutron flux and nuclear heating measurements inside the OSIRIS reactor, EPJ Web Conf., vol. 170, p. 04002, 2018. DOI: 10.1051/epjconf/201817004002
[17] K. Ambrožič, et al., Computational support of the development of
nuclear heating calorimeter detector design, Proceedings of 6th ANIMMA
conference, Portorož, Slovenia, 2019. To be published
[18] R. Nieuwenhove, L. Vermeeren, Online gamma dose rate measurements by means of a self-powered gamma detector. IEEE Tran Nucl Sci. 49:1914–1918, 2002.
[19] T. Takeuchi, et al., Development of a self-powered gamma detector, Journal of Nuclear Science and Technology, Vol. 51, Nos. 7–8, 939– 943, 2014, DOI: 10.1080/00223131.2014.907549
[20] T. Schmitz, et al., The alanine detector in BNCT dosimetry: Dose response in thermal and epithermal neutron fields, Medical physics, vol. 42, no. 1, pp. 400-411, 2015.
[21] F. Desrosiers, et al., An Absorbed-Dose/Dose-Rate Dependence for the Alanine-EPR Dosimetry System and Its Implications in High-Dose Ionizing Radiation Metrology, J. Res. Natl. Inst. Stand. Technol. 113, 79-95, 2008.
[22] International Atomic Energy Agency in collaboration with World Health Organization: Calibration of Reference Dosimeters for External Beam Radiotherapy, Technical Report Series No. 469, Vienna, 2009. [23] Landauer, InLight complete dosimetry system solution: nanoDot
dosimeter, 2015.
[24] P. Bilski, T. Cybulski, M. Puchalska, M. Ptaszkiewicz, Sensitivity loss and recovery for individual TL peaks in LiF:Mg,Ti and LiF:Mg,Cu,P after high-dose irradiation, Radiation Measurements, vol. 43, issues 2– 6, 2008, pp. 357-360, 2008. DOI: 10.1016/j.radmeas.2007.10.002 [25] R. K. Pearson, Y. Neuvo, J. Astola and M. Gabbouj, “Generalized
Hampel Filters”, EURASIP J. Adv. Signal Processing, vol. 87(2016), 2016, DOI: 10.1186/s13634-016-0383-6
[26] P. T. Boggs and J. E. Rogers, Orthogonal Distance Regression, in Statistical analysis of measurement error models and applications: proceedings of the AMS-IMS-SIAM joint summer research conference held June 10-16, 1989, Contemporary Mathematics, vol. 112, pg. 186, 1990.
[27] https://docs.scipy.org/doc/scipy/reference/odr.html
[28] K. Ambrožič et al., Delayed gamma determination at the JSI TRIGA reactor by synchronous measurements with fission and ionization chambers. Nuclear Instruments and Methods in Physics Research
Section A: Accelerators, Spectrometers, Detectors and Associated Equipment, 911:94 – 103, 2018.
[29] G. Gambarini, G. Bartesaghi, S. Agosteo, E. Vanossi, M. Carrara, and M. Borroni, Determination of gamma dose and thermal neutron fluence in BNCT beams from the TLD-700 glow curve shape, Radiation Measurements, vol. 45, no. 3, pp. 640–642, Mar. 2010.
[30] M. Le Guillou et al., The CANDELLE Experiment for Characterization of Neutron Sensitivity of LiF TLDs, IEEE Transactions on Nuclear Science, vol. 65, no. 9, pp. 2426–2433, Sep. 2018.
[31] X-5 Monte Carlo Team, MCNP - Version 5, Vol. I: Overview and Theory, LA-UR-03-1987 (2003)
[32] ASTM. Standard E2450. Standard Practice for Application of CaF2(Mn) Thermoluminescence Dosimeters in Mixed Neutron-photon Environments. 2011.
[33] J.A.B. Gibson. EUR 10105 – The relative tissue-kerma sensitivity of thermoluminescent materials to neutrons – A review of available data. ISBN 92-825-5746-4. 1985.
[34] K. Ambrožič et al., Computational analysis of the dose rates at JSI TRIGA reactor irradiation facilities. Applied Radiation and Isotopes, 130:140 – 152, 2017.
[35] K. Ambrožič et al., JSIR2S Code for delayed radiation field calculations: validation against measurements at the JSI TRIGA reactor, paper in preparation.
[36] M. B. Chadwick et al., ENDF/B-VII.1 Nuclear Data for Science and Technology: Cross Sections, Covariances, Fission Product Yields and Decay Data, Nuclear Data Sheets, Volume 112, Issue 12, 2011, Pages 2887-2996, ISSN 0090-3752, DOI: 10.1016/j.nds.2011.11.002 [37] The Joint Evaluated Fission and Fusion File (JEFF), version 3.3, OECD
Nuclear energy Agency, http://www.oecd-nea.org/dbdata/jeff/jeff33/ [38] B. Burgkhardt, D. Singh, and E. Piesch, High-dose characteristics of
CaF2 and CaSO4 thermoluminescent dosimeters, Nuclear Instruments and Methods, vol. 141, no. 2, pp. 363–368, Mar. 1977.
[39] M. Teixeira, Performance of thermoluminescent materials for high dose dosimetry, presented at the 12th Congress of the International Radiation Protection Association, Buenos Aires, 2008.
[40] P. Bilski et al., Characteristics of LiF:Mg,Cu,P thermoluminescence at ultra-high dose range, Radiation Measurements, vol. 43, no. 2, pp. 315– 318, Feb. 2008.
[41] B. Obryk et al., Response of various types of lithium fluoride MCP detectors to high and ultra-high thermal neutron doses, Radiation Measurements, vol. 46, no. 12, pp. 1882–1885, Dec. 2011.
[42] B. Obryk et al., High-Dose TL Dosimetry of Reactor Neutrons, Radiat. Prot. Dosimetry, vol. 180, no. 1–4, pp. 235–239, Aug. 2018.