HAL Id: hal-01875533
https://hal.inria.fr/hal-01875533v3
Submitted on 19 Feb 2019
HAL is a multi-disciplinary open access
archive for the deposit and dissemination of
sci-entific research documents, whether they are
pub-lished or not. The documents may come from
teaching and research institutions in France or
abroad, or from public or private research centers.
L’archive ouverte pluridisciplinaire HAL, est
destinée au dépôt et à la diffusion de documents
scientifiques de niveau recherche, publiés ou non,
émanant des établissements d’enseignement et de
recherche français ou étrangers, des laboratoires
publics ou privés.
Nicolas Cedilnik, Josselin Duchateau, Rémi Dubois, Frédéric Sacher, Pierre
Jaïs, Hubert Cochet, Maxime Sermesant
To cite this version:
Nicolas Cedilnik, Josselin Duchateau, Rémi Dubois, Frédéric Sacher, Pierre Jaïs, et al.. Fast
Person-alized Electrophysiological Models from CT Images for Ventricular Tachycardia Ablation Planning.
EP-Europace, Oxford University Press (OUP): Policy B, 2018, 20. �hal-01875533v3�
Fast Personalised Electrophysiological Models from
CT Images for Ventricular Tachycardia Ablation
Planning
Nicolas Cedilnik, MSc (Université Côte d’Azur, Inria, Epione, Sophia Antipolis, France & Liryc Institute,
Bordeaux, France) Josselin Duchateau, MD (Liryc Institute, Bordeaux, France) Rémi Dubois, PhD (Liryc
Institute, Bordeaux, France) Frédéric Sacher, MD (Liryc Institute, Bordeaux, France) Pierre Jaı̈s, MD (Liryc
Institute, Bordeaux, France) Hubert Cochet, MD, PhD (Liryc Institute, Bordeaux, France) Maxime
Sermesant, PhD (Université Côte d’Azur, Inria, Epione, Sophia Antipolis, France)
Corresponding author Nicolas Cedilnik - nicolas.cedilnik@inria.fr Epione Research Project, Inria, Sophia Antipolis 2004 route des Lucioles BP 93
06902 SOPHIA ANTIPOLIS Cedex FRANCE
Abstract
Aims
Clinical application of patient-specific cardiac computer models requires fast and robust processing pipelines that can be seamlessly integrated into clinical workflows. We aim at building such a pipeline from computed tomography (CT) images to personalised cardiac electrophysiology (EP) model. The simulation output could be useful in the context of post-infarct ventricular tachycardia (VT) radio-frequency ablation (RFA) planning for pre-operative targets prediction.
Methods
The support for model personalisation is a patient-specific virtual three-dimensional heart obtained from CT images. Here the scar is identified as thinning of the myocardial wall on automatically computed thickness maps. We then use an Eikonal model of wave front propagation with reduced velocity in the damaged areas. An image-based vessel enhancement algorithm can automatically identify VT isthmuses. The personalised model is used for virtual pacing.
Results
We obtained a very fast pipeline that enables simulations in only a few minutes. It is fully automated starting from the semi-automated image segmentation phase. The
computational time frame is compatible with the construc-tion of a virtual pacing tool. In this tool, onset points and an optional directional block could be interactively selected. The directional block is a simple way to model tissue refractoriness. Output activation maps are compared with EP data acquired per-operatively. We show that this framework allows the reproduction of recorded re-entrant VT activation patterns.
Conclusion
Our simulation framework has an application in VT RFA intervention planning. It could be used to guide EP explorations and even predict ablation targets pre-operatively. This could reduce intervention duration and improve success rate.
Keywords
Electrophysiology, Computational Modelling, Myocardial Infarction, Computed Tomography, Catheter Ablation, Sudden Cardiac Death
Condensed abstract
Our goal is to build a fast and robust automated pipeline from computed tomography images to personalised cardiac electrophysiology simulations. We use myocardial wall thickness to parametrise the velocity of an Eikonal model of wave front propagation and reproduce electrophysiolog-ical data acquired during ventricular tachycardia radio-frequency ablation.
What’s new
• Fully automated pipeline from cardiac computed
tomography (CT) images to patient-specific virtual heart.
• Myocardial wall thickness used to parameterise local
conduction velocity for patient-specific cardiac electro-physiology (EP) model.
matically characterise VT channels on 3D images.
• Framework allowing a virtual pacing of the heart in a
few minutes after CT images segmentation.
• Comparison of simulated activation maps to EP data
acquired during post-infarct ventricular tachycardia (VT) radio-frequency ablation (RFA).
• Simulations could be used in the planning phase of VT
RFA interventions for target prediction, thus reducing intervention duration and improve success rate.
Background
Personalised, i.e., patient-specific, simulation of the heart electrical behaviour is a dynamic research field (1). Building such simulation is often a challenge as mathematical models can be computationally costly and clinical data is sparse and noisy. Most of the work in this area relies on extracting fibrosis from late-enhancement cardiac magnetic resonance imaging (MRI) (2). In a post-infarct context, this geometry is then classically divided into 3 different zones based on MRI signal processing: the healthy myocardium, the dense scar and a grey zone where fibrosis and remaining functional cardiomyocytes coexist. Grouped together, these three zones represent a three-dimensional domain upon which a set of partial differential equations (PDE) is solved. The model parameters are then chosen differently according to the different zones of the domain to represent the different electrophysiological properties of these tissues. Models typically used are reaction-diffusion models (3), where the reaction part mimics cell-level changes in membrane potential and the diffusion part reflects the ability of cardiac action potential to propagate through specialised structures. Adequately parametrising such models is a tedious task and solving them takes a lot of computational power and time, incompatible with the clinical typical time frame. These challenges are yet to be overcome for cardiac modelling to enter routine medical practice.
Additionally, before the actual simulation computation, the binary masks (outputs from image segmentation) often need to be transformed into another three-dimensional representation, a 3D mesh, more suited to finite elements PDE solvers (2). Choosing adequate parameters for the mesh generation step is critical in order to reach reasonable numerical accuracy and computational time. It requires specific expertise rarely available on day-to-day clinical practice.
Some authors have reported realistic intra-cardiac elec-trograms simulation (4), but the typical outputs of such models are usually visual simulations of the wave front propagation in the cardiac tissue, i.e. activation maps (3). Either way, the goal of such simulations is always to identify abnormal activation patterns linked to fatal arrhythmias. They could improve sudden cardiac death (SCD) risk prediction (5), a major challenge in cardiology (6).
ventricular tachycardia (VT) radio-frequency ablation (RFA) outcome by contributing to the planning phase of the intervention (7–9). In these interventions, the VT is usually induced and mapped (when hemodynamically tolerated) allowing the clinician to identify re-entry isthmus(es) to be ablated. This risky and long targets identification phase still drastically limits the spread and success rate of such interventions. Moreover, most of these patients already carry an implantable cardioverter-defibrillator (ICD), which makes model personalisation from MRI difficult if not impossible.
It has been reported that cardiac computed tomography (CT) images could be useful for VT RFA (10). CT offers better cost, accessibility, inter-centre and inter-personal reproducibility than MRI. Most notably CTs are not a problem in ICD carriers in whom the image quality and spatial resolution are preserved, as opposed to what happens with MRI. This is important as a majority of scar related VT ablations are conducted in ICD carriers. The better resolution of CT images could also be critical in appreciating scar heterogeneity and thus identifying potential targets.
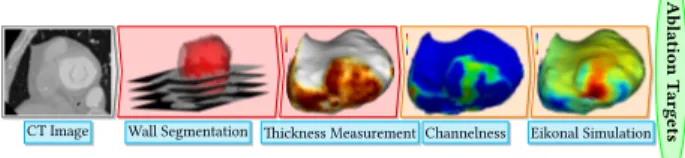
On CT images, the infarct scar is characterised by an apparent thinning of the myocardial wall (10), which has been shown to correlate with low voltage areas (11). Some VT re-entry isthmuses are also visible on such images, with a characteristic morphology on myocardial wall thickness maps. It has indeed been recently shown that they appear as a zone of moderate thinning bordered by more intense thinning and joining two areas of normal thickness (11). In this paper we propose a novel framework to simulate activation maps from CT images. It uses CT myocardial wall thickness to parametrise a fast organ-level wave front propagation model in a pipeline visually represented in fig. 1.
Ablation
T
argets
CT Image Wall Segmentation Thickness Measurement Channelness Eikonal Simulation
Fig. 1. Our Modelling Pipeline. After image acquisition, the en-docardial mask is segmented using a region-growing algorithm; the epicardial mask using manually drawn splines on a few slices and interpolation in-between. The infarct scar is identified as myocardial wall thinning, assessed by an automated method. Potential channels are identified using a channelness filter and activation maps can be simulated after choosing a pacing site.
Methods
Patient inclusion
The data we used come from 7 patients referred for catheter ablation therapy. They all presented chronic (minimum 5
years) infarct and suffered ventricular tachycardia episodes despite wearing an ICD.
Cardiac computed tomography images
Images were acquired using a contrast-enhanced ECG-gated cardiac multi-detector CT using a 64-slice clinical scanner (SOMATOM Definition, Siemens Medical Systems, Forchheim, Germany). Coronary angiography images were acquired during the injection of a 120 ml bolus of iomeprol 400 mg/ml (Bracco, Milan, Italy) at a rate of 4 ml/s. Radiation exposure was typically between 2 and 4 mSv. Images were acquired in supine position, with tube current modulation set to end-diastole. The resulting voxels have a dimension of 0.4×0.4×1 mm³, superior to what clinically available MRIs can produce. A resulting short-axis slice can be visualised on fig. 1 (left part).
Wall segmentation
On these images, the left ventricle was segmented as follows.
• The endocardial mask was segmented using a
region-growing algorithm, the thresholds to discriminate between the blood pool and the wall being optimised from a prior analysis of blood and wall densities.
• The epicardial mask was segmented using a
semi-automated tool built within the MUSIC software (IHU Liryc Bordeaux, Inria Sophia Antipolis, France): splines were manually drawn on a few slices and interpolated in-between.
The resulting myocardial wall mask (epicardial mask minus the endocardial mask) has around one million voxels.
Wall thickness estimation
0
6+
thickness
(mm)
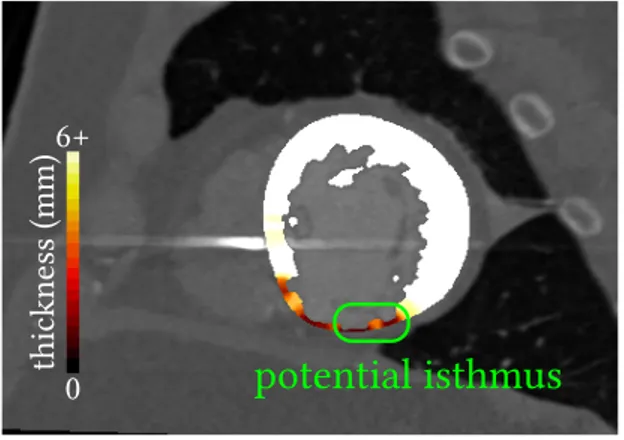
potential isthmus
Fig. 2. A typical VT isthmus as seen on CT images. Thinner zones surround a moderate thinning in the myocardial wall. The isthmus connects two areas of normal thickness (not seen on this slice).
On such images, chronic infarct scars appear as a thinning of the myocardial wall (10,12). To localise scars, instead
of successive dilations of the endocardial masks that were used in other studies (11), we opted for a fully automated and continuous method (13). Estimating the thickness of a structure from 3D medical images is not a trivial task. The accuracy can be compromised depending on how the two surfaces are described, and how the distance between them is computed. In this work, we chose to rely on a robust method to compute the shortest path between the endocardium and the epicardium, and then integrate the distance along this path. This method is based on solving a partial differential equation to compute a thickness value at every voxel of the wall mask (13). Example results of such thickness maps are presented on fig. 2.
Eikonal model
Numerous models were proposed in the literature to simulate cardiac action potential dynamics. In order to obtain a fast and robust pipeline, we used the Eikonal model of wave front propagation that directly outputs an activation map. It is very robust to changes in image resolution and it can be computed very efficiently with the fast-marching algorithm.
Model inputs are:
• The myocardial wall mask, i.e., the domain of
resolu-tion.
• For every voxel of this mask, a local conduction
velocity.
• One or more onset point(s), to initiate propagation. • (Optionally) An artificial unidirectional block, in order
to orientate the initial propagation, used to reproduce re-entrant VT patterns.
Let 𝑣 be the local conduction velocity, 𝑇 the local activation time and 𝑥 a voxel of the wall mask, the formal expression of this model is the following:
𝑣(𝑥)‖∇𝑇 (𝑥)‖ = 1
To solve this equation we used the fast marching algorithm implementation in the Insight Segmentation and Regis-tration Toolkit (ITK, Kitware, USA). It did not require any meshing step as this implementation directly takes advantage of the regular grid of CT 3D images.
Model parameters
Due to a “zig-zag’’ course of activation in surviving bundles existing in the infarcted tissue, the depolarisation wave front propagates very slowly before finally exiting the scar (14). We hypothesised that the wave front propagation velocity could be estimated from the wall thickness using a transfer function that would have the following features:
• It should reach a plateau, 𝑣𝑚𝑎𝑥, above physiological
0 2 p 5
vmin= 0.01
vmax= 0.6
myocardial wall thickness (mm)
wav e fr ont sp ee d (m/s)
Fig. 3. From computed tomography myocardial wall thickness to wave front propagation speed. Transforming an image parameter to a model parameter.
• It should be virtually null, 𝑣𝑚𝑖𝑛, below certain
thick-nesses, where almost no conducting cells remain. Let 𝑣 be the velocity at each voxel 𝑥 of the domain, 𝑊 the thickness, 𝑝 the mid-point between “pure scar’’ and “healthy’’ thicknesses and 𝑟 a parameter influencing the slope of the transition between 𝑣𝑚𝑖𝑛 and 𝑣𝑚𝑎𝑥. We
designed the following continuous transfer function from wall thickness to wave front propagation (see fig. 3):
𝑣(𝑥) = 𝑣𝑚𝑎𝑥− 𝑣𝑚𝑖𝑛
1 + 𝑒𝑟(𝑝−𝑊 (𝑥)) + 𝑣𝑚𝑖𝑛
The fast-marching solver needs a “stopping value’’, i.e., a maximum wave front reaching time. In our experiments, we set it to 500 ms and also assigned this value to non-activated parts of the domain.
In order to model a re-entrant VT pattern, we added an artificial “refractory wall’’, as previously described by Cedilnik et al (15). A conduction block orthogonal to the isthmus longitudinal axis was added a few voxels behind the simulation onset point. It allows to model tissue refractoriness while staying in the simple Eikonal model framework, allowing fast computations and keeping the computational cost very low. This is only needed to reproduce VT activation maps, not for activation maps from controlled pacing.
Automatic ridge detection
In order to detect VT isthmuses based on image criteria alone, we used the objectness filter (16), implementation of the Insight Toolkit (Kitware, USA). It is a generalisation of the Hessian matrix-based vessel enhancement method described by Frangi (17).
Briefly, the second order information, i.e., the Hessian Matrix, of an intensity image is used to estimate the
In an ideal vessel, the eigenvalues of the Hessian matrix of a voxel are such that:
• The smallest one is close to zero, meaning there is
little variation in intensity along a certain direction, along the vessel.
• The other two are significantly negative and almost
equal, meaning that in the two direction orthogonal to the vessel direction, there is a brutal change in intensity, i.e., we are going outside of the vessel. We fed this algorithm with a modified version of the thickness map where only potential isthmuses candidates (11), i.e. moderately thin zones between 2 and 5 mm thickness, remained. We tuned the filter’s parameter to respect the width known to characterise VT isthmuses on CT images (11).
We named the output maps obtained this way channelness maps.
This first step leads to a lot of over-detection (false positives) in the scar border zone. To avoid this, we handled the border zone using the following methodology:
• Perform a binary dilation with a radius of 2 mm of
the scar zones where the myocardial wall thickness is below 5 mm.
• Perform a binary dilation with a radius of 2 mm of
the healthy zones where the myocardial wall thickness is above 5 mm.
• Compute the border zone, defined as the intersection
of the two binary masks obtained this way (this intersection is the result of a logical AND operation on them).
• Set the channelness value on the voxel belonging to
the border zone to 0.
Comparison with recorded activation maps
In order to gain insight on our model relevance and limita-tions, we compared our simulations to 9 activation maps acquired during RFA interventions in our population of 7 patients. The maps were selected when their quality was sufficient to allow proper registration to CT images. These activation maps were produced by the Rhythmia mapping system (Boston Scientific, USA) using a 64-electrodes Orion Catheter. They were recorded during controlled pacing (2 maps) and VT (7 maps). They come in the form of surface triangular meshes in reference frames different from the corresponding CT images.
In order to compare both visually (qualitatively) and numerically (quantitatively) the outputs of our simulations to the reference data, we took advantage of the correlation between low-voltages zones and CT wall thinning areas (11) to manually align the two geometries. After fitting an ellipsoid to the point cloud and using the ellipsoid’s centre, we defined each point by spherical coordinates. A visual
Electro-physiological study bipolar voltage map CT thickness map
Original bipolar activation map Activation map “bull’s eye plot” Projected bipolar activation map Manually align low-voltage/wall thinning
Fit ellipsoid and compute “double polar coordinates” for each point
Project activation map on CT geometry
0 420 ms 1+ 0.05-mV 5+ 0 mm
Fig. 4. Registration of electrophysiological study data to computed tomography geometry. Image-based thickness map and EP data are manually aligned based on the wall thinning/low voltage correlation. EP data is then projected using a spherical coordinates system.
representation of this registration framework is presented on fig. 4. Finally, it was possible to project the data from the EP studies onto the more accurate geometry extracted from the CT images.
Using the ellipsoid long axis and a manually chosen point on the septum, this method also allows the fast and automated generation of bull’s eye plots.
Results
Execution time
The semi-automated segmentation of the left ventricle takes around 10 minutes for an experienced user of the MUSIC software. The thickness computation takes about 1 minute, depending on the number of voxels of the wall mask. The actual simulation takes less than 1 minute. The channelness computation is the longest step, around 2 to 4 minutes. This informal benchmark results were measured on an Intel i7-5500U-powered laptop.
Automated ridge detection
On all channelness maps, an expert cardiologist and an expert radiologist visually assessed that ridges correspond-ing to their critical isthmus definition could be detected using the channelness filter, see fig. 5.
Simulated activation maps
In 5 out of 9 maps the general activation patterns of the simulations obtained using our framework match the
0 6+
thickness (mm)
min max
channelness
Fig. 5. The channelness filter. (Left) thickness map and (Right) channelness filter results.
Thickness Map Simulated Activation Map Recorded Activation Map
Voltage Map Simulated Activation Map Recorded Activation Map
Re-entrant V entricular T achy car dia Right V entricle Contr olle d Pacing 0 6+ thickness (mm) 0.05-1+ v oltage (mV) min max activation time re-entrant pattern late activation
Fig. 6. Comparison of recorded and simulated activation maps. Our model is able to reproduce both VT re-entrant patterns and characteristic late activation times of scar zones.
recordings when using velocities and thicknesses thresholds found in the literature (3/7 VT maps, 2/2 controlled pacing maps). As can be seen on fig. 6, scar late activation is visible both on simulations and on controlled pacing. The characteristic figure of eight activation patterns of re-entrant VT can also be accurately reproduced using our framework, when using a refractory wall to give the propagation an initial direction. While the match between static representations is not always striking, video versions are available as supplementary materials and offer a better appreciation of dynamics of wave front propagation. This is the usual way recorded activation maps are visualized by the interventional cardiologist in order to decide ablation targets.
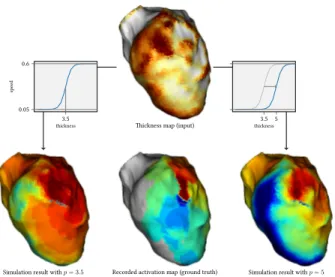
For 3 cases, adapting the thicknesses thresholds could significantly improve the aspect of the simulations (see fig. 7 and discussion below).
Thickness map (input)
Recorded activation map (ground truth)
Simulation result with p = 3.5 Simulation result with p = 5 3.5 0.05 0.6 thickness sp ee d 3.5 5 thickness
Fig. 7. Diminishing discrepancy between simulations and recordings by tuning the thickness to velocity transfer function. Illustration of tuning the p parameter of the thickness to velocity transfer function.
Discussion
Image segmentation
In our framework, the simulations rely a lot on how the myocardial wall segmentation is performed. Currently, the endocardial segmentation is robust and perfectly reproducible because it is fully automated. However, the epicardial segmentation is also crucial and is at the mo-ment only semi-automated. Developing a fully automated method for this task is one of our priorities and we expect it to improve our modelling framework’s robustness. It is worth mentioning that scar transmurality cannot be assessed using the CT scar characterisation technique that we used. Using late enhancement CT may be a way to address this issue and we will explore this opportunity in the future.
Model limitations
We voluntarily opted for the simplest cardiac EP model in order to build a fast pipeline. For instance, most of the related work includes an algorithmic fibre orientation estimation that we did not include. We do not believe that it would improve the results a lot, as fibre orientation and its influence are still hard to estimate, particularly in infarcted zones.
In contrast, we believe that an important phenomenon that our model does not address is the front curvature impact. A straight wave front is known to propagate faster than a curved wave front, but this is not the case in our simulations. In some cases, this results in fast, unrealistic, “U-turns’’ of the excitation front. This could be improved with extensions of the Eikonal model (18), or by switching to a reaction-diffusion model parametrised on wall thickness. The main challenge will here be to preserve a
complexity and required computational time.
Another limitation of our model is that it only addresses macroscopic re-entrant channel, given the scale at which the simulations are computed. Microscopic re-entries are out of its scope.
Velocities: Our model probably simplifies activation
pat-terns inside the VT isthmuses by globally slowing down the propagation in them. A recent animal study (19) indeed suggests that the depolarisation slows down when entering and exiting the isthmus but propagates normally in between. The wave front would then be slowed down inside the core of the isthmus. However, we think that our global slowing down in the whole isthmus is a relevant averaging simplification at the organ scale. In the case where our further work would show the pro-eminence of this phenomenon, an option would be to use channelness maps to accordingly change velocities in isthmuses.
Thickness thresholds: Based on data from a recent study
(11), we defined global thickness thresholds across all patients to discriminate between healthy and scar zones. Specifically, we set them to below 2 mm for “pure scar’’ and above 5 mm for healthy myocardium. However, in some VT cases, the wave front propagation crossed scar zones too fast and matching the recording proved more challenging.
We noticed that in those cases, for instance the one shown in fig. 7, the simulation output could be drastically improved by shifting these thresholds to higher values, i.e., by raising the 𝑝 parameter of our thickness to velocity transfer function. Using patient-specific thresholds both for thickness maps analysis and model parametrisation could improve the use of CT images in the context of VT RFA. These patient-specific thresholds could possibly be determined by the disease history or image features such as the distribution of thickness for a specific myocardial wall.
Parameter optimization
Model: Using the registration of image and EP data in
the common frame of reference described in the Methods section, it was possible to define a metric to quantify differences between simulations and ground truths. Using the mean square difference between these data, we there-fore optimised the thickness to velocity transfer function parameters (𝑣𝑚𝑎𝑥, 𝑣𝑚𝑖𝑛, 𝑝 and 𝑟, see fig. 3) to minimise
the discrepancy between simulations and recordings. To this end, we used the covariance matrix-evolution strategy algorithm (20), suited for this type of non-convex optimisa-tion problem. While minimising the mean square difference did improve the numerical matching of the simulations to the recording, the overall activation pattern actually was often degraded. This is partly due to noise in the target EP data and to the fact that the mean square difference
metric may not be adapted to preserving the activation patterns like the typical figure of eight shape of re-entrant VT. How to define this pattern-aware metric is still an open question.
Channelness: The output of the channelness is also highly
depending on setting the right parameters for the object-ness mapping, including a channelobject-ness threshold. These parameters need to be optimised and validated on a larger multi-centric database.
Conclusion: a clinically compatible modelling framework
The simulation framework presented in this article may be useful for EP modelling to enter clinical practice. It requires little human interaction and expertise to go from imaging data to EP simulations. It is very fast and would even be faster by developing implementations more suited to such purpose than the generic ones we currently use. The availability and reproducibility offered by CT images and such automation could help personalised cardiac modelling to enter clinical applications.
Additional material
Videos for comparison of simulated and recorded activa-tions maps available at: http://www-sop.inria.fr/members/ Nicolas.Cedilnik/europace2018.mp4
Acknowledgments
Part of this work was funded by the ERC starting grant EC-STATIC (715093), the Equipex MUSIC (ANR-11-EQPX-0030) and the IHU LIRYC (ANR-10-IAHU-04).
References
1. Gray RA, Pathmanathan P. Patient-Specific Cardiovas-cular Computational Modeling: Diversity of Personalization and Challenges. Journal of Cardiovascular Translational Research. 2018 Mar;1–9.
2. Lopez-Perez A, Sebastian R, Ferrero JM. Three-dimensional cardiac computational modelling: Methods, features and applications. Biomedical Engineering Online. 2015 Apr;14:35.
3. Chen Z, Cabrera-Loyoza R, Relan J, Sohal M, Shetty A, Karim R, et al. Biophysical Modeling Predicts Ventric-ular Tachycardia Inducibility and Circuit Morphology: A Combined Clinical Validation and Computer Modeling Approach. Journal of cardiovascular electrophysiology. 2016;27(7):851–60.
4. Cabrera-Lozoya R, Berte B, Cochet H, Jaïs P, Ayache N, Sermesant M. Image-based Biophysical Simulation of Intracardiac Abnormal Ventricular Electrograms. IEEE Transactions on Biomedical Engineering. 2016;PP(99).
5. Arevalo HJ, Vadakkumpadan F, Guallar E, Jebb A, Malamas P, Wu KC, et al. Arrhythmia risk stratifica-tion of patients after myocardial infarcstratifica-tion using per-sonalized heart models. Nature Communications. 2016 May;7:ncomms11437.
6. Hill AP, Perry MD, Abi‐Gerges N, Couderc J, Fermini B, Hancox JC, et al. Computational cardiology and risk stratification for sudden cardiac death: One of the grand challenges for cardiology in the 21st century. The Journal of Physiology. 2016 Dec;594(23):6893–908.
7. Relan J, Chinchapatnam P, Sermesant M, Rhode K, Ginks M, Delingette H, et al. Coupled personalization of cardiac electrophysiology models for prediction of ischaemic ventricular tachycardia. Interface Focus. 2011;1(3):396–407. 8. Ciaccio EJ, Ashikaga H, Kaba RA, Cervantes D, Hopenfeld B, Wit AL, et al. Model of reentrant ventricular tachycardia based on infarct border zone geometry predicts reentrant circuit features as determined by activation mapping. Heart Rhythm. 2007 Aug;4(8):1034–45.
9. Trayanova NA, Pashakhanloo F, Wu KC, Halperin HR. Imaging-Based Simulations for Predicting Sudden Death and Guiding Ventricular Tachycardia Ablation. Circulation: Arrhythmia and Electrophysiology. 2017 Jul;10(7):e004743. 10. Mahida S, Sacher F, Dubois R, Sermesant M, Bo-gun F, Haïssaguerre M, et al. Cardiac Imaging in Pa-tients With Ventricular Tachycardia. Circulation. 2017 Dec;136(25):2491–507.
11. Ghannam Michael, Cochet Hubert, Jais Pierre, Serme-sant Maxime, Patel Smita, Siontis Konstantinos C., et al. Correlation between computer tomography‐derived scar topography and critical ablation sites in postinfarction ventricular tachycardia. Journal of Cardiovascular Electro-physiology. 2018 Jan;29(3):438–45.
12. Nikolaou K, Knez A, Sagmeister S, Wintersperger BJ, Boekstegers P, Steinbeck G, et al. Assessment of myocardial infarctions using multidetector-row computed tomography. Journal of computer assisted tomography. 2004;28(2):286– 92.
13. Yezzi A, Prince J. An eulerian PDE approach for computing tissue thickness. IEEE Transactions on Medical Imaging. 2003 Oct;22(10):1332–9.
14. De Bakker JM, Van Capelle FJ, Janse MJ, Tasseron S, Vermeulen JT, De Jonge N, et al. Slow conduction in the infarcted human heart. ’Zigzag’ course of activation. Circulation. 1993;88(3):915–26.
15. Cedilnik N, Duchateau J, Dubois R, Jaïs P, Cochet H, Sermesant M. VT Scan: Towards an Efficient Pipeline from Computed Tomography Images to Ventricular Tachycardia Ablation. In: Functional Imaging and Modelling of the Heart. Springer, Cham; 2017. pp. 271–9. (Lecture Notes in Computer Science).
dimensionality and shape. The Insight Journal. 2007;3:1– 14.
17. Frangi AF, Niessen WJ, Vincken KL, Viergever MA. Multiscale vessel enhancement filtering. In: International Conference on Medical Image Computing and Computer-Assisted Intervention. Springer; 1998. pp. 130–7.
18. Chinchapatnam P, Rhode KS, Ginks M, Rinaldi CA, Lambiase P, Razavi R, et al. Model-Based Imaging of Cardiac Apparent Conductivity and Local Conduction Velocity for Diagnosis and Planning of Therapy. IEEE Transactions on Medical Imaging. 2008 Nov;27(11):1631– 42.
19. Anter E, Tschabrunn CM, Buxton AE, Josephson ME. High-Resolution Mapping of Postinfarction Reentrant Ventricular Tachycardia Clinical Perspective: Electrophysi-ological Characterization of the Circuit. Circulation. 2016 Jul;134(4):314–27.
20. Hansen N, Müller SD, Koumoutsakos P. Reducing the time complexity of the derandomized evolution strategy with covariance matrix adaptation (CMA-ES). Evolution-ary computation. 2003;11(1):1–18.