Testing Facility for Slow Strain Rate Testing
by
Jeffrey R. O'Donnell B.S. Engineering Physics Rensselaer Polytechnic Institute
(1990)
Submitted to the Department of Nuclear Engineering in Partial Fulfillment of the Requirements for the Degree of
Doctor of Philosophy at the
Massachusetts Institute of Technology September 1994
© Massachusetts Institute of Technology 1994. All rights reserved.
Signature of
Certified by
Author .-
-A//77 /Department of Nuclear Engineering August 1994 I - -- , I / Certified by
/7-)O tto K. Harling, Ph. D. Profes of Nuclear Engineering Director, Nuclear Reactor Laboratory
Thesis Supervisor
/1 '- -
-Gordon Kohse, Ph. D. Principal Research Scientist, Nuclear Reactor Laboratory
Thesis Supervisor
Accepted by
MASSACHUSE'rrt INSTrlrU;E
I Allen F. Henry, Ph. D.
Chairman, Department Committee on Graduate Students
NOV 161994
[ 1
V
-Testing Facility for Slow Strain Rate -Testing
by
Jeffrey R. O'Donnell
Submitted to the Department of Nuclear Engineering on August 11, 1994 in partial fulfillment of the requirements for the Degree of Doctor of Philosophy
Abstract
In the past several years a variety of austenitic stainless steel components in boiling water reactor (BWR) cores have failed by an intergranular cracking mechanism called irradiation assisted stress corrosion cracking (IASCC). Characteristics of such failures are that the component was exposed to a fast neutron fluence under tensile stress and in an oxidizing water environment.
A facility to study IASCC in typical BWR water and radiation environments was designed, built, and put into in-core service. This facility positions a pre-irradiated test specimen in the core of the MIT research reactor, circulates water with controlled Lemerature and chemistry past the specimen, and applies a tensile load to the specimen to maintain a constant slow strain rate until specimen failure. A DC potential drop (DCPD) technique was developed to measure specimen strain during in-core testing. Electrodes are incorporated to measure the specimen's electrochemical corrosion potential (ECP) under test, and for the initial analysis, while varying water chemistry, flow rate, in-core position, and reactor power level. A chemistry control system was designed and built to measure and control the water chemistry. Remote specimen handling tools and procedures were developed to allow the fracture surface to be analyzed by scanning electron microscopy (SEM). The facility and operating procedures were designed to minimize radiation exposure of personnel during facility operation and transfer to a hot cell for specimen removal and replacement. The facility's design also ensures that testing mishaps pose minimal risk to safe reactor operation.
Initial in-core tests, which measured the ECP of stainless steel in in-flux sections of the testing rig were completed successfully. These tests showed that the desired oxidizing environment can be established and monitored during in-core SSRT testing. Initial in-core SSRT testing has been demonstrated and a series of SSRT tests are presently underway. Results of these tests will be used to investigate the effects of
neutron fluence and materials variables on IASCC.
Thesis Supervisor: Professor Otto K. Harling
Title: Professor of Nuclear Engineering Director, Nuclear Reactor Laboratory Thesis Supervisor: Dr. Gordon Kohse
ACKNOWLEDGMENTS
I am especially grateful to my thesis advisors, Professor Otto Harling and Dr. Gordon Kohse, for their guidance and assistance throughout my work at MIT. I am grateful to Professor Harling in particular for providing me with the opportunity to attend MIT and work on a satisfying research project. Other project members whose assistance was essential to the successful completion of this work include Professor Ron Ballinger, Mr. Pete Stahle, Mr. Sunichi Suzuki, Mr. Kenro Takamori and Mr. Yoshihiko Tanaka. The efforts of Dr. Scott Mao and Mr. Y. Komori during the conceptual design phase of
this project are also appreciated.
The help of individuals during the construction and testing phases of this project was crucial for the successful completion of this work. Undergraduate students who endured numerous long and difficult hours with me in the lab include Greg MacCandless, Juan Gonzales, Dorian Balch, Judy Leckman, and Joel Palacios. Theodore (TJ) Weber and Julian Guerra de la Torre were the most valuable players on the IASCC team for this past year which proved to be most challenging. TJ's and Julian's efforts were above and beyond my expectations of them. When situations arose requiring contingency measures, TJ and Julian consistently made themselves available. Every doctoral student should be lucky enough to have people like them to work with.
The assistance of the professionals at the MIT Nuclear Reactor Laboratory must not go unrecognized. Ernesto Cabello and Yakov Ostrovski provided valuable experience and help too numerous to list. The craftsman in the machine shop, Johnny Wasik and Ronny St. Jean, provided quality work and, when required, provided this work in a timely manner. The Reactor Radiation Protection Office, Fred McWilliams, Marcia Austin, Todd Date and Bruce Graber, provided many patient hours of consultation and guidance. I thank the Reactor Operations Office, Eddy Lau, Tom Newton, and the team of supervisors and reactor operators, for their help. The assistance of the reactor
maintenance staff for getting the facility into the reactor in working order was greatly appreciated Paul Menadier and Yakov Ostrovski spent many long hours working on the electrical and interlock system. Ed Block helped with the initial design of the shielded transport cask and rig handling system. John "Chach" DiCiaccio spent many long days and evenings with me getting the rig handling system into working order. His efforts and skills were especially appreciated. I felt most confident when John was available to move the rig. Martin Morra and Hiu Au spent much time helping me with the metallurgical aspects this thesis.
I thank Alexis Lewis for operating the SEM during the analysis of the irradiated specimens, Frank Warmsley for scanning the images into the computer, and Tom Fuller for his supervision while transporting these highly radioactive specimens to the SEM room for the analysis. I also thank Professor Tetsuo Shoji for offering his expertise during the SEM analysis of the fractured specimens.
I thank the Tokyo Electric Power Company (TEPCo) for funding a valuable and challenging research project. I also thank Professor Manson Benedict for providing me with funding for this past year through the Manson Benedict Fellowship.
I thank my parents, Robert and Graycie O'Donnell, for their constant assurance and support before and throughout my academic endeavor. Following six years of Naval service, poor high school grades still kept me from being admitted into an engineering school. My parents persuaded me to attend community college. They knew that with honest effort I could get good grades and would then be able to attend a "good" school.
Seven years later I am writing my Ph.D. thesis at MIT; they were right.
Most important of all I thank my wife, Kathy. While I spent many long days and nights in the lab, she was at home taking care of our son alone. I owe her countless nights and weekends. I also owe my son, Michael, a lot of time. Mike, daddy will soon be home for dinner and to read to you much more frequently. I look forward to repaying these debts.
TABLE OF CONTENTS
ABSTRACT ... 2 ACKNOWLEDGMENTS ...3 TABLE OF CONTENTS ...5 LIST OF FIGURES ...8 LIST OF TABLES ... 15 1. INTRODUCTION ... 17 1.1. Motivation ... 17 1.2. Background ... 18 1.3. Context ...191.4. Organization of This Report ... 20
1.5. References ... 21
2. LITERATURE REVIEW ... 23
2.1. Corrosion, Electrochemical Corrosion Potential (ECP) and ECP Measurements ... 23
2.2. Stress Corrosion Cracking ... 36
2.3. The Slow Strain Rate Technique ... 44
2.4. Irradiation Assisted Stress Corrosion Cracking ... 48
2.5. References ... 62
3. EXPERIMENTAL FACILITY DESCRIPTION ... 67
3.1. Facility Overview ... 67
3.2. In-Core Tensile Rig ... ... ... 69
3.2.1. Load Train ... 69
3.2.2. Strain Measurement by DCPD ... 73
3.2.3. Loading Machine and Loading Machine Control ... 85
3.2.4. Test Specimen ECP Measurement ... 86
3.2.5. Autoclave ... 89
3.2.6. Thimble ... 90
3.2.7. Dummy Element ... 91
3.2.8. CO2 Thimble Atmosphere ... 92
3.3. In-Core ECP Mapping Rig . ... ... ... ... 94
3.3.1. Rig Description ... 94
3.4. Water System ... 97
3.4.1. Main Recirculation Loop ... 97
3.4.2. Main Loop Heater and Heater Control ... 100
3.4.3. Charging System ... 103
3.4.4. Letdown System... 105
3.4.5. Clean Up System... 108
3.4.6. Bubbling System ... 110
3.4.7. Chemical Injection System ... 111
3.4.8. Pressurizer and Pressure Relief. ... 112
3.4.9. Auxiliary Cooling Water System ... 113
3.5 Data Acquisition ... 116
3.5.1. In-Core ECP Mapping ... 117
3.5.2. In-Core SSRT Testing ... 118
3.6. Radioactive Rig Handing System ... 119
3.6.1. Introduction ... 119
3.6.2. Component Description ... ... 120
3.7. Radioactive Specimen Handling and Post Test Analysis ... 124
3.7.1. Preparing SSRT Specimens for In-Core SSRT Testing ... 124
3.7.2. Preparing Fractured SSRT Specimens for SEM Analysis ... 125
3.8. Facility Support ... 126
3.8.1. Reactor Top Lid ... 126
3.8.2. Experimental Platform ... 127
3.9. References ... ... 127
4. FUNCTIONAL CHARACTERISTICS OF THE FACILITY . ...128
4.1. Main Loop Water Volume ... 129
4.2. Reactivity Calculations ... 130
4.3. Main Loop Thermal-Hydraulic Characteristics ... 131
4.4. Shielding Requirements ... 133
4.4.1. Shielding Requirements for Transport of In-Core Components ... 133
4.4.2. Shielding Requirements for Transport of Pre-Irradiated Specimens ... 136
4.4.3. Shielding Requirements for Post SSRT Fracture Surface Analysis by Scanning Electron Microscopy ... 137
4.4.4. Shielding Requirements for Main Loop Water Volume ... 138
4.5. Stress Analysis ... 138
4.5.1. Thimble ... 141
4.5.2. Autoclave ... 141
4.5.3. Load Train ... 141
4.5.4. Potential for Hydrogen Embrittlement of Titanium Sections ... 142
4.5.5. Transfer Cask and Rig Handling Equipment ... 142
4.6. References ... 143
5. TESTING AND RESULTS ... 145
5.1. Experimental Characterization ... 145
5.1.1. Load Train Compliance Test... 145
5.1.2. Facility Thermal-Hydraulic Characterization ... 148
5.1.3. Specimen Load-Thermal Stability Test ... 151
5.1.4. DCPD/Strain Calibration ... 152
5.1.5. ECP Electrode Verification and Rig Pre-Conditioning ... 156
5.1.6. Out of Core High Temperature Tensile Tests ... 164
5.1.7. Reactivity Testing ... 168
5.2. In-core ECP Mapping ... 170
5.2.1. Overview ... 170
5.2.2. Test Description ... 171
5.2.3. Results ... 173
5.2.4. Discussion ... 183
5.3. In-core Tensile Testing ... 188
5.2.1. Overview ... 188
5.2.2. Test Description ... 188
5.2.3. Results and Fractography ... 192
5.2.4. D iscussion ... 219
6. CONCLUSIONS ... 227
6.1. Conclusions of In-Core ECP Measurements ... 227
6.2. Conclusions of In-Core Tensile Tests ... 228
6.3. Recommendations for Future Work ... 229
APPENDIX A. DETAILED DRAWINGS ... 231
APPENDIX B. FUNCTIONAL CHARACTERISTICS OF THE FACILITY ... 247
B. 1. Water Volume ... 247
B.2. Rig W orth ... 248
B.3. ECP Rig Worth ... 249
B.4. Fluid Flow Characteristics of the Main Loop ... 250
B.5. Titanium Mass of In-Core Rig ... 251
B.6. Main Loop Radiation Levels-SSRT Rig ... 252
B.7. Main Loop Radiation Levels-ECP Rig ... 253
APPENDIX C. OPERATING INSTRUCTIONS ... 254
C. 1. Facility Startup Operations ... 254
C. 1.1. Specimen Loading onto Load Train Grips ... 254
C. 1.2. Assembling the Facility in its In-Core Test Position ... 257
C. 1.3. Tensile Test Startup ... 265
C.2. Facility Shutdown Operations ... 267
C.2.1. Securing From a Tensile Test ... 267
C.2.2. Disassembling the Entire Testing Facility From the Reactor Top .... 269
C.2.3. Removal of the Fractured Test Specimen ... 275
C.3. Other Facility Operations ... 276
C.3.1. Removal of the Load Train to the Hot Cell for Specimen Replacement and Immediate Re-Testing ... 276
C.3.2. Removing Dissolved Gases From the Charging Tank by Venting the Charging Tank ...277
C.3.3. Adding Water to the Charging Tank ... 278
C.3.4. Adding Additional Gas to the Charging Tank ...280
APPENDIX D. RESULTS FROM IN-CORE ECP MEASUREMENTS ...281
Figure 2. 1. Figure 2.2. Figure 2.3. Figure 2.4. Figure 2.5. Figure 2.6. Figure 2.7. Figure 2.8. Figure 2.9. Figure 2.10. Figure 2.11. Figure 2.12. Figure 2.13. Figure 2.14. Figure 2.15. Figure 2.16.
LIST OF FIGURES
Electrochemical reactions occurring during corrosion of
iron in oxygenated water. ... 24 Schematic of a circuit to measure the electrode potential of a
m etal specim en ... 26 Representation of transport and kinetic processes in electrode
reactions ... 28 Electrode potential-current density behavior of a cathodically biased half-cell reaction showing regions of activation control, transport control, and the transition between the two polarization mechanisms ... 29 Polarization diagram for the oxidation of iron in oxygenated water ... 31
Polarization diagram for the same reaction illustrated in Figure 2.4.
shown with increased oxygen concentration. ... 32 Polarization diagram for the same reaction illustrated in Figure 2.4.
shown with added transport control. ... 33
Polarization diagram for a passivating metal ... 34
Polarization diagram for the recombination of H2and 02 on a
platinum surface. H2 is in stoichiometric excess of 02. The
exchange current density for the hydrogen reaction on platinum
is higher than the recombination rate ... 35
Relationships between time-to-failure and applied stress
commonly observed in SCC ... 39
Relationship between tf and initial value of stress intensity
factor (K ) ... 40 General relationship between stress corrosion crack velocity and
stress intensity (K). ... 41
Stress and computed strain rate over the duration of a CERT test ... 46
Typical stress-strain curves for SSRT tests conducted with and
without SCC ... 47 Effects of radiation on SCC ...49 Relationship between the severity of IASCC and fluence for
irradiated type 304 stainless steel under slow strain rate conditions in water at 288°C containing different amounts of oxygen. From
Figure 2.17. Figure 2.18. Figure 2.19. Figure 2.20. Figure 2.21. Figure 2.22. Figure 3.1. Figure 3.2. Figure 3.3. Figure 3.4. Figure 3.5. Figure 3.6. Figure 3.7. Figure 3.8. Figure 3.9. Figure 3.10. Figure 3.11. Figure 3.12. Figure 3.13. Figure 3.14. Figure 3.15. Figure 3.16. Figure 3.17.
Compositional profiles by dedicated STEM analysis across grain boundaries from a HP type 348 stainless steel irradiated to
3.4 x 10²¹ n/cm2... 52
Effect of neutron fluence on the strength of annealed type 304 stainless steel irradiated of 370°C ... 54
Effect of fast neutron fluence under LWR conditions on mechanical properties at 288°C of types 304 and 304L stainless steel ... 54
Plot of calculated creep strain rates at 3000C in a fast neutron flux of 5x101 3n/cm2s (E>1 MeV) as a function of stress ... 57
IASCC susceptibility as related to ECP ... 59
ECP as related to oxidant concentration. ... 60
The IASCC In-Core Mechanical Testing Facility ... 70
The in-core SSRT rig specimen and grips. ... 72
Typical examples of resistance change with strain [2] ... 75
The DCPD Current Loop ... 84
The Instron Loading Machine ... 87
The Top of the Autoclave ... 91
The Thimble Atmosphere Control System ... 93
The IASCC In-Core ECP Rig ... 96
The IASCC Water Chemistry Control System ... 98
Main Recirculation Loop ... 99
Schematic Diagram of the Main Loop Heater Controller ... 101
Schematic Diagram for Wiring of Main Loop Heater ... 102
Charging System ... 103
Letdown System ... 106
Clean Up System ... 109
Bubbling System ... ... 110
Figure Figure Figure Figure 3.18. 3.19. 3.20. 3.21. Figure 4.1. Figure 5.1. Figure 5.2. Figure 5.3. Figure 5.4. Figure 5.5. Figure 5.6. Figure 5.7. Figure 5.8. Figure 5.9. Figure 5.10. Figure 5.11. Figure 5.12. Figure 5.13. Figure 5.14. Figure 5.15. Figure Figure Figure 5.16. 5.17. 5.18.
Pressurizer and Pressure Relief System ... 113
Auxiliary Cooling Water System ... ... 114
Shielded "Clam Shell" Transport Cask ... 121
The three ton crane shown lifting the IASCC thimble/autoclave and the shielded "clam shell" transport cask ... 123
Activity of the rig which has in it the most radioactive pre-irradiated SSRT specimen over the course of the rig's lifetime ... 136
The rigid test specimen utilized in the load train compliance measurement ... 146
Plot of load train extension verses load as measured during the load train compliance test ... 147
Plot generated using specimen number 2005 in its first loading ... 154
Plot generated using specimen number 2022 in its first loading ... 155
Plot generated using specimen number 2022 in its second loading ... 155
Ag/AgCl electrode in top electrode cluster ... 158
Ag/AgCl electrode in bottom electrode cluster ... 158
Stainless steel electrode in top electrode cluster ... 159
Stainless steel electrode in bottom electrode cluster ... 159
Platinum electrode in top electrode cluster ... 160
Platinum electrode in bottom electrode cluster ... 160
Dissolved oxygen concentration in letdown line ... 161
Calculated ECP of stainless steel in both top and bottom electrode clusters ... 161
Letdown line water conductivity ... 162
Stress vs. strain plot of the two AJ9139 specimens tested. Specimen number 2012 was furnace sensitized. Both specimens were cold worked to 30% following any heat treatment ... 165
Fracture surface from specimen 2005 ... 166
Fracture surface from specimen 2012 ... 166
Figure 5.19. Figure 5.20. Figure 5.21. Figure 5.22. Figure 5.23. Figure Figure 5.24. 5.25. Figure 5.26. Figure 5.27. Figure Figure Figure Figure Figure Figure 5.28. 5.29. 5.30. 5.31. 5.32. 5.33. Figure 5.34. Figure 5.35. Figure 5.36. Figure 5.37.
In-core ECPs measured and letdown line oxygen levels for the first 10 days of in-core testing. Shaded areas at the bottom of the graph indicates reactor operation at 4.5 MW unless otherwise
specified ... 174
In-core ECP and letdown line oxygen for in-core testing days 8 through 20 ... 175
In-core ECP and letdown line oxygen and hydrogen for days 17 through 26. ECPs are converted to SHE using the in-core Ag/AgCl electrodes ... 178
Letdown line conductivity for in-core testing at position 1 ... 180
In-core ECP and letdown line oxygen and hydrogen for in-core testing in position 2. ECPs are converted to SHE using the in-core A g/A g/C l electrodes ... 182
Letdown line conductivity for in-core testing at position 2 ... 182
Temperature in both electrode clusters, in-core ECP and letdown line dissolved oxygen recorded during the 200°C run ... 186
In-core ECP and letdown line oxygen and hydrogen for days 19 through 23. ECPs are converted to SHE using the in-core platinum electrodes ... 186
In-core ECP and letdown line oxygen and hydrogen for HWC runs in position 2. ECPs are converted to SHE using the in-core platinum electrodes ... 187
Stress strain curve for initial in-core tests ... 193
Strain and strain rate for testing of specimen 2021 ... 194
Strain and strain rate for testing of specimen 2003 ... 195
Strain and strain rate for testing of specimen 80 ... 196
Strain and strain rate for testing of specimen 82 ... 197
The fracture surface of specimen 2003. 97% of the surface was intergranular. A small ductile region appears at the top of the picture ... 198
The side of specimen 2003. The specimen's diameter is reduced by less than 5% ... 198
Ductile section of the fracture surface ... 199
Magnified image of small ductile sites ... 199
Figure Figure Figure Figure 5.38. 5.39. 5.40. 5.41. Figure 5.42. Figure 5.43. Figure Figure 5.44. 5.45. Figure 5.46. Figure 5.47. Figure Figure Figure Figure Figure Figure Figure 5.48. 5.49. 5.50. 5.51. 5.52. 5.53. 5.54. Figure 5.55. Figure 5.56. Figure Figure 5.57. 5.58.
Magnified image of intergranular fracture surface ... 200
Side view of shear ductile fracture surface ... 201
Magnified image of shear ductile fracture surface ... 201
Side of specimen 2003 away from the fracture surface. A small crack is seen in the center of the image ... 202
Magnified image of the crack illustrated in Figure 5.42 ... 202
Side of specimen 2003 away from the fracture surface. Several cracks are seen ... 203
Magnified image of large crack in upper right side of Figure 5.44 ... 203
One of several small cracks found on the side of the specimen away from the fracture surface ... 204
One of several small cracks found on the side of the specimen away from the fracture surface ... 204
Fracture surface of specimen 80. A small intergranular surface was found in the bottom edge of the fracture surface. The reduction in area was 65% ... 205
A magnified image of the ductile fracture surface of specimen 80 ... 205
The top left quadrant of specimen 80's fracture surface ... 206
The bottom left quadrant of specimen 80's fracture surface. The intergranular surface is seen in the bottom of the image ... 206
The top right quadrant of specimen 80's fracture surface ... 207
The bottom right quadrant of specimen 80's fracture surface ... 207
Side image of the fracture surface of specimen 80 ... 208
Typical blunted cracks found on the side of specimen 80 away from the fracture surface ... 208
Magnified image of blunted crack shown in figure 5.53. Note the small cracks emanating from the corners of the blunted crack ... 209
Image of side of specimen 80 away from the fracture surface showing slip bands, and small intergranular, transgranular and blunted cracks... 209
Magnified image of transgranular cracks on the side of specimen 80.... 210
Fracture surface of specimen 82. 9% of the fracture surface was found to be intergranular. The reduction in area was 60% ... 211
Figure 5.59. Figure 5.60. Figure 5.61. Figure Figure Figure Figure 5.62. 5.63. 5.64. 5.65. Figure 5.66. Figure 5.67. Figure Figure 5.68. 5.69. Figure 5.70. Figure 5.71. Figure 5.72. Figure 5.73. Fgure D. 1. Fgure D.2. Fgure D.3. Fgure D.4. Fgure D.5.
Side view of specimen 82's fracture surface showing reduction in diameter
and large blunted cracks ... 211
Top left quadrant of the fracture surface. Intergranular and transgranular surfaces are seen on the left side of this image ... 212
Bottom left quadrant of the fracture surface. An intergranular surface is seen at the bottom right corner of this image ... 212
Top right quadrant of the fracture surface ... 213
Bottom right quadrant of the fracture surface ... 213
A magnified image of the intergranular surface seen in Figure 5.60 ... 214
Side view of the intergranular surface seen in Figure 5.63. Note the slip bands to the side of the intergranular surface, but no slip bands in line with the intergranular surface ... 214
Magnified view of the intergranular surface seen in Figure 5.59. The intergranular surface becomes transgranular and finally ductile ... 215
A large crack on the side of specimen 82 which became blunted. This crack is seen in the lower right side of the specimen's side in Figure 5.58 ... 215
Cracks in the side of specimen 82 ... ... 216
Intergranular, transgranular and blunted cracks on the side of specimen 80 ... 216
Transgranular cracks emanating from the corner of a blunted crack ... 217
Cracks at what appears to be a grain triple point ... 217
Transgranular cracks ... 218
Cracks and blunted cracks ... ... ... 2182... Raw position 1 data for Ag/AgCl electrodes in the top and bottom clusters and reference autoclave ... 281
Raw position 1 data for platinum electrodes in the top and bottom clusters and reference autoclave ... 281
Raw position 1 data for stainless steel electrodes in the top and bottom clusters and reference autoclave ... 282
Position 1 data for letdown line dissolved oxygen and hydrogen concentration ... 282
Fgure D.6. Fgure D.7. Fgure D.8. Fgure D.9. Fgure D. 10. Figure E. 1.
Raw position 2 data for Ag/AgCl electrodes in the top and bottom
clusters and reference autoclave ... 283 Raw position 2 data for platinum electrodes in the top and bottom
clusters and reference autoclave ... 284 Raw position 1 data for stainless steel electrodes in the top and bottom
clusters and reference autoclave ... 284 Position 2 data for letdown line dissolved oxygen and hydrogen
concentration ... 285 Position 1 data for Temperature ... 285 Mechanical property test of specimen 80, alloy 304 irradiated to
LIST OF TABLES
Table 2.1. Electrode potentials of some common reference electrodes ... 27
Table 2.2. Alloy/Environment Systems Exhibiting SCC [10] ... 38
Table 2.3. IASCC Service Experience [19] ... 50
Table 2.4. Strain rate as a function of applied constant load at 550°C under fast neutron irradiation [2] ... 55
Table 2.5. Strain rate as a function of applied constant load at 300°C under fast neutron irradiation ... 56
Table 2.6. Strain rate as a function of applied constant load at 300°C under fast neutron flux of lx1014n/cm2s (E>0.1 MeV) ... 56
Table 2.7. Linear energy transfer (LET) and G-values for some radiation species [18] ... 58
Table 3.1. Load Train Components ... 69
Table 3.2. Clean up system valve line up for charging tank clean up ... 109
Table 3.3. Temperatures monitored in the water system ... 115
Table 3.4. The ranges and accuracy's of letdown line instrumentation ... 116
Table 3.5. Data acquisition wire designation used for in-core ECP mapping ... 118
Table 3.6. Data acquisition wire designation during in-core SSRT testing ... 119
Table 5.1. Computation of load train stiffness. ... ... 148
Table 5.2. Temperatures measured and the heat loss calculated using these temperatures for various charging rates ... 150
Table 5.3. Temperature excursion for several heater demands ... 151
Table 5.4. Temperature effects on specimen strain ... 152
Table 5.5. Average values and associated errors for the parameters a and 5 determined during the DCPD calibration ... 155
Table 5.6. Major Events in Pre-Filming ... 163
Table 5.7. Measurement of the rig's reactivity addition in the fully flooded condition ... 168
Table 5.8.
Table 5.9.
Table 5.10.
Table 5.11.
Measurement of the rig's reactivity addition in the dry condition ... 169 Measurement of the rig's reactivity addition in the 50% flooded
condition ... 169 Parameters controlled during for in-core SSRT testing ... 189 Letdown water chemistry during in-core SSRT testing ... 192
1. INTRODUCTION
1.1. Motivation
Environmental degradation of structural materials is a large concern to the nuclear power industry. It is responsible for limiting power plant reliability and availability, and may become significant in nuclear reactor plant lifetime extension assessments. Failure of in-core structural components requires repair or replacement resulting in expensive power plant downtime. The cost of one day's electrical capacity lost by a typical large nuclear power station is estimated to be $800,000 or more. Maintenance on in-core components is difficult because of high radiation levels. ALARA concerns prevail and nonstandard procedures must be developed. Disposing of failed radioactive components is becoming increasingly expensive because of the present low level waste storage environment, and waste handling presents additional personnel exposure concerns. Failure of structural components during operation may present reactor safety issues. Moreover, since the lifetime cost of a nuclear power plant includes an initial capital layout that is large when compared to the initial capital layout for construction of fossil powered electric generator plants, extending the lifetime of a nuclear power plant is very attractive. It is estimated that a life extension for one nuclear power station of 20 years could save the utility $600 million or more [1,2]. Material performance qualification
standards for use in extending power plant licenses can be expected.
The phenomena of materials degradation in a nuclear reactor are not completely understood. Fast neutron irradiation from the fission process interacting with material creates defects in the material's crystal lattice which can affect the mechanical performance of these materials. Reactor structural materials are typically iron or nickel based alloys containing chromium which imparts its general corrosion resistance in
typical light water reactor environments. The steels, however, are susceptible to localized forms of corrosion including environmentally assisted cracking (EAC).
EAC is the phenomena whereby a crack in a structural material can propagate under a tensile load significantly lower than the expected critical tensile load to cause failure. For EAC to occur a specific material/environment condition must be established. The costs to the nuclear power industry resulting from unscheduled plant shutdowns as a result of EAC are high. In 1990 alone the lost electrical generating capacity resulting from unscheduled plant shutdowns is estimated to be in excess of 1280 days with a cost estimated to be over $300 million. Repairs and remedial actions made necessary because of EAC of reactor internal structural components have increased annual O&M and capital costs by an estimated $1 billion [3]. EAC consists of several cracking mechanisms including stress corrosion cracking (SCC), hydrogen embrittlement, corrosion fatigue, and liquid metal embrittlement. When a solution-annealed stainless steel, exposed to neutron and gamma radiation, cracks intergranularly under tensile stress in an oxidizing water environment the cracking mechanism is called irradiation assisted stress corrosion cracking (IASCC).
1.2. Background
IASCC was first observed in the early 1960's. Solution-annealed 304 stainless steel was used as fuel cladding in early pressurized water reactors (PWR). High tensile stresses were present because of fuel swelling and therefore high tensile stresses were initially considered to be required for IASCC to occur. Since then, it has become apparent that lower stresses may cause cracking if the material is exposed to increased fast neutron fluences. In the 1970's, for example, cracking in creviced locations in instrument dry tubes and control blade handles and sheaths was observed with tensile stresses considered at that time to be lower than the minimum stress required for IASCC to occur. Similar failures have been reported in commercial and US Navy test
pressurized water reactors (PWR), and in steam generating, heavy water reactors (SGHWR), which indicates that the problem is generic to all water reactor types [4]. To date, IASCC in reactor internals has been discovered during routine inspections and therefore has not significantly affected plant availability. However, the implications of IASCC are significant, both in terms of repair and outage costs as well as in the potential for cracking in components, e.g. a boiling water reactor's (BWR) upper guide plate, which may be extremely difficult to repair.
1.3. Context
The Tokyo Electric Power Company (TEPCo) and the Electric Power Research Institute (EPRI) funded the IASCC project at the Massachusetts Institute of Technology (MIT) with a goal to advance the general understanding of IASCC. The scope of the
MIT IASCC project is described in this section.
Tne MIIT IASCC project focused oil the intergranular cracking of austenitic stainless steels subjected to a fast neutron fluence. Several tasks were undertaken to meet the projects goals. A variety of material specimens were irradiated under highly controlled temperature and environmental conditions [5]. Irradiated TEM specimens were used for metallurgical evaluation. TEM analysis was used to characterize the irradiated microstructure. STEM analysis measured the degree of major element segregation. A computer code was developed to predict the degree of radiation induced segregation (RIS) of major austenitic stainless steel elements (chromium, Iron, and
Nickel) [6,7]. The STEM analysis was used to benchmark the RIS code.
Efforts are being made to apply two electrochemical techniques to RIS characterization. While analytical electron microscopy provides a large amount of information about individual grain boundaries, electrochemical techniques have the potential to provide more global and average information on material damage. The two
electrochemical techniques undergoing evaluation are a modified electrochemical potentiokinetic repassivation (EPR) technique for grain boundary chromium depletion, and a fixed transpassive technique for impurity (Si, P) segregation [8].
Theoretical activities include the development of bulk water radiolysis and crevice chemistry models [9, 10]. Experimental activities include an in-core boiling coolant corrosion loop [11], an core slow strain rate tensile (SSRT) testing facility, and an in-core crack growth sensor facility [12].
The author of this thesis led the group which did the final design, constructed and placed into service an in-core SSRT facility, the centerpiece of the IASCC program. The facility was intended to be used to test the susceptibility of pre-irradiated specimens to IASCC in a variety of environments including normal BWR water chemistry (NWC) and hydrogen water chemistry (HWC), and various fast neutron and gamma fluxes by varying reactor power or sample location. Forthcoming results of testing performed utilizing this facility will be used to develop a model which can be used to determine the degree to which a nuclear reactor structural component is likely to fail by IASCC. Initial testing utilized tensile test specimens irradiated in the dry irradiation facility. These specimens have a nearly identical history to the TEM specimens used in other phases of the IASCC program.
1.4. Organization of this Report
This report is divided into 6 chapters. Chapter 1 contains an outline of the problem which this project addresses, and briefly describes the relation of the project to other efforts. Chapter 2 contains a literature review leading to a description of the state of the knowledge of IASCC. Chapter 3 contains a physical description of facility. Chapter 4 contains the functional characteristics of the facility. Chapter 5 includes results and testing performed using the facility for this thesis. This chapter is divided into 3 sections.
Section 5.1. describes the testing and results obtained in out-of-core testing and other tests leading to initial in-core testing. Section 5.2. covers in-core ECP measurements. Section 5.3. describes the in-core slow strain rate testing performed. Chapter 6 contains conclusions and recommendations for future experiments.
1.5. References
[1] Bonk, G., Heiges, H., and Stancave, P., "BWR Life Extension Economics", ASME Conference on Plant Aging, 1987
[2] Tiren, L. I., "Swedish Program on Plant Life Extension", JAIF International Conference on Water Chemistry in Nuclear Power Plants, Tokyo, 1988
[3] Marston, T. U., and Jones, R. L., "Materials Degradation Problems in the Advanced Light Water Reactors" Proceedings of the Fifth International Conference on the Environmental Degradation of Materials in Nuclear Power Systems: Water Reactors,
ANS, Monterey, CA, 1991
[4] Andresen et al., "State of the Knowledge of Radiation Effects on Environmental Cracking in Light Water Reactor Core Materials: Proceedings of the Fourth International Conference on the Environmental Degradation of Materials in Nuclear Power Systems: Water Reactors, ANS, Houston, TX, 1990
[5] Boerigter, S. T., "An Investigation of Neutron-Irradiation Induced Segregation in
Austenitic Stainless Steels", Sc.D. Thesis, MIT, Cambridge, MA, 1992.
[6] Mansoux, H., "Experimental Determination of Radiation Induced Segregation Susceptibility in Austenitic Stainless Steels", S.M. Thesis, MIT, Cambridge, MA, 1994.
[7] Flores, C. D., "Evaluation of Radiation Induced Segregation in Fe-Ni-Cr Alloys", S.M. Thesis, MIT, Cambridge, MA, 1994.
[8] MIT Nuclear Reactor Laboratory Staff, "Irradiation Assisted Stress Corrosion Cracking and BWR Chemistry Studies", Fifth Annual Report for the Period August, 1992-August, 1993 to Tokyo Electric Power Company and Electric Power Research Institute, Report No. MITNRL-055, 1993.
[9] Chun J. H., "Modeling of BWR Water Chemistry", S.M. Thesis, MIT, Cambridge, MA, 1990.
[10] Chun J. H., "Modeling of Crevice Chemistry", Sc.D. Thesis, MIT, Cambridge,
MA, 1994.
[11] Outwater, J. O., "Design, Construction, and Commissioning of an In-Pile BWR Coolant Chemistry Loop", Sc.D. Thesis, MIT, Cambridge, MA, 1991.
[12] Vergara Aimone, J. A., "The Development of a Facility for the Evaluation of Environmentally Assisted Cracking of In-Core Structural Materials in Light Water Reactors", Ph.D. Thesis, MIT, Cambridge, MA, 1992.
2. LITERATURE REVIEW
2.1. Corrosion, Electrochemical Corrosion Potential (ECP) and ECP
Measurements
Corrosion may be defined as an unintentional attack on a material through reaction with the surrounding medium [1]. According to this definition materials other than metals may be subject to corrosion, but a description of the environmental degradation of metals independent of other materials is required. There is good reason for this. Since metals have a high electrical conductivity, their corrosion is normally of an electrochemical nature. The chemical deterioration of electrically non-conducting materials, such as plastics and ceramics, is governed by other physico-chemical principles
[2]. For the purpose of this report only metals in aqueous environments are discussed.
Corrosion of metal typically takes the form of oxidation of metallic atoms to ionic species, for example the oxidation of iron
Fe - Fe+2 + 2e-. (1)
The results is a phase change, metallic Fe to ionic Fe. To conserve charge a corresponding reduction reaction must take place on the metallic surface, for example the reduction of oxygen
02 + 2H++ 2e- - H20. (2)
2
The reduction reaction can take place anywhere on the metallic surface since the electrons are free to conduct throughout the metal, its range, however, is usually limited by the conductivity of the water environment. A typical electrochemical corrosion reaction, which is made up of oxidation and reduction half-reactions, is illustrated in
Figure 2.1. Electrochemical reactions occurring during corrosion of iron in oxygenated
water.
There exists a change in Gibb's free energy (AG) corresponding to the electrochemical corrosion reaction. The free energy change for a chemical reaction at a
temperature, T, is given by
AGT= AG + RTln[HT(ai] (3)
where: AGTO is the standard free energy change for the reaction at the prescribed temperature
ai is the activity for species i in the chemical reaction
ni is the stoichiometric coefficient for species i in the chemical reaction R is the gas constant
This relation is useful as a criterion of corrosion for postulated corrosion reactions. Its main utility is that it allows one to determine if a particular environmental agent (dissolved species) or the solvent can interact chemically with the metallic structure to cause corrosion of the structure. If the computed free energy change is positive, it indicates that corrosion cannot occur by the postulated reaction. However, it does not
mean that it cannot occur due to the reaction of another environmental agent. For this reason, computations of this sort should include all constituents present in the environment. If the computed free energy change is negative, it indicates that corrosion by the postulated reaction is possible. The computation provides no information about the rate of the corrosion reaction.
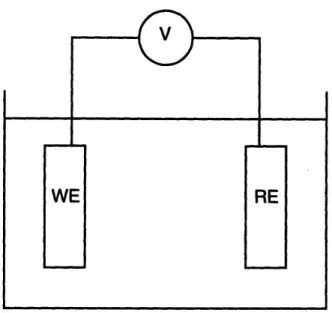
Electrochemical reactions take place at the interface between a metal and a solution. An electric field exist across this metal-solution interface due to the nature of the reaction and the deposition of ionic and dipolar species on the solution side of the interface. Although this electric field is present, it cannot be measured directly. Instead, a relative measurement is made which provides useful information.
The circuit used in this measurement is shown in Figure 2.2. The electrode under investigation, the working electrode (WE), is connected to a second electrode, the reference electrode (RE), by means of a voltmeter. Since it is necessary to make these measurements in virtual absence of a current flowing in the circuit, the voltmeter should have a high input impedance (typically greater than 1010Q). In addition, it is usually necessary to make measurements over the range of +2.OV with an accuracy on the order
Figure 2.2. Schematic of a circuit to measure the electrode potential of a metal
specimen.
The reference electrode should possess a stable, known electrical half-cell potential. Since all electrode potential measurements are relative, it is convenient to have a "universal reference point". By convention, the electrode potential of the hydrogen-hydrogen ion electrochemical reaction
H2 - 2H++ 2e- (4)
is assumed to have a value of 0.OOOV when hydrogen gas is at unit fugacity (partial
pressure of H2 = 1.0 atm.) and the hydrogen ion is at unit activity (solution pH=O). This
is called the standard hydrogen electrode (SHE). The electrode potentials of some
Table 2.1. Electrode potentials of some common reference electrodes.
Name Electrode Reaction Electrode Potential
(V vs. SHE) Saturated Calomel 2Hg + 2C1 --- Hg2Cl2 + 2e 0.241
Saturated Copper-Copper Cu -4 Cu2 ++ 2e- 0.298
Sulfate
Silver-Silver Chloride Ag + C- -- AgCI + e- 0.234 (for 1.0 M KCI)
The half-cell potential of the working electrode (test specimen) shown in Figure 2.2. is the voltage measured on the voltmeter and is reported as x.xxxV vs. reference electrode. If it is required to convert the value of the electrode potential of the working electrode from one reference electrode scale to another, this is accomplished by
2 = 1 + 1/2 (5)
where 2 is the working electrode half-cell potential relative to the second reference electrode (the desired quantity), X1 is the working electrode half-cell potential relative to the first reference electrode (measured quantity), and 1/2 is the electrode half-cell potential of the first reference electrode relative to the second reference electrode.
The Nernst equation is derived using equation 3 to be
0=
+RTl[I(ai)'
]
(6)
nF
where: F is Faraday's constant.
n is the number of equivalents in the chemical reaction.
and may be used to compute equilibrium half-cell potentials for electrochemical reactions. Activities and/or activity coefficients are not necessarily available for ionic species in most corrosive solutions. For these cases, the concentrations of the species are
used in place of the respective activities when computing equilibrium electrode potentials.
The transport of chemical species from the bulk of the solution to the metal/solution interface is required for the electrochemical reaction to be sustained. Figure 2.3. is a representation of the processes which constitute the entire electrochemical reaction.
lad:IL
an
Surface
reaction
Product
-Figure 2.3. Representation of transport and kinetic processes in electrode reactions.
The three steps associated with electrochemical reactions are transport of the reactants to the interface, the electron transfer reaction, and transport of products from the interface. These steps are sequential. and therefore the overall rate of reaction is controlled by the slowest of the three steps. When the transport processes are capable of operating at high rates relative to the electron transfer reaction, the rate of the overall reaction can be described by the equations of electrode kinetics. These kinds of electrode reactions are said to be under activation control. On the other hand, when the electrode reaction is capable of operating at high rates relative to the transport processes, the rate of overall reaction can be described by equations of convective mass transport. These types
M - -- A- -O. is''i:.ri·:%·.·.·.··,-i ::p '-i·· :::5·r , · 5-:.
i· i···:):6::i*.·-::;
·I-'·:·".I
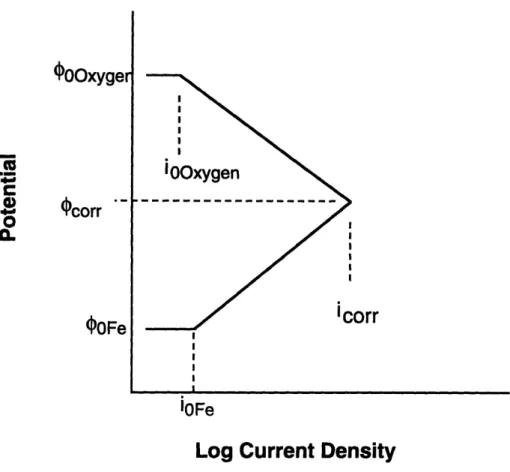
of electrode reactions are said to be under transport control. Figure 2.4. illustrates the polarization, or change in electrode potential, of an electrode operating under activation and transport control. The corrosion rate is proportional to current density.
C ci O Co a) c) 1L
Log Current Density
Figure 2.4. Electrode potential-current density behavior of a cathodically biased half-cell
reaction showing regions of activation control, transport control, and the transition between the two polarization mechanisms.
In Figure 2.4. 0 is the equilibrium half-cell potential of the test specimen, or working electrode, with no corrosion present (current density is zero). This is the potential calculated using the Nernst relation (equation 6). As the reaction rate is increased the current density becomes greater than i0, and the potential begins to polarize under activation control. The current density labeled io is known as the exchange current density. This is an important parameter because its value has a large effect on the corrosion potential and reaction rate. The exchange current density is different for each half cell reaction, and for the oxidation or reduction of species present in solution such as
oxygen and hydrogen it is dependent on the metal surface on which the reaction takes
place on.
Structural components undergoing corrosion are usually not in contact with an external electrical circuit. Both the oxidation and reduction reactions take place on the same surface of the corroding component. Since the equilibrium half-cell potential of the oxidation and reduction reactions are different, the resulting measurable potential of the component is a mixed potential. This potential is known as the electrochemical corrosion potential (ECP). To develop an understanding of a component's ECP, charge conservation of the reactions taking place on the component's surface must be considered.
2;ij(qcoO)
= 0,
(7)
where ij (corr) is the current density of the jth half-cell reaction at the component's ECP,
-ruuxyger
c-corr
0
%OFe orr iOFeLog Current Density
Figure 2.5. Polarization diagram for the oxidation of iron in oxygenated water.
The exchange current densities for the reduction of oxygen on iron and oxidation of iron are labeled i0oxygen and i0Fe respectively. The resultant ECP and corrosion rate (icorr) are also indicated.
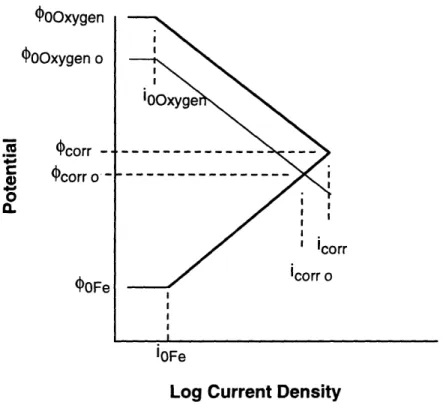
Figure 2.6 illustrates the effects of increasing the oxidizer's concentration in the solution. In this example oxygen is the oxidizer. Increasing the concentration of oxygen increases the equilibrium half-cell potential of the reduction reaction. The Nernst relation, equation 6, can be used to verify this phenomena. The result is an increase in ECP and corrosion rate.
(h-11- -- -- - --I
I I I I
4.' 0 4' *-O
o
C. OOxygen 0OOxygen o corr -. Ocorr o' -OFe iOFeLog Current Density
Figure 2.6. Polarization diagram for the same reaction illustrated in Figure 2.4. shown
with increased oxygen concentration.
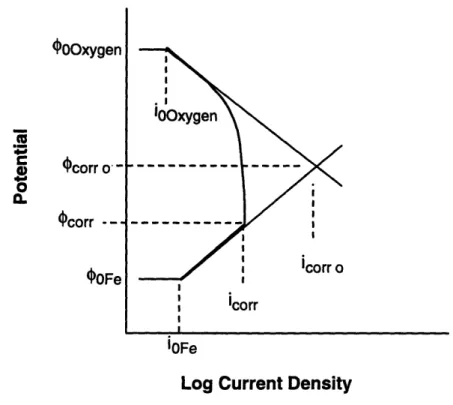
Figure 2.'7. illustrates the effects of transport control on the ECP and corrosion rate. Transport of oxidizer, oxygen in this example, can be reduced by reducing the mixing of the solution, e.g., lowering the system's Reynolds number, etc. The result is a
decrease in ECP and corrosion rate. I I I I I
OOxygen -C ILam4.. corr o -4corr -OOFe .I o1 0xygen Icorr iOFe
Log Current Density
Figure 2.7. Polarization diagram for the same reaction illustrated in Figure 2.4. shown
with added transport control.
Some metals passivate when polarized anodically. The result is a decrease in corrosion rate with increasing ECP. As ECP is increased above the passive regime the corrosion rate begins to increase in what is known as the transpassive regime. Passivity
is illustrated in Figure 2.8.
I
I I I I I1. 0;0000;.. T
n--Passive
io
Log Current Density
Figure 2.8. Polarization diagram for a passivating metal.
Aluminum, nickel, titanium, and stainless steel are examples of common metals which have a natural ability to resist corrosion by passivating. Although these metals are relatively immune to general corrosion while operating in the passive regime, they can be susceptible to localized forms of corrosion including stress corrosion cracking (SCC) [ 1 ]. In fact, the presence of a passive or corrosion film on a metallic surface is required for a
material to be susceptible to SCC [5].
Noble metals such as platinum have an equilibrium half-cell potential for most aqueous environments higher than the equilibrium half-cell potential for the oxygen and hydrogen reactions in typical aqueous solutions. In these cases they do not corrode or form a corrosion film on their surface. For these reasons the exchange current densities for the oxygen and especially hydrogen reaction on platinum are high. In aqueous
4,
environments containing both dissolved 02 and H2, such as BWR recirculation and in-core water, the recombination of these two molecular species occurs readily on the surface of platinum. The polarization diagram for this reaction is illustrated in Figure 2.9. For environments with stoichiometric excess H2 over the 02 the ECP of the platinum electrode is the equilibrium half-cell potential for the hydrogen reaction which is fully predictable using the Nernst relation, equation 6. Platinum can be used as a reference electrode in nuclear power systems operating under HWC [6].
YV U: u a. bh, u, and d)b.. TV I-I -.-- T%;UlI recombination rate Log Current
Figure 2.9. Polarization diagram for the recombination of H2 and 02 on a platinum surface. H2 is in stoichiometric excess of 02. The exchange current density for the hydrogen reaction on platinum is higher than the recombination rate.
Methods for measuring electrode potentials (ECPs) have been described above. Although the procedure is relatively straightforward, ECP measurements in some environments can be non-trivial, e.g., the high temperature and radiation water environments in the in-core sections of a nuclear power reactor. The knowledge of the
A- __
I I I I
ECP of structural materials in the in-core sections is important. H2 gas is added to the feedwater of many BWR type nuclear reactors to suppress the ECP of the stainless steel components below -0.230V SHE. Below this potential intergranular SCC (IGSCC) and perhaps IASCC do not occur [7].
2.2. Stress Corrosion Cracking
Stress corrosion cracking (SCC) is the phenomena by which alloys fail by cracking when simultaneously stressed and exposed to certain environments. Failures occur at stress levels well below those which would cause failure in air. While application of the stress may be multi-axial, it is necessary for it to have a tensile component and cracking is usually in the plane perpendicular to it. SCC represents the most highly localized form of corrosion that is ever encountered.
SCC is a complicated phenomena. In order to gain some understanding of SCC, it is necessary to realize that three different disciplines are at work. These are physical
metallurgy, electrochemistry and fracture mechanics.
Metallurgical variables which can affect material susceptibility to SCC include both point and line defect concentrations and locations in the crystalline lattice, precipitates in heat treatable alloys, concentration and types of impurity elements which can be both metallic and nonmetallic in nature. Other factors such as surface finish, residual cold work and metallurgical history (what was done to the alloy in bringing the component to its present shape) can also be important.
Texture should be considered. Grain size is important; an alloy generally becomes more susceptible with increasing grain size. Grain shape is also significant. After a manufacturing process during which grain growth occurs in one direction more than another, susceptibility in one direction of a component may be greater than another.
Plastic deformation increases the density of dislocations and these may play an important role in crack propagation. For heat treatable alloys that suffer from SCC, susceptibility is usually increased with increased strength. Finally the path may be transgranular or intergranular. In some alloys it is predominantly one, in others mixed, in still others the cracking mode may depend on the environment or the level of stress. Observations of crack path provide information about mechanisms since they indicate the relative importance of such factors as stress, chemistry and alloy composition.
Electrochemical reactions occur on the metal surfaces and the rates at which they occur affects the susceptibly of an alloy to SCC. The most important parameter is the ECP of the specimen. Changes in ECP will always affect stress corrosion reactions. Conductivity, pH, 02 levels, solution composition and temperature are also important.
The manner in which the specimen is stressed may affect SCC susceptibility. A condition of plane strain, achieved when the specimen thickness is above a certain value which is related to its strength [8], may sometimes promote greater susceptibility than is observed in specimens below that thickness. The sharpness of cracks (notch root radius) is important. Blunt cracks can be expected to propagate less readily than sharp cracks. Crack or notch depth is important from the viewpoint of stress concentration. Loading mode is critical, being the relation between the directions of applied stress and the plane of cracking.
SCC is often described as a phenomena arising between an alloy and a specific environment. Failures of a-brass in aqueous ammonia, but not in sea water, is an often used example. Stainless steels fail in sea water, but not in aqueous ammonia. Table 2.2. lists some commonly observed types of failures. What needs to be explained is what property or action of a solution or corrodent is necessary to promote SCC. This will be attempted with a discussion of possible SCC mechanisms.
Table 2.2. Alloy/Environment Systems Exhibiting SCC [10].
Alloy Environment
Mild Steel Hot nitrate, hydroxide, and
carbonate/bicarbonate solutions High Strength Steels Aqueous electrolytes, particularly when
containing H2S
Austenitic Stainless Steels Hot chloride solutions, chloride contaminated steam
High Ni alloys high purity steam
a-brass aqueous ammonia
Al alloys aqueous Cl-, Br, and I- solutions
Titanium alloys Aqueous Cl-,Br, and I- solutions, organic liquids, N204
Mg alloys Aqueous C1-/CrO42- solutions
Zr alloys Aqueous Cl- solutions; organic liquids, I
@ 350°C
Most SCC service failures occur from the influence of residual stresses. These arise during component manufacture and plant assembly, including welding. In laboratory work the stress is usually applied externally since it is then much easier to control and measure. The oldest and simplest test is to measure how long a specimen takes to break, the time to failure, tf. Specimens are loaded in tension and surrounded by the solution or bent into a U-shape, clamped and then immersed. Typically, the value t varies as shown in Figure 2.10. Two observations are made. First, the tf changes less
markedly at stresses above a specified stress than below it. Secondly, it is not always
a- L-O E L._ Applied Stress
Figure 2.10. Relationships between time-to-failure and applied stress commonly
observed in SCC.
In examining all the metallurgical and electrochemical variables that together determine susceptibility, the measurement of tf is not altogether satisfactory since changes in tf can arise from two different reasons. Time to failure is made up of two
components, the time for the crack to initiate (ti) and the time for it to propagate (tp) so
that
ti+ t = tf. (8)
Whether the effect of a changed variable on tf arises from alterations to ti or tp may be of fundamental significance and it is therefore important under some circumstances to distinguish between the two. Engineering structures have numerous surface cracks and flaws arising from fabrication and assembly. If any of these is an incipient stress corrosion crack, ti becomes unimportant. For this reason crack propagation has received the most attention.
r-Considerations such as this lead to the use of pre-cracked notched specimens [8]. Testing with this type of specimen takes into account the stress intensity, K, arising from the presence of a crack and applied load. When these specimens are tested, time to failure as a function of stress intensity generally behaves as illustrated in Figure 2.11. The appearance of a threshold stress intensity (Klscc) is apparent. This value describes the stress intensity below which failure does not occur.
e-en
0
0
a) 1.0 (I) Klscc Time to Failure, tfFigure 2.11. Relationship between tf and initial value of stress intensity factor (K).
Since this test is mainly concerned with crack propagation, measuring crack velocity as a function of K is possible. Figure 2.12 shows the general relationship that exists between crack velocity and K. Three stages of cracking are observed. Stage I shows a logarithmic dependence of crack velocity on K. Stage II is sometimes called the plateau velocity and is generally interpreted as being caused by the chemical or electrochemical reaction at the crack tip being limited by diffusion of a critical reactant or product within the solution. This idea is supported by observations [9] that increasing the
solution viscosity lowers the plateau velocity. Stage III is rarely mainly due to mechanical reasons.
o I I O I I _V I , 11 , lII 7o ._ go 0 0 I6 o0 0 1..
observed and arises
L
Stress Intensity, K
Figure 2.12. General relationship between stress corrosion crack velocity and stress
intensity (K).
This type of experiment has been of considerable value. It has become possible to examine all the major variables, one at a time, for their effect on crack growth rate. As a result, it is possible to determine the effect of minute variations in composition, changes
in heat treatment, electrochemical variables and changes in the aqueous species.
In many of the alloy systems shown in Table 2.2. the stable configuration of the alloy surface is that it is filmed. The possible mechanisms by which SCC occurs are those reactions between unfilmed metals and the environment. Before considering these metal-environment mechanisms it is important to understand the method of film breakdown. Pitting is one method of film breakdown, but is not general to SCC systems. While pitting results in exposing unfilmed metal to an aggressive environment it is not
limited to stressed materials like SSC. A more general method of film breakdown is film rupture due to metal surface strain. A slip system intercepting the metal-environment surface under stress results in localized strain at that point of the surface. A large strain breaks the brittle film and exposes metal to the environment where SCC mechanisms can take place [11].
Many researchers agree that an important mechanism for SCC systems is the rate at which the newly exposed metal repassivates, or forms a protective film. If repassivation is prompt the environment has too little time for SCC mechanisms to operate and no cracking can occur. If repassivation occurs slowly, sufficient time will exist for the environment to interact with the exposed metal surface and a crack can extend until the metal eventually repassivates. If very much time passes between film rupture and repassivation too much of the reaction may occur which can result in crack tip blunting or pitting. The film rupture-repassivation sequence occurs repeatedly during SCC untii the component fails or conditions leading to SCC are removed, e.g., tensile
stress is relieved or the environment is made benign [ 12].
The many mechanisms proposed for stress corrosion crack extension can be divided into two classes: mechanisms in which cracking proceeds by anodic dissolution of the crack tip material, and mechanisms in which cracking proceeds by mechanical
methods [13]. Some proposed SCC models are as follows:
a) Crack propagation by the dissolution of bare metal due to film rupture provided by plastic strain or emerging dislocations at the crack tip. Since SCC takes place with material polarized anodically, corrosion of the exposed crack tip metal is easily conceived. The possible preferential corrosion of dislocations piled up at the crack tips as a result of plastic strain is also considered important. Minute compositional changes in a metal lattice occurring around dislocation pile-ups and
grain boundaries may cause significant directional differences in dissolution on an
atomistic scale [10].
b) Crack propagation by the adsorption of surface active species at the crack tip which lowers chemical bonds and thus the surface energy. This mechanism supposes that the reaction between a species in the environment and the metal atoms at the crack tip can cause a redistribution of electrons in the orbits of the atoms so that the bond between them is weakened. The result is a reduction in surface energy which increases the propensity towards cracking under a tensile
load [4].
c) Fracture of corrosion product films at the crack tip followed by their subsequent reformation.
d) Combinations of the above.
To minimize the incidence of occurrence of such a widespread type of failure, it is clearly important to know how to avoid SCC. The choices are simple, modifications to the material, environment, or stress as required.
Figures 2.10 and 2.11. shows that reducing the stress can reduce the possibilities of SCC failure. In practice this means that components must be stress relieved following cold work, welding, or any process from which significant residual stresses result. Design can help reduce operating stress levels. There are examples of tanks being operated containing liquids that cause SCC with residual and operating stresses controlled so that KIscc is never exceeded [12]. These requirements are shown to affect both the design and plant engineer.
Modification of the environment, the use of inhibitors, or controlling the ECP of the metal out of the SCC operating range can reduce or even eliminate the tendency for
material failure by SCC. Removal of a damaging species in the environment, e.g., C1- for stainless steel components, significantly extends the component's lifetime. The use of inhibitors reduces the possibility of SCC. They can be dangerous, however, because if the ECP were to move back into the cracking range cracking can occur. Some inhibitors continue to work even when the ECP is in the cracking range, these inhibitors are commonly referred to as "safe" inhibitors. SCC failures can be eliminated by proper use of cathodic protection. Moving the ECP below the cracking range also lowers the corrosion rate. Care should be taken, however, to ensure that all components are protected and that the ECP is not allowed to return to the cracking region.
Thorough knowledge of a component's operating conditions, including stress state, temperature, and the aqueous environment it is to be operating in, is important in material selection. There exists large amounts of published data on alloy selection for various operating conditions. Care should be taken by the design engineer to ensure that
all conditions ar~ considered.
Stress corrosion cracking is a complicated subject. To appreciate the subtleties of this interaction requires both a metallurgical and electrochemical approach. To do accurate tests, potential control is necessary and the investigation of a range of potentials is always required. Commercial alloys are complicated. For example, they consist of impurity constituents that vary in concentration from one heat to another. These and other imperfections can cause cracking.
2.3. The Slow Strain Rate Technique
Most laboratory corrosion experiments try to collect significant amounts of data in short periods of time. This is often achieved by increasing the severity of the test. In SCC testing, environmental composition, temperature, or pressure can be altered to increase the aggressiveness of a test. The test specimen can be polarized galvanistatically
or potentiostatically to stimulate the electrochemical reactions on the surface of the specimen, or its cracking susceptibility can be altered by changing its structure or composition. The slow strain rate technique (SSRT) is an accelerated test in that it facilitates cracking in circumstances where in constant load or strain tests cracking is not observed. SSRT tests have the additional advantage that tests are not stopped until the specimen breaks, either by SCC or ductile mechanisms. Constant load or strain tests can vary in length. If no results are obtained the test is usually halted after a period of time that may be arbitrary. Variation of the stopping time from laboratory to laboratory results in significant scatter.
SSRT testing makes use of a smooth tensile specimen strained in relatively stiff frame machines. The specimens are surrounded by the environment of interest then loaded in tension at a constant slow strain rate until fracture. The choice of strain rate is critical. If the strain rate is too high, ductile fracture by void coalescence would occur before the necessary electrochemical reactions could take place to promote SCC. It is also possible for the strain rate to be too low. In this case one can envision a strain rate being slow enough that even slow repassivation occurs rapidly with respect to film rupture. With most systems strain rates between 10- 7to 10-5 s- 1are found to promote
SCC [14].
Some testing environments are too aggressive for many standard extensometers used for controlling specimen strain and strain rate. A reasonable alternative to constant strain rate is the constant extension rate technique (CERT) which makes use of a constant cross-head velocity. Cross-head displacement, and finally velocity, is measured by a linear variable differential transducer (LVDT) or extensometer at the loading machine cross-head. The cross-head displacement is the sum of extension of the testing machine and specimen. In the course of a CERT test the strain rate is not fixed. During elastic loading of the specimen the strain rate is constant. With the onset of plastic deformation


![Figure 2.17. Compositional profiles by dedicated STEM analysis across grain boundaries from a HP type 348 stainless steel irradiated to 3.4 x 10²¹ n/cm 2 [18].](https://thumb-eu.123doks.com/thumbv2/123doknet/14722521.570768/52.915.232.620.162.958/figure-compositional-profiles-dedicated-analysis-boundaries-stainless-irradiated.webp)
![Figure 2.18. Effect of neutron fluence on the strength of annealed type 304 stainless steel irradiated of 370°C [25].](https://thumb-eu.123doks.com/thumbv2/123doknet/14722521.570768/54.915.185.671.104.405/figure-effect-neutron-fluence-strength-annealed-stainless-irradiated.webp)

