Determination of Resistance Factor
for Tortuous Paths in Drip Emitters
The MIT Faculty has made this article openly available.
Please share
how this access benefits you. Your story matters.
Citation
Narain, Jaya, and Amos Winter. “Determination of Resistance
Factor for Tortuous Paths in Drip Emitters.” Volume 2B: 43rd Design
Automation Conference (August 6, 2017).
As Published
http://dx.doi.org/10.1115/DETC2017-67895
Publisher
ASME International
Version
Final published version
Citable link
http://hdl.handle.net/1721.1/120785
Terms of Use
Article is made available in accordance with the publisher's
policy and may be subject to US copyright law. Please refer to the
publisher's site for terms of use.
DETERMINATION OF RESISTANCE FACTOR FOR TORTUOUS PATHS IN DRIP
EMITTERS
Jaya Narain
Global Engineering and Research Lab Massachusetts Institute of Technology
Cambridge, MA 02139 Email: [email protected]
Amos Winter
Global Engineering and Research Lab Massachusetts Institute of Technology
Cambridge, MA 02139 Email: [email protected]
ABSTRACT
Drip irrigation has the potential to decrease water consumption and increase crop yields and profit. Globally, drip irrigation has had low adoption rates. There are several major barriers to adoption, including the cost of the system and its energy consumption. Mathematical models describing the behavior of drip emitters can provide insights on the performance of drip systems. The models and procedures developed in this paper can be used as a tool for the design of improved drip irrigation systems.
This paper presents a method of combining a CFD model that characterizes flow through the tortuous paths of emitters with an analytical model describing pressure-compensating behavior. The CFD model detailed in this paper was verified for three commercially available emitter designs. The model fell within acceptable variation bounds when compared to experimental data. The results of CFD analysis are represented in a resistance factor that can be used in a hybrid analytical-computational model. This method requires significantly less processing than using computational models alone.
Future work on this topic will detail an analytical model that accurately predicts the behavior of inline PC drip emitters of varying geometries and an optimization of the geometry to lower activation pressure and material costs. Analytical models to predict the flow behavior of a range of tortuous path designs given a prescribed geometry will also be developed.
NOMENCLATURE
P1 [Pa] Pressure above
membrane; input pressure from pipe
P2 [Pa] Pressure under
membrane; pressure at the end of the tortuous path
Kpath Constant scaling
parameter relating
P1 and P2 ; depends
on emitter geometry INTRODUCTION
Drip irrigation is a method of irrigation that delivers a steady, controlled flow of water directly to a plant’s roots. Drip irrigation is advantageous because it reduces water consumption and can increase crop yield. A study conducted in India showed water savings between 20-40% and increases in yield between 20-50% with drip irrigation compared to furrow irrigation, depending on the crop grown [1]. Drip irrigation can enable farmers to grow crops under conditions where they could not otherwise do so (e.g. with strict water constraints or in dry seasons), allow farmers to grow a wider array of crops, and save on labor and fertilizer costs [2].
Yet, despite its benefits, drip irrigation has very low adoption rates in India and other developing countries, with less than one percent of land in India cultivated using drip irrigation [2]. The high cost of drip irrigation systems is one of several major barriers to adoption. Drip irrigation systems require
Proceedings of the ASME 2017 International Design Engineering Technical Conferences and Computers and Information in Engineering Conference IDETC/CIE 2017 August 6-9, 2017, Cleveland, Ohio, USA
significant pumping power to operate. The power required depends on the minimum pressure required by the system and the flow rate through the system. In India, where electricity costs are heavily subsidized, energy costs are a particularly large burden for off-grid farmers, who must use costly diesel or solar systems [3]. Reducing the pressure required to operate a drip irrigation system can significantly lower costs for off-grid farmers by enabling them to use smaller pumps, fewer solar panels, and less diesel.
The income of small and mid-size farmers on-grid in India is directly affected by the poor reliability and limited supply of power for irrigation [3]. In the Middle East, municipal water facilities supply limited pressure water to farmers [4]. Low power drip systems will enable more use of drip systems among farmers with restricted energy access or water pressure constraints. There is a strong need for high-performance, low-power, low-cost drip irrigation systems.
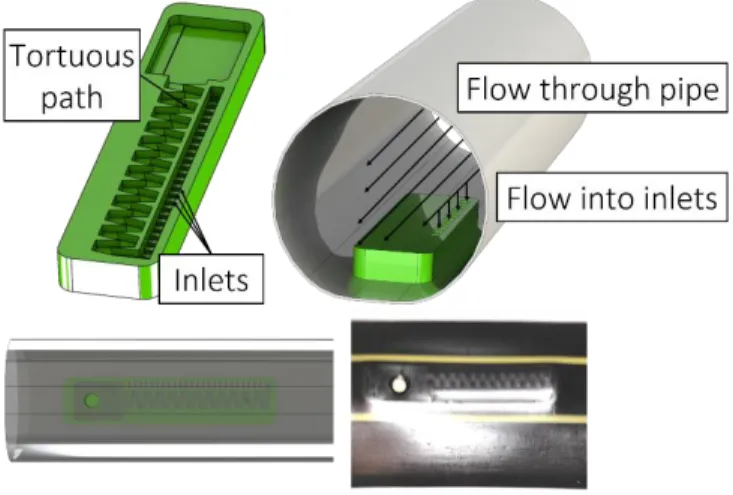
Drip irrigation delivers water via emitters embedded in a network of pipes. Emitters control the flow rate of water delivered to crops. This paper focuses on inline emitters, which are embedded inside pipes and sold as part of tubing (Figure 1). Online emitters are packaged and sold separately from piping and must be installed by the farmer. Because they do not require installation, inline emitters are generally more popular than online emitter types and account for a significant majority of drip emitter sales [5].
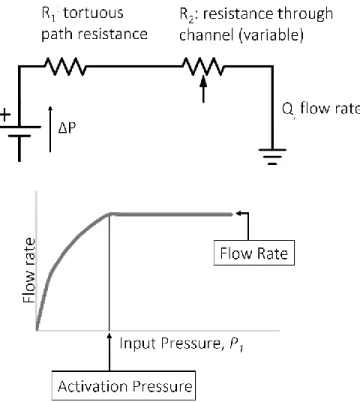
Emitters can be described as pressure compensating (PC) or non-pressure compensating (NPC). PC drip emitters (Figure 2) deliver a constant flow rate over a wide range of pressures (Figure 3). The activation pressure is defined as the pressure at which the flow-compensating behavior beings. The deflection of the flexible membrane and flow restriction produced by the membrane within PC online emitters that do not have tortuous
paths has been modeled analytically [6]. Lowering the activation pressure of drip emitters can significantly lower the power requirements of a drip irrigation system, reducing the energetic costs of drip irrigation.
Individual emitters are characterized by their activation pressure (for PC emitters) and flow rate, and emitter performance is characterized by the variation in flow rate compared to the manufacturer’s specification and the clogging likelihood PC drip emitters typically consist of a tortuous flow path and a flexible membrane that deforms to control the flow resistance. In PC drippers, the design of the tortuous path affects the activation pressure of the emitter and the flow rating of the emitter. NPC drip emitters typically consist solely of a tortuous flow path (Figure 1). In NPC drip emitters, the design of the tortuous path dictates the flow rate behavior as a function of pressure for the device [7].
Improving the performance of drip emitters could encourage greater adoption of the technology and is a topic of interest in both research and industry. Understanding the flow behavior through tortuous paths is key to designing improved emitter technologies. Palau-Salvador et. al. suggested computational fluid dynamics (CFD) analysis of tortuous paths as a powerful tool for emitter design [8]. Previous studies on tortuous path behavior have used CFD as a tool to analyze the effects of altering dentate geometry in flow paths [9] Wei, at. all used
Figure 1: NPC emitters consist of an array of inlets leading to a tortuous path. The pipe wall contains the flow within the tortuous path. The emitters are embedded in pipes during a heat-forming process which results in portions of the tube being pushed into the tortuous path.
Figure 2: Jain Turbo Cascade 2 L/hr inline drip emitter. Inline drippers are embedded in pipes during the manufacturing process. Water from the inlet flows to the start of the tortuous path, through the tortuous path, and into a rectangular chamber that has a small channel that provides passageway though circular lands. A silicone membrane rests on top of the rectangular chamber.
CFD to characterize the effect of rectangular, trapezoidal, and triangle labyrinth geometries [10].
This paper details a CFD model used to predict flow behavior through tortuous paths and a method for computing a flow resistance value for tortuous paths of varying geometry. This model can be easily coupled with analytical models to reduce the computational time required to optimize PC dripper behavior. The model accounts for effects of manufacturing processes, like sealing of emitters into pipes in a manner that alters flow path dimensions, on the flow behavior. The paper presents computed flow resistance values for three NPC drippers available commercially. The method described in the paper enables the rapid optimization of PC dripper designs to lower activation pressure. The model can also be used to lower the material costs of the emitter, including the volume of silicone and plastic in the emitter.
MODEL OVERVIEW
Flow behavior of water through tortuous flow paths was modeled using the ANSYS CFX 16.0 package. NPC emitters (Figure 1), which consist only of an inlet system and tortuous flow path, were used to verify the capability of the CFD model in producing accurate results. The model geometry consisted of
a single drip emitter, consisting of a tortuous flow path with dimensions equivalent to those of a Jain Turbo Excel Plus 0.75, 1.6, and 4 L/hr emitters.
In NPC drippers, the tubing itself provides part of the wall that bounds the flow through the tortuous path. An inflation layer was used in the mesh at the interfaces between the fluid and emitter walls and between the fluid and piping to accurately model the flow near the walls. An inflation layer is a fine, controlled mesh near a wall that can capture the large gradients in flow properties characteristic of boundary layers. The walls were modeled as smooth. A minimum element size on the faces of the fluid in contact with the dripper of 1.8*10-4 m was used to
ensure a mesh sufficiently fine to capture the flow behavior. A shear stress transport model (SST) was used for turbulence because flow separation and eddy formation in the flow path was expected.
A boundary condition of total pressure was set at the pipe inlet. Total pressure represents the pressure in the irrigation pipe before the flow enters the emitter, and was used as an independent variable. The inlet flow was defined as normal to the pipe inlet with medium turbulence. A boundary condition of average atmospheric static pressure was set at the dripper outlet. The dimensions in the model were based on Turbo Excel Plus NPC inline emitters currently manufactured and distributed by Jain Irrigation. In the manufacturing facility of Jain Irrigation, a polyethylene tubing is heat-formed around a moving line of inline emitters. The heat-forming process results in portions of the tubing pushed into the tortuous path, altering the flow path dimensions. This obstruction was modeled as a 1.5*10-4 m
reduction in the depth of the tortuous path based on measurements of 0.75, 1.2, and 4 L/hr NPC Turbo Excel Plus dripline currently sold by Jain Irrigation.
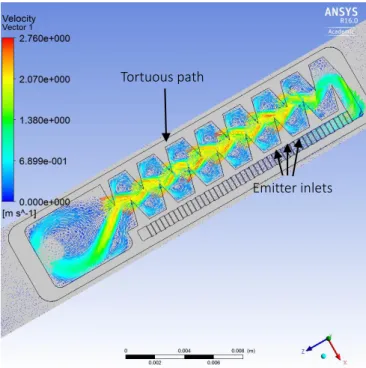
Figure 4 shows a visualization of the flow through the emitter as computed by the model. This visualization is consistent with images published by Jain Irrigation [11] and Wei [10] The bulk of the flow moves through the center of the flow path. Lower velocity recirculation zones are formed in the teeth of the labyrinth. Dependent on the flow velocity in the zone, recirculation zones may prevent sedimentation of particles that could clog the emitter or may increase clogging potential [10] MODEL FIDELITY
The CFD model was used to predict the pressure vs. flow rate behavior for three flow rates (0.8, 1.2, and 4 L/hr) of Turbo Excel Plus NPC emitter. The inline emitter flow rates were measured by flowing water of controlled pressure through 0.75 and 4 L/hr Turbo Excel Plus driplines, measuring the pressure in the pipe near the inlet of the dripper using a pressure gauge, and measuring the flow rate out of the dripline using a graduated cylinder and timer. Figure 5 compares the results of the CFD model to experimental results and tabulated values from the datasheet provided by Jain [11]. Figure 5 also reports the 95% confidence intervals for the experimental measurements, which ranged from 0.10 to 0.18 L/hr for the 4 L/hr emitter and from Figure 3: The flow rate through the emitter is a function of the
flow resistance through the emitter. As P1 increases, the
resistance through the channel R2 also increases, resulting in a
proportionally lower flow rate. This pressure-compensating mechanism leads to a constant flow rate at pressures higher than the activation pressure of the emitter.
0.03 to 0.08 L/hr for the 0.75 L/hr emitter. 1.6 L/hr emitters were not available for testing at the time of publication.
The coefficient of variation (cv) expresses the expected variation of flow rates among emitters of the same design due to manufacturing variations. The cv values for the tabulated datasheet values for each NPC emitter were estimated using experimental data published by the Irrigation Training and Research Center for an array of micro-irrigation devices of different flow rates and manufacturers [12]. Based on this data, the cv for the 4 lph dripper was approximated as 18% and the cv for the 0.75 lph dripper was approximated as 5%. The flow rate behavior as a function of pressure predicted by the CFD model (Figure 5) generally lied within the estimated cv range of the datasheet values and the uncertainty range of the experimental data, validating the CFD model predictions.
DISCUSSION
Because the CFD model of flow through a tortuous path is accurate when compared to experimental results, simulation data from the model can be used accurately in a hybrid model of the emitter as a whole. The information contained in the CFD model on the dependence of flow behavior on path geometry can be represented in a constant scaling parameter, Kpath. The pressure
at the end of the tortuous path, P2, is related to the input pressure,
P1, by Kpath, which that depends on the geometry of the path.
𝑃2= 𝑃1
𝐾𝑝𝑎𝑡ℎ [1]
Figure 5: Flow rate behavior as a function of pressure as predicted by the CFD model, datasheet values published by Jain, and experimental data collected by the research team.
Figure 4: Velocity vectors along flow through an NPC drip emitters computed using ANSYS CFX. Flow enters the emitter through a row of rectangular inlets that lead directly to the tortuous path.
Tortuous path
This expression describes the effect of the tortuous path on the flow independent of the flow rate of fluid through the path, a parameter that is difficult to compute or measure. For a PC emitter, this expression is a simplification because it assumes a nonvariable resistance R2 after the tortuous path (Figure 3).
Because R1 is generally greater than R2, this simplification can
be used to reasonably approximate Kpath. The overall fidelity of
the model and a discussion of its assumptions and limitations will be discussed in later work.
The hybrid model will be used to predict the behavior of PC drip emitters (Figure 2). The model geometry in the CFD simulation was modified to match those of PC Turbo Cascade 1.1 L/hr, 2 L/hr, and 3.8 L/hr emitters. A virtual sensor was placed at the end of the tortuous path to measure the pressure of the fluid at the end of the path, immediately before entering the chamber under the membrane. The simulation was run for sixteen distinct values of P1, ranging from 0.1 to 1.6 bar, for each
emitter geometry. The calculated scaling parameters with standard deviation for each emitter geometry are summarized in Table 1
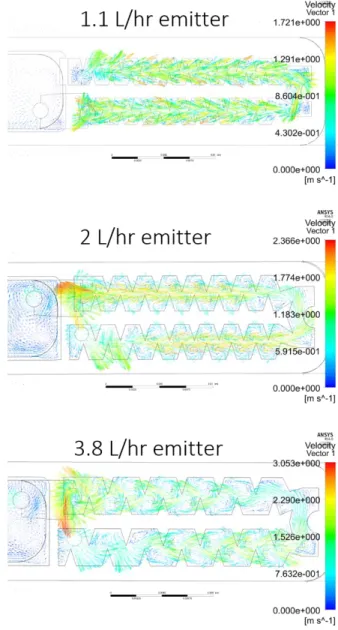
The standard deviations on the scaling parameters were exceptionally small, signifying that the calculated value of the scaling factor is precise. The scaling factor for the 3.8 L/hr was the lowest. This means that the pressure drop in the tortuous path in the 3.8 L/hr emitter is less than the pressure drop in the paths for the 2 and 1.1 L/hr emitters. This result was expected because the path in the 3.8 L/hr emitter is wider and has fewer turns than the paths in other emitters (Figure 6). Despite differences in path geometry, the scaling factor for the 2 and 1.1 L/hr emitters were identical. It is hypothesized that this similarity is due to differences in recirculation between the two emitters. The 2 L/hr emitter has a wider flow path and flower turns than the 1.1 L/hr emitter. However, the 1.1 L/hr emitter has significantly less recirculating flow than the 2 and 3.8 L/hr emitters. The relatively small portion of recirculating flow in the 1.1 L/hr emitter may contribute to a smaller scaling factor for the emitter than would otherwise be expected.
Because the standard deviation between measurements is so small, the scaling factor can be reliable determined by simulating the flow at only one input pressure. Traditionally, the flow behavior through a tortuous path is characterized by fitting complex polynomial or exponential functions to a curve of flow rate as a function of pressure [13], [14]. Generating the
high-resolution model predictions for a given path geometry presented in Figures 3 and 5 took 5 – 7 hours using five 2.4 GHz Intel Xeon Processor cores in parallel. Simulating flow at only one input pressure took approximately ten minutes. The process described in this paper significantly reduces computational time by requiring simulation at only one input pressure, instead of at the full range of pressures required to generate a curve.
The scaling parameter can be used in a hybrid computational-analytical model to fully describe the behavior of the emitter through a range of input pressures. Changing the scaling parameter in the hybrid model essentially changes the
Emitter Average Scaling Factor Standard Deviation 3.8 L/hr 2.330 0.00040 2 L/hr 2.772 0.0039 1.1 L/hr 2.772 0.0011
Table 1: Summary of average scaling factors, Kpath, with
standard deviations calculated using CFD simulation results for three PC inline emitter path geometries
Figure 6: Flow visualizations generated using ANSYS for flow through tortuous paths in Turbo Cascade 1.1, 2, and 3.8 L/hr inline drip emitters. Despite having smaller dimensions, the path in the 1.1 L/hr emitter causes the same pressure drop as the path in the 2 L/hr emitter. This may be due to differences in recirculation.
geometry of the tortuous path of the emitter being analyzed. Using the scaling parameter enables modeling the effects of a wide array of tortuous path designs on overall emitter behavior, without requiring a simulation for each unique path.
CONCLUSION
CFD is a powerful but computationally intensive method of modeling flow through tortuous paths. This long processing time makes it difficult to rapidly iterate through designs of drip emitters with tortuous path geometries, which would require generating hundreds of such curves.
Using a flow resistance parameter supplied by the CFD model in combination with analytical models for pressure-compensation could significantly improve both the accuracy and computational time required to model the behavior inline drip emitters.
Future work on this topic will describe a hybrid computational-analytical model that fully predicts the behavior of an inline PC drip emitter, based on the geometry of the emitter. Future work should include a broad model to predict the analytically predict the flow behavior through a variety of path geometries.
ACKNOWLEDGMENTS
The authors would like to acknowledge Jain Irrigation, Ltd. and the National Science Foundation Graduate Research Fellowship Program for their support of this project. The authors would like to thank Abhijit Joshi and Sachin Patel of Jain Irrigation for their advice and expertise on drip irrigation and Susan Amrose for her help preparing this publication.
REFERENCES
[1] 1998. “Sourcebook of Alternative Technologies for Freshwater Augmentation in Some Countries in Asia”. United Nations Environment Programme.
[2] Phansalkar, Sanjiv and Shilp Verma, 2008. “Silver Bullets for the Poor: Off the Business Park”. IWMI-Tata Water Policy Program.
[3] Energy Sector Unit of the South Asia Regional Office, 2001. “India Power Supply to Agriculture”. Report No. 22171-IN. Document of the World Bank.
[4] 2016. “Improving Water Security and Climate Resilience in Morocco.” United States Agency for International Development. https://www.usaid.gov/morocco/fact- sheets/improving-water-security-and-climate-resilience-morocco
[5] Private correspondence with Jain Irrigation, Inc., in Jalgao, India. 2016.
[6] Taylor, K., Shamshery, P., Wang, R., and Winter, A., 2015. “A Mathematical Model for Pressure Compensating Emitters”.
Proceedings of the 2015 International Design and Engineering Technical Conference. Boston, MA.
[7] Glaad, Y. K, 1974. “Hydraulic and Mechanical Properties of Drippers”. Proceedings of the Second International Drip
Irrigation Congress. University of California, Riverside, CA.
[8] Palau-Salvador, G., Arviza-Valverde, J., Bralts, V.F., 2004. “Hydraulic Flow Behavior Through an In-line Emitter Labyrinth using CFD Techniques”. Paper No. 912155. ASAE. St. Joseph, MH.
[9] Dazhuang, Y., Peiling, Y., Shumei, R., Yunkai, L., and Tingwu, X., 2007. “Numerical Study on Flow Property in Dentate Path of Drip Emitters.” New Zealand Journal of Agriculture Research, pp. 705-712.
[10] Wei, Q., Shi, Y., Dong, W., Lu, G., Huang, S. “Study on Hydraulic Performance of Drip Emitter by Computational Fluid Dynamics”. Agricultural Water Management, (84), pp. 130-136. [11] “Turbo Excel Datasheet”, 2016. Jain Irrigation Systems, Ltd, http://www.jains.com/irrigation/emitting%20pipe/jain %20turbo %20excel.htm .
[12] Low-Pressure Testing: Micro-Irrigation Emitters. Irrigation Training & Research Center. August 2013. Report No. R 13-004.
[13] W. Wang, V. Bralts and J. Wang, "A Hydraulic Analysis of an Online Pressure Compensating Emitter Using CFD-CSD Technology," in ASABE Annual International Meeting, Dallas, TX, 2012.
[14] L. Yongxin, L. Guangyong, Q. Xiangyu, W. Jiandong and M. Alam, "Computational Fluid Dynamics Analysis and Verification of Hydraulic Performance in Drip Irrigation Emitters," in Irrigation Association International