A detailed combined experimental and theoretical
study on dimethyl ether/propane blended oxidation
The MIT Faculty has made this article openly available.
Please share
how this access benefits you. Your story matters.
Citation
Dames, Enoch E. et al. “A Detailed Combined Experimental and
Theoretical Study on Dimethyl Ether/propane Blended Oxidation.”
Combustion and Flame 168 (June 2016): 310–330 © 2016 The
Combustion Institute
As Published
http://dx.doi.org/10.1016/j.combustflame.2016.02.021
Publisher
Elsevier
Version
Author's final manuscript
Citable link
http://hdl.handle.net/1721.1/115092
Terms of Use
Creative Commons Attribution-NonCommercial-NoDerivs License
Validated Kinetic Model for the Oxidation of Dimethyl Ether/Propane Blends: Rapid Compression Machine Experiments and Pressure-Dependent Rate Calculations
Enoch E. Damesa, Andrew S. Rosena, Bryan W. Weberb, Connie W. Gaoa, Chih-Jen Sungb, William H. Greena*
aDepartment of Chemical Engineering, Massachusetts Institute of Technology, Cambridge, MA,
USA
bDepartment of Mechanical Engineering, University of Connecticut, Storrs, CT, USA
Abstract: In this work, a binary fuel model for dimethyl ether (DME) and propane is developed, with a focus on engine-relevant conditions (10–50 atm and 550–2000 K). New rapid compression machine (RCM) data are obtained for the purpose of further validating the binary fuel model, identifying reactions important to low temperature propane and DME oxidation, and understanding the ignition-promoting effect of DME on propane. It is found that the simulated RCM data for DME/propane mixtures is very sensitive to the rates of C3H8 + OH, which acts as a radical sink relative to DME oxidation, especially at high relative DME concentrations. New rate evaluations are conducted for the reactions of C3H8 + OH = products as well as the self-reaction of methoxymethyl peroxy (in competition with RO2 = QOOH isomerization) of 2CH3OCH2O2 =
products. Accurate phenomenological rate constants, 𝑘(𝑇, 𝑃), are computed by RRKM/ME
methods (with energies obtained at the CCSD(T)-F12a/cc-pVTZ-F12 level of theory) for several radical intermediates relevant to DME. The model developed in this work (120 species and 700 reactions) performs well against the experimental targets tested here and is suitable for use over wide range of conditions. In addition, the reaction mechanism generator software, RMG, is used to explore cross-reactions between propane and DME radical intermediates. These cross-reactions did not have a significant effect on simulations of the conditions modeled in this work, suggesting that kinetic models for high- and low-reactivity binary fuel mixtures may be assembled from addition of their corresponding submodels and a small molecule foundation model.
Keywords: dimethyl ether, propane, binary fuel blends, kinetic model, rapid compression
machine, low temperature combustion
*Corresponding author: William H. Green, [email protected]
Commented [AR1]: We can only have a maximum of 6
keywords. Jackie added in “binary fuel blends” so we need to figure out which one to remove. Maybe low T combustion? Not sure.
Introduction
Dimethyl ether (DME, CH3OCH3) is widely known to be a good transportation fuel, in part because it can act as a drop-in replacement for diesel while reducing soot, carbon monoxide (CO), and unburned hydrocarbon emissions [1]. As a fuel additive to conventional fossil fuel in internal combustion engines, DME has the potential to greatly reduce particulate (soot) formation [2]. Fuel additives have been studied for their potential to control ignition timing of homogeneous-charge compression-ignition (HCCI) engines, stratified-charge compression-ignition (SCCI) engines, and reactivity-controlled compression-ignition (RCCI). In combination with intelligent fuel mixture and composition design, these advanced engines offer the prospect of cleaner burning and higher thermal efficiencies [3][4][5][6]. Many of these future engines may rely on dual fuel systems or those with adjustable concentrations of fuel additives that advance combustion [7]. However, these same engines will also rely more heavily on fundamental knowledge of the underlying combustion chemistry that drives the low temperature autoignition of fuel mixtures with both high- and low-reactivity components.
The promoting effect of DME on fuels such as methane (CH4) under conditions of both low and high temperature combustion has been studied in some detail [8][9]. Under high temperature regimes, the rapid build-up of radicals formed from DME promotes methane ignition, as noted by Chen et al. [8]. Although there is a nonlinear ignition enhancement, the laminar flame speeds of DME/methane mixtures are linearly proportional to the DME fraction [8]. The ignition promoting effect of DME on high-octane fuels is of particular importance for controlling ignition timing in internal combustion engines. Fundamental kinetic studies of fuel blends and quantification of ignition enhancement may therefore be useful in modeling, optimizing, and ultimately developing more advanced and cleaner combustion engines.
Dual-fuel combustion embodies a conceptually novel approach to internal combustion engine technology, relying on mixtures of high-octane fuels and high-cetane fuels as well as their synergistic combustion characteristics in order to achieve high thermal efficiencies. These engines can be made from retrofitted diesel engines with modified intake manifolds to allow for high reactivity vapor fuel mixing into the engine piston. For example, recent work [4] has identified a mixture of 20% DME with 30% propane (by mass) in concert with diesel fuel combustion, resulting in over 50% brake thermal efficiency (BTE) in a modified rail diesel engine, compared
to a baseline BTE of 37%. The authors found that propane substitution delayed DME’s early autoignition and shifted the combustion process closer to top dead center and that autoignition of the fumigated fuels led to the diesel fuel igniting much earlier compared to the baseline diesel condition due to an increase in the bulk cylinder temperature [4]. In addition, DME has been investigated as an additive for ignition control in HCCI engines [1][7]. The combustion kinetics of fuel blends has also received wide attention in efforts to understand the oxidation and pyrolysis of primary reference fuels [10]. As a result, studies of DME combustion abound in the literature. Recent work (see Table 1) includes studies of premixed and non-premixed flames, homogeneous ignition experiments, and studies in homogeneous flow reactors.
The uncertainties in low temperature (400–900 K) DME oxidation kinetics primarily involve the first and second O2 additions (typically denoted R + O2 = RO2 and QOOH + O2 = O2QOOH, respectively) to radical derivatives of DME as well as the fate of ketohydroperoxide, HO2CH2OCHO (hydroperoxymethylformate), all of which can serve to generate OH radicals, thereby promoting heat release and ignition. Tomlin et al. [11] have clearly illustrated the need for further work in this area by pointing out that several literature models such as [12][13][14] fail to accurately reproduce earlier rapid compression machine (RCM) ignition delay time measurements of DME [15]. In particular, Tomlin et al. [11] highlight the need for accurate pressure dependent descriptions for both first and second O2 additions to DME radical derivatives, and subsequent OH forming pathways. Thus, a number of more recent studies have been published that include detailed rate theory calculations for these reactions. Notably, Eskola et al. [16]performed a combined theoretical and experimental study for both first and second O2 additions. The subsequent corresponding CH3OCH2O2 (RO2) = CH2OCH2OOH (QOOH) isomerization step is determined to be faster than those used in previous models [17][18], suggesting that the O2 addition to QOOH may play a more important role than previously thought [16]. The rate theory calculations performed by Eskola et al. [16] resulted in a total of nine phenomenological rates, including four well-skipping reactions. The rate of the RO2 = QOOH isomerization is near its high-pressure limit at 1 bar, while the rate of the important QOOH decomposition to 2CH2O + OH is at its high-pressure limit at 10 bar. Rodriguez et al. [19] also recently calculated high-pressure limit rates on a G4 potential energy surface for the reactions CH3OCH2O2 = CH2OCH2OOH and CH3OCH2O2 = CH3OCHO + OH. The same authors conducted atmospheric-pressure jet-stirred reactor (JSR) experiments for varying equivalence ratios, measuring a number of intermediate and
product species profiles using gas chromatography and cavity ring-down spectroscopy. Rodriguez et al. [19]noted that the use of both the DME models of Zhao et al. [20] and Burke et al. [9] overestimate the DME reactivity in the low-temperature region. Thus, Rodriguez et al. [19] assembled a new model which satisfactorily reproduces their measured species profiles in addition to a number of higher-pressure experiments, including other JSR data at 10 atm [21], plug flow reactor (PFR) data at 12.5 atm [18], and shock tube data ranging from 12 bar to 40 bar [9,22,23]. Finally, Burke et al. [9]computed pressure-dependent rates for the unimolecular decomposition of CH3OCH2, by performing Quantum-Rice-Ramsperger-Kassel (QRRK) calculations with a modified strong-collisional model for energy transfer, and energies obtained at the CBS-QB3 level of theory.
Propane (C3H8) has also been studied extensively, and its combustion had been reviewed in several studies, including those by Simmie [24] and Westbrook and Dryer [25]. Thus, only select previous works are noted briefly, which are relevant to this work. Of particular interest to this work is the study by Gallagher et al. [26], who measured pure propane overall ignition delay times in a rapid compression machine for variable equivalence ratio. In addition, the low temperature chain branching pathways (involving the first and second O2 additions) have been studied using high-level electronic structure and rate theory methods by Goldsmith et al. [27]. Although not tested against global experimental measurements (e.g., ignition delay times) in a detailed kinetic model, individually computed rates were compared with those available in the literature. More recently, Merchant et al. [28] conducted a study on the first stage ignition of propane, using the elementary rates computed by Goldsmith et al. [27]. With a focus on deriving simple analytical solutions that can reliably predict first-stage ignition delay time, Merchant et al. [28] discussed in depth the roles of both OH and HO2 radicals on the low-temperature autoignition behavior of propane.
Fundamental combustion studies on DME/hydrocarbon mixtures have also been recently performed, albeit to a lesser extent than for each individual component. Hu et al. [29] have studied DME/propane autoignition at engine-relevant pressures (20 bar) by measuring ignition delay times behind reflected shock waves at high temperatures (1100–1500 K). Burke et al. [9] performed a combined experimental and modeling study of DME/CH4 mixtures between 600–1600 K and 7– 41 atm for varying fuel equivalence ratios. The authors performed rate theory calculations to elucidate the pressure dependent nature of the unimolecular decomposition of the CH3OCH2 radical, finding that this chemistry, in addition to pressure dependent low temperature DME
chemistry adopted from Yamada et al. [30], resulted in improvements in model agreement with various experimental data compared to modeling with only pressure independent expressions. Burke et al. [9] also pointed out the strong promoting effect small amounts of DME can have on overall ignition delays of 20:80 blends (by mole) of DME:CH4 [30]. This promoting effect is attributed to the overall weaker C–H bonds of DME compared to that of methane.
Although reactions between dual fuel derivatives/intermediates may exist under engine conditions, no current model incorporating both DME and propane reaction kinetics includes these fuel intermediate reactions. Most models of fuel blends do not contain any direct cross-reactions between the first intermediate radicals produced during oxidation/pyrolysis, although some exceptions do exist. In a model of gasoline surrogate components, Mehl et al. [10] added cross-reactions of alkyl and alkyl-peroxy radicals to account for interactions of various fuel components in the mixture, although their importance in determining various combustion characteristics was not discussed.
Thus, the first objective of this work is to investigate the capability of the Reaction Mechanism Generator (RMG) [31] to identify any reactions important to blended fuel combustion chemistry that do not exist in a pre-constructed base model from a simple concatenation of existing DME and propane mechanisms. Use of RMG in this manner can be especially valuable in the context of dual- or multi-component fuel mixtures given that many potentially important cross-reactions between fuel components may be readily missed or overlooked during manual (i.e., human) mechanism construction. The second objective of this work is to collect new experimental data in a rapid compression machine for the autoignition of binary DME/propane mixtures under engine-relevant conditions (a pressure of 30 bar and temperatures of 600–900 K). The third objective of this study is to conduct rate calculations and critical evaluations for several reactions important to the autoignition of DME and propane. These improved rate calculations are used to assemble a comprehensive model for the combustion of binary DME/propane mixtures under engine-relevant conditions (initial pressures of 1–60 bar and initial temperatures of 300–1500 K). This model is validated by comparison to a wide range of experimental targets, including literature data and the new data for DME/propane binary mixtures collected in this study. Finally, we investigate the non-linear promoting effect of DME on propane autoignition.
Table 1. Recent experimental studies of DME combustion with their corresponding experimental conditions, including temperature, pressure, equivalence ratio (𝝓), diluent, and residence time (𝒕𝐫𝐞𝐬). Adapted from Rodriguez et al. [19].
Type of Experiment
Experimental Conditions Reference
Jet-stirred reactor 𝑇 = 800–1300 K; 𝑃 = 101–1013 kPa; 𝜙 = 0.2–2 in N2; 𝑡res= 0.1–1 s Dagaut et al. 1996 [32]* 𝑇 = 550–1100 K; 𝑃 = 1013 kPa; 𝜙 = 0.2–1.0 in N2; 𝑡res = 1 s Dagaut et al. 1998 [21]*
𝑇 = 540–850 K; 𝑃 = 101 kPa; 𝜙 = 0.5–2 in N2; 𝑡res = 1.5 s Le Tan et al. 2015 [33] 𝑇 = 550–1100 K; 𝑃 = 107 kPa; 𝜙 = 0.25–2 in He, 𝑡res = 2 s Rodriguez et al.
2015 [19]*†
Plug flow reactor 𝑇 = 600–1500 K; 𝑃 = 101 kPa; 𝜙 = 0.01–∞ in air Alzueta et al. 1999 [34] 𝑇 = 1080–1086 K; 𝑃 = 101 kPa; 𝜙 = 0.5 in N2; 𝑡res = 0.1 s Fischer et al. 2000 [17]
𝑇 = 550–855 K; 𝑃 = 1216–1825 kPa; 𝜙 = 0.7–4.2 in N2; 𝑡res = 1.8 s Curran et al. 2000 [18]
𝑇 = 513–973 K; 𝑃 = 101 kPa; 340 ppm in 10% O2; 𝑡res = 2–4 s Liu et al. 2001 [35] 𝑇 = 490–750 K; 𝑃 = 101 kPa; 𝜙 = 0.6 in He; 𝑡res = 107 s Guo et al. 2013 [36] 𝑇 = 500–1200 K; 𝑃 = 101 kPa; 𝜙 = 0.8–1.2 in Ar Herrmann et al. 2013, 2014
[37][38]
𝑇 = 739–902 K; 𝑃 = 200–400 kPa; 𝜙 = 0.225–0.675 in N2 Schönborn et al. 2014 [39]
𝑇 = 555–585 K; 𝑃 = 101 kPa; 𝜙 = 0.835 in air Wada et al. 2013 [40] 𝑇 = 500–1150 K; 𝑃 = 101 kPa; 𝜙 = 0.2–1.6 in He/Ar; 𝑡res = 0.19–2 s Kurimoto et al. 2015 [41]
𝑇 = 500–1150 K; 𝑃 = 101 kPa; 𝜙 = 1 in Ar; 𝑡res = 1.5 s Wang et al. 2015 [42]
Shock tube 𝑇 = 650–1300 K; 𝑃 = 1317–4053 kPa; 𝜙 = 1 in air Pfahl et al. 1996 [22]* 𝑇 = 1200–1600 K; 𝑃 = 350 kPa; 𝜙 = 0.5–2 in Ar Dagaut et al. 1998 [21]* 𝑇 = 1175–1900 K; 𝑃 = 161–666 kPa; 𝜙 = 0.5–3 in Ar Cook et al. 2009 [43]* 𝑇 = 1134–2015 K; 𝑃 = 101–1010 kPa; 𝜙 = 1 in Ar Tang et al. 2012 [44]* 𝑇 = 1100–1500 K; 𝑃 = 2000 kPa; 𝜙 = 0.5–2 in Ar Hu et al. 2013 [29]† 𝑇 = 1200–1600 K; 𝑃 = 120–530 kPa; 𝜙 = 1 in Ar Hu et al. 2013 [29] 𝑇 = 697–1239 K; 𝑃 = 2200–2300 kPa; 𝜙 = 0.5–1.5 in air/N2 Li et al. 2013 [23]†
𝑇 = 1300–1600 K; 𝑃 = 152 kPa; 0.5–2% DME in Ar Pyun et al. 2013 [45]* 𝑇 = 900–1700 K; 𝑃 = 122–1013 kPa; 𝜙 = 0.5–2 in H2/Ar Pan et al. 2014 [46]*
𝑇 = 400–1160 K; 𝑃 = 1111–3030 kPa; 𝜙 = 0.3–2 in air Burke et al. 2015 [9]* 𝑇 = 1000–1600 K; 𝑃 = 122–2030 kPa; 𝜙 = 0.5–2 in Ar Pan et al. 2015 [47] RCM 𝑇 = 615–735 K; 𝑃 = 1010–2010 kPa; 𝜙 = 0.43–1.5 in N2 Mittal et al. 2008 [15]*†
𝑇 = 630–1250 K; 𝑃 = 1111–3030 kPa; 𝜙 = 0.3–2 in air Burke et al. 2015 [9]* Burner premixed flame; 𝑃 = 4 kPa; 𝜙 = 0.98–1.2 in Ar Mcilroy et al. 2000 [48]
premixed flame; 𝑃 = 101 kPa; 𝜙 = 0.67–1.49 in air Kaiser et al. 2000 [49] premixed flame; 𝑃 = 2.67–4 kPa; 𝜙 = 1.2–1.68 in Ar Cool et al. 2007 [50] premixed flame; 𝑃 = 4 kPa; 𝜙 = 0.5–2 in Ar Wang et al. 2008 [51] premixed flame; P = 4 kPa; 𝜙 = 1 in Ar Xu et al. 2011 [52] premixed flame; P = 5 kPa; 𝜙 = 1.63 in Ar/CO2 Liu et al. 2013 [12]*
Single jet-wall stagnation flame; T = 298 K; P = 101 kPa; 𝜙 = 0.7– 1.7 in air
Zhao et al. 2008 [20]
Counterflow flame; T = 298 K; P = 101 kPa; 𝜙 = 0.7–1.7 in air Wang et al. 2009 [53] Spherical bomb 𝑇 = 295 K; 𝑃 = 100 kPa; 𝜙 = 0.7–1.7 in air Daly et al. 2001 [54]
𝑇 = 298 K; 𝑃 = 200–1000 kPa; 𝜙 = 0.6–1.7 in air Qin and Ju 2005 [55] 𝑇 = 298 K; 𝑃 = 80–150 kPa; 𝜙 = 0.7–1.8 in air Huang et al. 2007 [56] 𝑇 = 293 K; 𝑃 = 97 kPa; 𝜙 = 0.7–1.8 in air Chen et al. 2009 [57] 𝑇 = 298 K; 𝑃 = 100–1000 kPa; 𝜙 = 0.7–1.6 in air De Vries et al. 2011 [58] *See the Supplementary Material for comparisons with the model of the present work.
†See main text for comparisons with the model of the present work.
Experimental methods
The present experiments are conducted in a heated RCM at the University of Connecticut. The specifications of this RCM have been detailed in [59]. Briefly, the RCM is a single-piston, pneumatically-driven, hydraulically-stopped arrangement with compression times near 30 ms. The end of compression (EOC) temperature and pressure conditions, 𝑇𝐶 and 𝑃𝐶 respectively, are independently changed by varying the compression ratio, initial pressure, and initial temperature of the experiments. The piston in the reaction chamber is machined with specially designed crevices to suppress the roll-up vortex effect and promote homogenous conditions during and after compression [60].
The primary diagnostic on the RCM is the in-cylinder pressure, measured by a Kistler 6125C transducer coupled to a Kistler 5010B charge amplifier. The voltage from the charge amplifier is recorded by a National Instruments 9215 analog input device connected to a cDAQ 9178 chassis. The voltage is sampled at a rate of 100 kHz by a LabView VI and processed by a Python package called UConnRCMPy developed as part of this work; version 1.0.6 of UConnRCMPy was used in this study. The code for the data processing package is available on GitHub at https://github.com/bryanwweber/UConnRCMPy.
The compression stroke of the RCM brings the homogenous fuel/oxidizer mixture to the EOC conditions, and for suitable values of 𝑇𝐶 and 𝑃𝐶, the mixture will ignite after some delay. For some combinations of mixture/pressure/temperature conditions, the ignition undergoes two stages. In these cases, the first-stage ignition delay (𝜏1) is defined as the time from the EOC (𝑡 = 0) until the first peak in the time derivative of the pressure trace while the overall ignition delay (𝜏) is defined as the time from the EOC until the global maximum of the time derivative of the pressure trace, as shown in Figure 1. Cases undergoing single-stage ignition have their ignition delay defined the same as the overall ignition delay.
Each experimental condition is repeated at least five times to ensure repeatability of the data. As there is some random scatter present in the data, the standard deviation (𝜎) of the ignition delays computed from the runs at a particular condition is computed. In all cases, 𝜎 is less than 10% of the mean value of the ignition delay. Vertical error bars shown on plots of ignition delay measured in this study represent twice the standard deviation of the experiments at a given
condition; if no error bars are shown for data measured in this study, the error bars are approximately the same vertical dimension as the data point.
0 10 20 30 40 50 -20 0 20 40 60 Pressure (bar) dP/dt (bar ms-1[*10]) P res s u re ( b ar ) T ime D e ri v at ive o f P re s su re (bar m s -1[* 10]) Time (ms) 1 EOC 0 10 20 30 40 50 -30 -20 -10 0 10 20 30 40 50 Pressure (bar) dP/dt (bar ms-1*10) Heat Release Rate (MW m-3*10) Non-Reactive Pressure (bar) P ress u re ( b ar ) T ime D e ri v at ive o f P res s u re ( b ar ms -1[* 10]) V o lu m e tr ic H ea t R el ea se R ate (M W m -3[* 1 0] ) Time (ms) 1, 1,HRR EOC (a) (b)
Figure 1. Definitions of ignition delays, 𝝉𝟏 and 𝝉, in the RCM experiments and simulations. The
conditions shown are for a 𝝓 = 𝟐. 𝟎 mixture of propane in O2/N2 air. Figure (a) shows an experimental pressure trace with conditions: 𝑷𝟎 = 1.7054 bar, 𝑻𝟎 = 373 K, 𝑷𝑪 = 30.02 bar, 𝑻𝑪 = 759 K. Figure (b) shows a simulated pressure trace with conditions: 𝑷𝟎 = 2.059 bar, 𝑻𝟎 = 373 K, 𝑷𝑪 = 29.98 bar, 𝑻𝑪 = 726 K
In addition to the reactive experiments, non-reactive experiments are carried out to determine the influence of the machine-specific operating parameters on the experimental conditions. In these non-reactive experiments, O2 in the oxidizer is replaced with N2 to maintain a similar specific heat ratio but suppress oxidation reactions that lead to thermal runaway. If the pressure at the EOC of the non-reactive experiments matches that at the EOC of the reactive experiments, it is assumed that no substantial heat release has occurred during the compression stroke, and the temperature at the EOC (𝑇𝐶) can be estimated by applying the adiabatic core hypothesis [61] and the isentropic relations between pressure and temperature during the compression stroke: ln (𝑃𝐶 𝑃0) = ∫ 𝛾 𝛾 − 1 𝑑𝑇 𝑇 𝑇𝐶 𝑇0
where 𝑃0 is the initial pressure, 𝑇0 is the initial temperature, 𝛾 is the temperature-dependent specific heat ratio, and the other variables are as defined previously. Due to the varying specific heat ratio, this formula is not integrated directly. Instead, the procedure described in Section 3.2.2 is used to model the compression stroke, and the simulated temperature at the EOC is taken as 𝑇𝐶. The uncertainty inherent in this calculation of 𝑇𝐶 was estimated by Weber et al. [62] using a Monte Carlo method. Using the same method for the conditions of this experiment results in a typical uncertainty in the EOC temperature of ±1%, similar to the values obtained in the work of Weber et al. [62]. Horizontal error bars are shown on the experimental data obtained in this study to represent this ±1% uncertainty.
The experiments in this work are carried out for the stoichiometric equivalence ratio for a range of relative fractions of DME/C3H8 in the fuel blends, from pure DME to pure C3H8. The oxidizer for all the stoichiometric experiments is a mixture of oxygen and nitrogen in the molar ratio of 1:3.76 (i.e., air). Furthermore, two additional conditions at 𝜙 = 0.5 and 2.0 are studied for pure C3H8, by holding the initial fuel mole fraction constant while adjusting the initial O2 and N2
mole fractions. All the experiments are conducted for an EOC pressure of 𝑃𝐶= 30 bar, and the
EOC temperatures (𝑇𝐶) range from 603 K to 902 K. The mixture conditions are summarized in
Table 2, and the complete list of experimental data points collected in this study is presented in the Supplementary Material.
Table 2. Summary of RCM experimental conditions.
Molar proportions (purity of reactant) DME (99.8%) C3H8 (99.72%) O2 (99.994%) N2 (99.999%) Equivalence ratio (𝜙) 1 0 3 11.28 1.0 3 1 14 52.64 1.0 1 1 8 30.08 1.0 1 3 18 67.68 1.0 1 9 48 180.48 1.0 0 1 5 18.80 1.0 0 1 10 13.80 0.5 0 1 2.5 21.30 2.0
Mixtures are prepared in one of two mixing tanks, approximately 15 L or 17 L in volume. The larger tank is used for the reactive mixtures, while the smaller is used for the non-reactive
mixtures. Mixtures are made by first vacuuming the mixing tanks to an ultimate pressure less than 5 torr, then filling each gas sequentially into the mixing tank to the desired partial pressure. The filling is done at room temperature. Typical total pressures in each tank after filling range from 1700 torr to 2500 torr. The pressure in the mixing tanks during filling is monitored by an Omega Engineering MMA type static pressure transducer. This same transducer is used to measure the initial pressure of the reactants prior to a given experiment. In addition, the temperatures of the mixing tanks and reaction chamber are monitored by several K-type thermocouples; these thermocouples are also used as the control feedback for the heaters. After filling is complete, the heaters are switched on and the mixture is allowed 2 hours to come to steady state. The mixing tanks are also equipped with magnetic stir bars to enhance mixing and ensure homogeneity of the reactants.
Computational methods 3.1 Rate theory calculations
Electronic energies of all species studied in this work were determined at the CCSD(T)-F12a/cc-pVTZ-F12 [63–66] level of theory using Molpro [67]. Molecular geometries and force constants for species and saddle points were determined at the M08SO/MG3S [68][69] level of theory, utilizing QChem 4.1 [70]. A computational grid with 75 radial points and 434 angular points per radial point was used in the optimization and frequency calculations for all species. Frequencies were scaled by the recommended value of 0.983 [71]. Loose internal degrees of freedom for relevant adducts and transition states (i.e., hindered rotors) were treated separately by performing relaxed potential energy scans about the bond defining the internal rotor; these calculations were performed in Gaussian 03 [72] at the BMK/6-311+G(d,p) level of theory [73]. Reduced internal moments of inertia for all internal rotors were estimated at the I(2,3) level as defined by East and Radom [74]. Cantherm [75], a utility of RMG, was used for all TST and RRKM/Master Equation calculations, which were performed in the region of 0.001–100 atm in a nitrogen bath gas and varying temperatures based on the system (further discussed below). The master equation for energy transfer was solved using the chemically significant eigenvalue method, which is documented elsewhere [31,76]. Eckart tunneling corrections [77]were applied to all relevant reactions. All information pertaining to the calculations in this work can be found in the
Supplementary Material, including rate coefficients suitable for combustion modeling, in both Chebyshev and PLOG [78] formats.
The exponential down model for collisional energy transfer was adopted in this work. A temperature-dependent formulation was used for the average downward energy transferred per collision: 〈Δ𝐸𝑑〉 = 〈Δ𝐸𝑑〉300 ( 𝑇 300 K) 𝑛 kJ/mol
where 〈Δ𝐸𝑑〉300 = 3.47 kJ/mol (for CH2OCHO, OCH2OCHO HOCH2O, and CH3OCH2O) is
adopted from a previous study of vinyl + O2 [79], and the temperature exponent, 𝑛 = 0.7, is adopted from previous studies for N2 as the bath gas [80]. Lennard-Jones (LJ) collision diameters and well depths were estimated via the Joback method [81], which is based on the critical temperature and pressure of parent compounds. The method of corresponding states was subsequently used to estimate the LJ parameters [82] and is described in the context of RMG elsewhere [83].
3.2 Experiment simulation details
The Python 3.4 interface of Cantera [84] version 2.2.0 was used for all simulations in this work
other than premixed laminar flame speed calculations, for which CHEMKIN-PRO [85]was used.
In Cantera, state information about the system is stored in an instance of the Solution class. The Solution classes used in this study model simple, compressible systems and as such, require two independent intensive variables to fix the state. These instances of Solution classes are further utilized to compute the thermodynamic properties required to solve the ODE’s representing the combustion systems studied here.
Cantera contains several objects used to model homogeneous reacting systems; the two used in this work are a Reservoir and an IdealGasReactor, which are subclasses of the generic Reactor class. The specific IdealGasReactor class is preferred over the generic Reactor class in this study because the energy equation is directly solved in terms of the temperature, instead of the enthalpy. A Solution object is installed in each Reactor subclass to manage the state information. The difference between the IdealGasReactor and the Reservoir is simply that the state (i.e., the pressure, temperature, and chemical composition) of the Solution in a Reservoir is fixed.
3.2.1 Shock tube simulations
Comparisons with experiments were made by assuming all shock tube ignition delay time measurements could be modeled as 0-D constant volume, adiabatic, batch reactors. This assumption is valid for experiments with negligible rates of change of pressure and temperature after the shock wave reflects off the tube endwall. We note however, that traditional shock tube ignition delay measurements for longer times (e.g., 𝜏 ≥ 1 ms) cannot reliably be modeled with the commonly utilized constant volume adiabatic batch reactors (‘CONV’) approach due to boundary layer and mixture attenuation effects that can reduce the observed 𝜏 compared to a corresponding ideal scenario. This behavior and best practices for minimizing its influence in both experiments and models have been discussed in great detail elsewhere [86]. We therefore recognize the reduced reliability in model-data comparisons for shock tube targets with a long 𝜏. Unless otherwise noted, all shock tube ignition delay times were defined as the time to reach the simulated maximum slope of [OH] with respect to time after the arrival of the shock wave at the endwall. Simulations of species profiles measured behind reflected shock waves in DME/argon mixtures at the Stanford High Temperature Gasdynamics Laboratory [45] were conducted in the same manner as the 𝜏 simulations.
Sensitivity analyses for CONV simulations were performed in Cantera and with respect [OH]. In this work, normalized sensitivity coefficients of [OH] with respect to individual model rate parameters were computed as such:
𝑆[OH],𝑘𝑖=
𝜕 ln[OH] 𝜕 ln 𝑘𝑖
For all analyses, a user specified time was chosen (e.g., time of max (𝑑[OH] 𝑑𝑡⁄ ), time at 50% fuel consumption, etc.). Sensitivity parameters were then further normalized to -1 or 1 based on the largest value by magnitude within the sensitivity array.
3.2.2 Rapid compression machines
As mentioned previously, non-reactive experiments were conducted to characterize the machine specific effect on the experiments in the RCM. A non-reactive experiment was conducted for each reported ignition delay in this study. The non-reactive pressure trace was combined with the reactive pressure trace to produce a combined pressure trace. For this, the reactive pressure trace was taken until the EOC, and the non-reactive pressure trace was taken after the EOC.
The combined pressure trace was used to compute a volume trace that could be applied to simulations to include any facility effects. The volume trace was created by initializing a Cantera Solution object at the initial pressure and temperature (𝑃0, 𝑇0) of the reactor. After initialization, the initial mass-specific entropy (𝑠0) and density (𝜌0) were recorded. The initial volume (𝑉0) was arbitrarily taken to be equal to 1.0 m3; the initial volume in this step was arbitrary so long as the initial volume utilized in the Reactor-based simulations described below was the same, since the velocity (i.e., the time rate of change of volume) enters the energy equation, not the volume itself. The measured pressure at each data point (𝑃𝑖) from the combined pressure trace was used with the previously recorded initial entropy (𝑠0) to set the state of the Solution object sequentially. At each data point, the volume was computed according to conservation of mass and the ideal gas law
𝑉𝑖= 𝑉0 𝜌0 𝜌𝑖
where 𝜌𝑖 was the density at each point computed by the Cantera Solution. This procedure effected an isentropic compression/expansion process, where compression occurred during the compression stroke and expansion occurred after the EOC. Note that the expansion process after the EOC was not a physical process; it was simply a modeling of the inherent experimental heat loss post-EOC. Moreover, this procedure accounted for the variation of the specific heat ratio as a function of temperature. Since there were no significant reactions that occurred during the compression stroke for the reactive experiments, or during and after the compression stroke for the non-reactive experiments, it was not necessary to solve the species and energy equations using an IdealGasReactor. After generation, the volume trace was downsampled to 20 kHz (from the experimental rate of 100 kHz) to reduce computational time of the simulations. This has no effect on the simulations, as confirmed by applying the full-rate (i.e., 100 kHz) volume trace to a simulation.
This volume trace was applied to a reactive simulation in Cantera as follows. A Solution object was initialized to the initial state of the reactor (𝑃0, 𝑇0) and installed in an IdealGasReactor object (𝑉0 = 1.0 m3). A Reservoir object was defined containing an arbitrary state and a Wall was installed between the Reservoir and the Reactor. The Wall allows the volume of the IdealGasReactor to vary with time and the effect of the Wall enters the energy equation through
Commented [ed3]: Bryan. Bill raises the point of rewording this
a little to include rho_i = rho_o* P(t) * To / ( T(t) * Po) and to further point out that T(t) must be computed, and P(t) is measured.
Commented [BW4R3]: I don’t think it’s necessary to show the
derivation from the ideal gas law of the relationship between density and volume. I do think clarifying could be useful, especially because this particular computation step doesn’t actually require the assumption of an isentropic process
the velocity term as the Wall does work on the IdealGasReactor. The velocity of the Wall was specified based on the first forward difference of the volume as a function of time.
Finally, the IdealGasReactor was installed in a ReactorNet, which implements the interface to the solver CVODES. CVODES is an adaptive-time-stepping solver, distributed as part of the SUNDIALS suite [87]. As the solver stepped towards the end time of the simulation, the state of the system was stored on each integrator time step, producing simulated pressure, volume, and temperature traces. Comparisons between the simulated pressure traces from Cantera and CHEMKIN-PRO show negligible differences.
Simulations were conducted for two purposes – to determine the temperature at the EOC, 𝑇𝐶, and to compute the simulated ignition delay. The temperature at the EOC was used as the reference temperature for this RCM data, and was therefore reported for all of the data points collected in this paper. 𝑇𝐶 was defined as the simulated temperature at the EOC. To ensure that the adiabatic assumption during the compression stroke was realized, the simulated pressure during the compression stroke for a reactive simulation and a simulation where reactions have been “turned off” (e.g., by setting the reaction rate multiplier to zero) were compared and found to be identical. In addition, the non-reactive simulated pressure trace was compared to the non-reactive experimental pressure trace and no differences were found.
Two definitions of the ignition delay in the simulations were used. The first definition matches the definition in the experiments, with the overall ignition time defined as the global maximum of the time derivative of the pressure (𝑑𝑃/𝑑𝑡) after the EOC, and the first-stage ignition delay time defined as the first maximum of 𝑑𝑃/𝑑𝑡 after the EOC. The time derivative of the pressure in the simulations was computed by second order Lagrange polynomials, as discussed by Chapra and Canale [88]. In some cases, however, the pressure rise during the first-stage ignition was slow, resulting in a small peak in 𝑑𝑃/𝑑𝑡. Due to electrical noise in the measured pressure signal that propagated into the simulations through the computed volume trace, a first peak in 𝑑𝑃/𝑑𝑡 was not always observed in the simulations despite a significant deviation of the simulated reactive pressure trace from the non-reactive pressure trace prior to ignition. In such cases, the first peak of the overall simulated heat release rate (HRR) was used to define a first-stage ignition delay time, 𝜏1,𝐻𝑅𝑅. This definition of the first-stage ignition delay was found to align well with the definition of first-stage ignition delay by the first maximum of 𝑑𝑃/𝑑𝑡. A comparison of these
definitions is shown in Figure 1b. Note that Figures 1a and 1b show different 𝑇𝐶 conditions; this is because we could not find an overlapping condition where the experimental 𝑑𝑃/𝑑𝑡, the simulated 𝑑𝑃/𝑑𝑡, and the HRR all showed distinct peaks.
3.2.3 Jet-stirred reactors
Jet-stirred reactors were modeled as 0-D adiabatic, constant pressure, perfectly-mixed, isothermal reactors with no reactions at the walls. A Cantera Solution object was installed in an IdealGasReactor. Subsequently, the IdealGasReactor was connected to a Cantera Valve object with inlet flow from a Reservoir supplying the reactant mixture. The IdealGasReactor was also connected to an outlet – a Cantera MassFlowController object, whose mass flow rate was calculated from a corresponding experimental residence time, with exhaust products flowing into another Cantera Reservoir object. This network of objects (Inlet→IdealGasReactor→Outlet) was installed in an instance of ReactorNet and integrated until steady state was reached. In all cases, integrating from multiples of 10–25 in residence times was sufficient for the systems to reach steady state.
3.2.4 Premixed laminar counterflow and burner-stabilized flames
Simulations were performed using CHEMKIN-PRO [85]. All calculations in the present work were performed with the multicomponent transport formulation and inclusion of thermal diffusion. Domain-discretized grid sizes of 200 or more points were obtained for each simulation, which was deemed sufficiently resolved (as demonstrated in a benchmark exercise for simulations of up to 600 grid points). Similarly, burner-stabilized premixed laminar flame speeds were solved with imposed experimentally measured temperature profile constraints. Multicomponent transport and thermal diffusion were included. Inlet unburned gas velocities were used as a boundary condition for the flame model.
3.3 RMG simulations
The open source Reaction Mechanism Generator (RMG) [31], Python version 1.0 (found at http://reactionmechanismgenerator.github.io) was used for automated kinetic model construction. Details of RMG’s algorithm and methods can be found elsewhere [89] and are described briefly here. The model is grown using the rate-based algorithm developed by Susnow et al. [90], where RMG simulates isothermal, isobaric reactor conditions with a user-given set of initial “core” species, using a set of reaction family templates to discover all possible reactions between them, forming a new set of “edge” species. At each integration step, RMG evaluates whether an edge
species is important enough to be included in the model by checking whether it has a larger flux than the user-specified tolerance. If so, the edge species is added to the set of core species constituting the model, and it is reacted with all the existing core species to generate additional edge species and reactions. The simulation is repeated from 𝑡 = 0 until RMG deems another edge species to be important. This iterative process of adding new edge species and re-simulating the system continues until the model satisfies the user-given termination criteria and all fluxes to edge species are below the threshold tolerance. For more information on this software package, see Gao et al. [91].
Results and discussion
4.1 Detailed kinetic models 4.1.1 Base model
A base model (hereafter described as Model I) of 120 species and 701 reactions is assembled in the present work from three principal sources. The propane submechanism (along with the majority of the small molecule chemistry) is adopted from Merchant et al. [28], in which the low temperature kinetics are derived from the detailed ab initio and rate theory calculations of Goldsmith et al. [27]. Goldsmith and coworkers also computed the thermodynamic parameters for a large number of the species relevant to propane oxidation [27]; these are adopted in the present work. The base chemistry for H2/CO/H2O2/HCO compounds was updated with that from the CEFRC mechanism [92][93]. The remaining base chemistry in the model assembled by Merchant et al. [28] is derived from the work of Healy et al. [94] and is carried forward into Model I. The DME kinetics and related thermochemistry are largely adopted from the recent work of Burke et al. [9], who have validated their model for a number of experimental targets over a wide range of pressure, temperature, and composition conditions. Those authors also computed pressure dependent rate parameters for the decomposition of CH3OCH2 and pathways relevant to the first O2 addition. Between 6501000 K, the CH3OCH2O2 adduct formed from the first O2 addition to CH3OCH2 is consumed primarily by the well know isomerization-elimination chain branching pathway:
CH3OCH2 + O2 = CH3OCH2OO (RO2)
CH3OCH2OO (RO2) = HOOCH2OCH2 (QOOH)
Commented [JS5]: For the identical reactions with different
rates, how were the rate coefficients determined in the assembled mechanism?
Commented [ed6R5]: This situation did not arise the way the
HOOCH2OCH2 (QOOH) = OH + 2CH2O
O2 + HOOCH2OCH2 (QOOH) = OOCH2OCH2OOH (O2QOOH)
OOCH2OCH2OOH = HOOCH2OCHO + OH
HOOCH2OCHO = OCH2OCHO + OH
This first O2 addition and its subsequent reactions have also been recently investigated by Eskola et al. [16] and Rodriguez et al. [19]. We tested the use of all three (the two aforementioned sets in addition to that by Burke et al. [9]) elementary reaction sets against a wide range of low temperature experimental targets, finding that the reaction sequence by Burke et al. [9] gave superior overall performance against the large number experimental targets used in this work. Thus, we retained the reactions corresponding to first O2 addition from the model of Burke et al. [9]. The rate of CH2O + H = HCO + H2 was also updated based on the results of a recent combined computational and theoretical study [95]. Further updates based on rate evaluations and calculations are described below.
4.1.2 RMG model
One additional model was generated in the present work using RMG. By specifying Model I as a “seed mechanism” in RMG, all of the reactions in Model I were forced to be included in the final RMG model. This model is referred to hereafter as Model II. Reactor conditions spanning the temperature and pressure ranges of the RCM data obtained in this work were used as RMG input reactor parameters to generate Model II. This model is substantially larger in size, with 168 species and 3979 reactions, as RMG found more than 3200 reactions and 48 species that satisfied the criteria for inclusion in the model. Aspects of the two models generated in this work are summarized in Table 3.
Table 3. Species and reaction count for models used in this work.
Model Number of species* Number of reactions
Model I 120 701
Model II 168 3979
*
Model II was used to simulate many of the experimental targets chosen for this work, including the RCM data measured in the present study and the JSR data of Rodriguez et al. [19]. For all cases considered, Model I and II predicted the available experimental data equally well, even though RMG discovered a plethora of reactions between DME and propane radical intermediates. Although it is possible that differences between Models I and II may surface for fuel-rich or pyrolytic conditions, these are not conditions of practical interest since most practical devices [ideally] operate with fuel-lean or stoichiometric combustion. We note however, that Model II did have an impact on predicted methyl formate JSR species profiles of Rodriguez et al. [19], which are sensitivity to a number of factors discussed below. Model I is used as the primary comparison tool with the experimental data in the remainder of the present work. In addition to the model-experiment comparisons presented in this paper, a large number of additional validations using Model I are available in the Supplementary Material and are identified in Table 1.
The results of this exercise support the hypothesis that binary fuel models designed for dual fuel purposes may be assembled simply based on combinations of their separate submechanisms. This notion, in combination with advanced model merging tools [96] which can identify and eliminate redundant species and/or reactions, may make model generation for future binary fuel mixtures a facile task (assuming the independent submechanisms are reliable). Although cross-reactions between larger radical intermediate derivatives of DME and propane do not influence any of the experimental targets modeled in this work, there is clearly kinetic coupling of the fuels as a result of DME's higher reactivity and OH, HO2 radical formation which promotes autoignition of propane. As illustrated and elaborated upon in a later section, even small amounts of DME can significantly reduce the ignition delay times of DME/propane binary mixtures.
4.2 Rate considerations, evaluations, and calculations
As discussed in the previous section, a number of updates to rates of important reactions in the DME and propane submechanisms were performed in this work. These are described in the following sections.
4.2.1 HO2CH2OCHO = OH + OCH2OCHO
The decomposition of HO2CH2OCHO (hydroperoxymethylformate) to OH + OCH2OCHO is known to drive autoignition of DME below 700 K [20]. The rate of this decomposition reaction remains highly uncertain, and is typically tuned to fit experimental data (published and adopted
Commented [Gu7]: I wonder if this claim is more specific to
this case since there are a lot of overlapping radicals between propane and dme... How boldly could we say this about other binary mixtures? - Connie
Commented [ed8R7]: Other than OH and HO2, there are not
really any radicals that overlap. However, we could considered narrowing down the statement to DME + alkanes of C3 or larger size (since propane is commonly viewed as a prototypical linear fuel surrrogage)
rates can differ by over 2 orders of magnitude). In addition, all current DME models use a rate
derived from the soft recommendation of Baulch et al. [97] for the decomposition of C2H5OOH
(ethyl hydroperoxide) to C2H5O + OH (although most others have adjusted the rate coefficient). The decomposition rate of the ketohydroperoxide is not expected to be the same as the ethyl hydroperoxide. Here, similar approach was adopted in this work, where the activation energy of
the nominal Baulch evaluated rate [97] was reduced by 2 kcal/mol to better match the DME RCM
experiments of this work. Figure 2 compares the rate of this decomposition reaction with select literature values, illustrating the large disparity. As elaborated upon below, the assumed rate this reaction also strongly influences predicted peak methyl formate (MF) mole fractions in the JSR experiments of Rodriguez et al. [19].
10-1 100 101 102 103 104 105 106 1 1.2 1.4 1.6 1.8 2 this work Burke et al.
Baulch et al., Rodiguez et al. Zhao et al. Wang et al.
R
a
te
(s
-1)
1000/T (K-1) HO2CH2OCHO = OH + OCH2OCHOFigure 2. Comparison of the rates of the decomposition of the ketohydroperoxide hydroperoxymethylformate (HO2CH2OCHO) to OH + OCH2OCHO between 5001000 K. Black line: this work; red dash-dotted line: Zhao et al. [20]; blue dotted line: Wang et al. [42]; green dashed line: Burke et al. [9]; purple long/short-dashed line: Baulch et al. [97], for the reaction C2H5OOH = C2H5O + OH, recommended between 400–800 K (used in Rodriguez et al. [19]).
4.2.2 OCH2OCHO = HOCHO + HCO
Prior to a recently discovered concerted pathway, the resulting OCH2OCHO radical was thought to solely undergo an intra-H migration to HOCH2OCO:
OCH2OCHO = HOCH2OCO
Under the low temperature oxidative conditions where HOCH2OCO is important in DME combustion, it can undergo further unimolecular decomposition:
HOCH2OCO = CH2OH + CO2 HOCH2OCO = CO + HOCH2O
where the 𝛼-hydroxymethyl (CH2OH) radical will almost exclusively react with O2 under the conditions where the above pathway is important, although at higher temperatures it may undergo H-elimination to CH2O + H [98]. HOCH2O may undergo a variety of decomposition reactions:
HOCH2O = HOCHO + H HOCH2O = OH + CH2O HOCH2O = H + HCOOH
which are further discussed below in a separate section. Wang et al. [42] recently discovered a concerted elimination from OCH2OCHO:
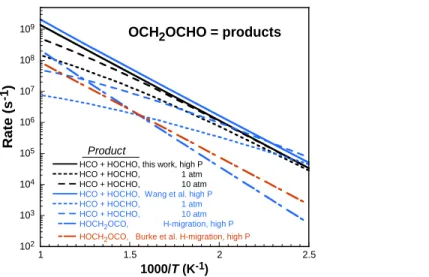
This concerted reaction results in formic acid (HOCHO) and formyl (HCO), and is faster than the competing intra-H migration by an order of magnitude or more below 1400 K. In their work, Wang et al. [42] explored the potential energy surface in detail at the UQCISD(T)/CBS//B3LYP/6-311++G(d,p) level of theory, followed by pressure-dependent rate calculations using MESMER [99]. Rate coefficients were also computed in the present work, as described above, and a comparison of the decomposition with other published values is shown below in Figure 3. As illustrated in Figure 3, there is considerable pressure dependence at higher temperatures. Although the high-pressure limit rates between this work and Wang et al. [42]are in good agreement, there exists notable disagreement between the 1 atm and 10 atm rate constants. In their work, Wang et al. [42]used RRHO for all internal degrees of freedom, which could explain the slightly higher high-pressure limit rate in comparison to that computed here. Our computed pressure-dependent rate coefficients differ from those computed by Wang et al. [42] by about an order of magnitude in the combustion-relevant temperature ranges. It is also noted that in the recent work of Rodriguez et al. [19], the reaction products were assumed to be OCH2OCHO = CH2O + OCHO, negating the need to include the species HOCH2OCO in their reaction mechanism (along with its subsequent reactions). The recent mechanism of Burke et al. [9] included estimates for the intra-H migration channel, as well as a decomposition pathway to CH2O + OCHO.
102 103 104 105 106 107 108 109 1 1.5 2 2.5
HCO + HOCHO, this work, high P HCO + HOCHO, 1 atm HCO + HOCHO, 10 atm
HCO + HOCHO, Wang et al. high P HCO + HOCHO, 1 atm HCO + HOCHO, 10 atm HOCH2OCO, H-migration, high P
HOCH2OCO, Burke et al. H-migration, high P
R a te (s -1) 1000/T (K-1)
OCH2OCHO = products
Product
Figure 3. Arrhenius comparison of rate constants at various pressures for the unimolecular decomposition of OCH2OCHO. Black: this work; blue: Wang et al. [42]; orange: isomerization to
HCH2OCO (concerted elimination to HCO + HOCHO was not considered) [20] [9]. In the work of Rodriguez et al. [19], different products are assumed.
4.2.3 Self-reaction of CH3OCH2O2
At low temperatures, the self-reaction of CH3OCH2O2 (methoxymethyl peroxy, the ‘RO2’
corresponding to DME) is in competition with RO2 = QOOH isomerization, and subsequent OH producing reactions. Two possible product channels are considered:
2CH3OCH2O2 = 2CH3OCH2O + O2
2CH3OCH2O2 = CH3OCHO + CH3OCH2OH + O2
Determination of product yields of this reaction has been hampered by the fact that both reactions yield MF, although Jenkin et al. [100]reported a 0.7 ± 0.1 branching ratio from FTIR product studies and photolysis experiments involving methoxymethyl peroxy. Thus, the branching fraction is dominated by the first pathway. This is further discussed below.
The rate of the RO2 self-reaction was also indirectly measured by Rosado-Reyes et al. [101], in the temperature range of 295–600 K and pressures of 20–200 torr. In their study, the authors investigated branching ratios of the CH3OCH2 + O2 reaction by monitoring yields of formaldehyde, methyl formate, and formic acid via transient infrared spectroscopy. The rate constant of the methoxymethyl peroxy radical self-reaction is calculated from the kinetics of the formaldehyde and methyl formate product yields [101]. At 298 K, the resulting rate of 1.91012 cm3/mol-s is in good agreement with that measured by Jenkin et al. [100] at the same temperature (1.31012 cm3/mol-s). The mechanism of Zhao et al. [20] used a combination of the results from Dagaut et al. [102] and Jenkin et al. [100], originally implemented by Fisher et al. [17] and Curran et al. [18]. Both Dagaut et al. [102] and Jenkin et al. [100] noted that this reaction is pressure-dependent and in the falloff regime between 228–380 K and 25–800 torr. Although Dagaut et al. [102]provided a pressure dependent parameterization of the self-reaction by monitoring its decay over 228–380 K and 25–800 torr, no kinetic model incorporates it. Furthermore, the reported experimental uncertainties of Dagaut et al. [102]are smaller than what has been reported by Rosado-Reyes et al. [101]; thus, the tabulated rates of Dagaut et al. [102] were parameterized into
the PLOG format and used in this work. Additionally, the branching fraction was assigned to 0.7 (in favor of the 2CH3OCH2O + O2 channel), as observed by Jenkin et al. [100]. A comparison of the resulting rate used in this work is shown with other values in Figure 4. Up to 600 K, the rates adopted in this work fall within the lower bound of the self-reaction rate constant reported by Rosado-Reyes et al.[101], also illustrated in Figure 4.
1010 1011 1012 1.6 2 2.4 2.8 3.2 Rosado-Reyes et al. down Burke et al. 15 Zhao et al. 08 Jenkin 89 Dagaut et al. 89
1 atm, fit to Dagaut et al. 89
Ra
te
(
c
m
3mo
l
-1s
-1)
1000/T (K
-1)
2CH
3OCH
2O
2= products
Figure 4. Arrhenius plot of the methoxymethyl peroxy self-reactions dominant channel plotted between 298–600 K. Black line: high-pressure limit rate of Dagaut et al. [102]; thin black line: fitted 1 atm rate from Dagaut et al. [102]; red: Rosado-Reyes et al. [101] (with lower limit as thin red line); green line: Zhao et al. [20], which is a combination of the results from Dagaut et al. [102] and Jenkin et al. [100], originally implemented by Fisher et al. [17] and Curran et al. [18]; black filled circle: experimental result of Jenkins et al. [100]; blue short/long dashed line: Burke et al. [9].
4.2.4 CH3OCH2O = CH3OCHO + H
This alkoxy species is predominantly formed during the self-reaction of methoxymethyl peroxy radicals, as described above. Upon its formation, methoxymethyloxyl very quickly decomposes into methyl formate (CH3OCHO) + H (see Figure 5 and illustration of competing CH3O + CH2O product channel from [20]). Although rate calculations for this reaction have been performed by
Song et al.[103], no rate expressions were given. Thus, the temperature and pressure dependent kinetics were computed in the present work.
In the work of Rosado-Reyes et al. [101], the alkoxy decomposition rate is assigned a lower bound of 2×10⁵ s-1, as depicted in Figure 5. This value was fitted to MF and CH2O profiles at 503 K and defined as a lower limit since the rate-limiting reaction step under the authors' experimental conditions is the self-reaction of the methoxymethyl peroxy radicals (CH3OCH2O2). At 500 K, the rate of the corresponding high-pressure limit reaction computed in this work is over two orders of magnitude faster. Compared to the rate computed here, large discrepancies in rates exist with those used in other models. As seen in Figure 5, the rate computed here roughly splits the values determined/used in previous work. The decomposition rate is very fast: at 500 K and 1 atm, the lifetime of CH3OCH2O is less than 0.1 microseconds. Thus the overall self-reaction of methoxymethyl peroxy can be represented as:
2CH3OCH2O2 = 2MF + 2H + O2
Figure 5 also shows the minor channel (CH3OCH2O = CH3O + CH2O) from the model of Burke et al. [9]; the rate of reaction is not competitive with the MF channel and the reaction was therefore removed from the final model.
102 104 106 108 1010 1012 1 1.2 1.4 1.6 1.8 2 this work Burke et al.
Zhao et al. / Rodriguez et al. CH3O+CH2O Zhao et al. Rosado-Reyes et al. (lower limit)
R
a
te
(
s
-1)
1000/T (K-1) CH3OCH2O = CH3OCHO + H 10 atm 1 atmFigure 5. Comparison of rate constants at various pressures for the decomposition of CH3OCH2O to methyl formate (CH3OCHO, MF) + H. Black: this work, with 1 atm and 10 atm rates also included; red: Burke et al. [9]; blue: Rosado-Reyes et al. [101], lower bound; purple: Zhao et al. [20] (adopted by Rodriguez et al. [19]) with short dashed purple lines representing the decomposition channel to CH3O + CH2O.
4.2.5 CH2OCHO = CH2O + HCO
This radical species is a derivative of methyl formate, which is formed during the oxidation of DME. This reaction is only included at the high pressure limit in current combustion models [9][19][104][105]. Thus, the pressure dependence was computed here. At higher temperatures, the pressure dependence of this reaction may influence the combustion kinetics of methyl formate via H-abstraction reactions by various radicals from the parent methyl formate, forming CH2OCHO. The decomposition rate is compared against other literature values in Figure 6. The high pressure limit used in the model by Burke et al. [9]is in fair agreement with that computed here, although that used by Rodriguez et al. [19]is faster by 1–3 orders of magnitude from 298–2000 K. Although intra-H migration is possible for this system, the unimolecular decomposition dominates for all temperatures, as illustrated in Figure 6.
100 102 104 106 108 1010 0.5 1 1.5 2
this work, high-P 1 atm 10 atm Burke et al. 15 Rodriguez et al. 15 H-shift to CH3OCO R a te (s -1) 1000/T (K-1) CH2OCHO = HCO + CH2O
Figure 6. Comparison of rate constants at various pressures for the decomposition of CH2OCHO. Black: this work; red: Burke et al.[9]; blue: Rodriguez et al. [19]; light grey: this work, intra-H migration to CH3OCO.
4.2.6 HOCH2O = H + HOCHO
HOCH2O is a radical derivative of methanediol, and can be formed during its oxidation. In the context of DME, all combustion kinetic models for its oxidation created before the year 2015 (before inclusion of the concerted elimination of OCH2OCHO to HOCHO + HCO computed by Wang et al. [42] and in this work) predict the formation of large quantities of HOCH2O during low temperature DME oxidation simulations. However, because the intra-H migration from OCH2OCHO to HOCH2OCO is in fact a minor channel, HOCH2O forms only in small amounts during DME oxidation. Because its rate of decomposition is expected to be pressure dependent, and because this alkoxy radical may be an important intermediate during the oxidation/pyrolysis of other potential alternative fuels, its pressure-dependent decomposition rates were computed here. An Arrhenius plot comparing the results of the ME/RRKM simulations conducted in this work are shown in Figure 7 with comparisons to other available rates. We note that HOCH2O = OH + CH2O is also included in the detailed kinetic model (written in the reverse direction, and adopted from Xu et al. [106]), but this reaction is slower under all temperatures (three orders of magnitude at 600 K, increasing to 5% of the H + HOCHO channel at 1500K).
106 107 108 109 1010 1011 1012 1013 0.5 1 1.5 2 this work Zhao et al.
Ra
te
(s
-1)
1000/T (K-1) HOCH2O = HCOOH + H 10 atm 1 atmFigure 7. Arrhenius plot for the decomposition of HOCH2O. Black: this work; red: used in a number of other models [20][9][42].
4.2.7 Role of cyclic peroxides
Ketohydroperoxides (KHPs) produced during low temperature hydrocarbon oxidation may
undergo Korcek decomposition reactions [107–110]that can directly compete with decomposition
to OH and an alkoxy radical. The Korcek decomposition reaction of a DME KHP (hydroperoxymethyl formate) is to form acetic acid + formaldehyde, and acetaldehyde + formic acid (see illustration in Figure 8). Carbonic acid has been recently detected by mass spectrometry after molecular beam sampling from a JSR by Moshammer et al. [111]. However, no rate calculations have been performed for this reaction, because the Korcek reaction for HO2CH2OCHO is not expected to play a significant role under the conditions of interest here (see the comparison for a propane KHP below). The primary source of OH radicals during the low temperature oxidation of propane is through the HO2CH2CH2CHO KHP and its unimolecular decomposition [112]:
HO2CH2CH2CHO = OH + OCH2CH2CHO
which is in competition with formation of a cyclic peroxide (CP):
HO2CH2CH2CHO = CP
The CP may further react through the following reactions:
CP = acetic acid + formaldehyde CP = acetaldehyde + formic acid
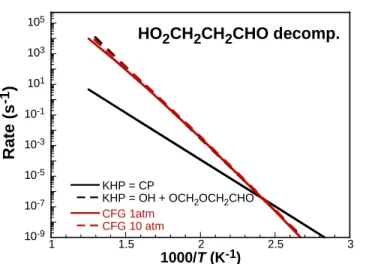
These pathways are also schematically illustrated in Figure 8. The pathway to a CP and its subsequent products was considered in this work, but inclusion of the rates recently computed by Jalan et al. [112] did not have any influence on simulation results. The reason for this is evidenced by a comparison of the KHP decomposition rates, illustrated in Figure 9. Under the lowest temperature RCM experiments of this work (700 K), decomposition of KHP to OH + OCH2CH2CHO dominates by 3 orders of magnitude. Only at and below 400 K does CP formation become competitive with the aforementioned channel. Thus, formation of CP and its subsequent reactions is not included in the kinetic mechanism in the present work.
Figure 8. Ketohydroperoxide (KHP) fate and cyclic peroxide (CP) decomposition reactions investigated in previous work, with respect to propane oxidation [112][27].
10-9 10-7 10-5 10-3 10-1 101 103 105 1 1.5 2 2.5 3 KHP = CP
KHP = OH + OCH2OCH2CHO CFG 1atm CFG 10 atm
Ra
te
(s
-1)
1000/T (K-1)HO
2CH
2CH
2CHO decomp.
Figure 9. Rate comparison of KHP (HO2CH2OCHO) decomposition pathways. Black: high-pressure limit rates from Jalan et al. [112]; Red: Goldsmith et al. [27]; see Figure 8 for species definitions.
Last, it must be noted that there also exists the possibility of a formic acid catalyzed conversion of KHP to CP [112], which is relevant to the low-temperature JSR data of Rodriquez et al. [19]. Jalan et al. [112]used high-level quantum chemical methods for the analogous propane mechanism, predicting that the formic acid catalyzed reaction can lower the barrier by over 30 kcal/mol. To test the influence of this pathway on the simulated species profiles for the JSR data investigated here, rate parameters for the acid catalyzed isomerization and subsequent decomposition were estimated by analogy to those for propane (in this case, the resulting DME CP is assumed to decompose into two formic acid molecules). JSR simulations were then performed with these two additional reactions:
HO2CH2OCHO + HOCHO = CP + HOCHO CP = 2HCOOH (formic acid)
Simulations of stoichiometric DME/O2 mixtures in helium (corresponding to the conditions in the work of [112]) resulted in accumulation of CP up to 100 ppm (10% of the KHP peak concentration), peaking at the same temperatures as HO2CH2OCHO. In addition, peak formic acid and HO2CH2OCHO concentrations were predicted to change by ~10%. Thus, future work should include exploration of this acid-catalyzed mechanism if the low temperature (𝑇 < 600 K) JSR product distributions are to be accurately predicted.
4.2.8 C3H8 + OH
The competition between primary and secondary H-abstraction by OH on propane is critically important in dictating its autoignition behavior. Two reactions are possible:
C3H8 + OH = n-C3H7 + H2O C3H8 + OH = i-C3H7 + H2O
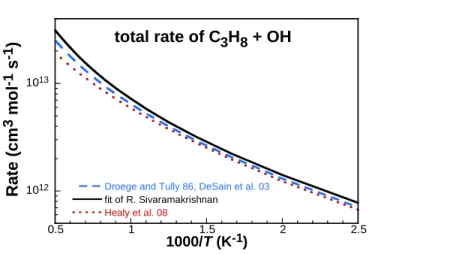
As noted by Merchant et al. [28], H-abstraction from the methyl groups of propane promotes low temperature autoignition due to the resulting OH chain branching pathways, while H-abstraction at the secondary carbon site retards ignition because it leads to HO2 formation, which further undergoes HO2-HO2 recombination. Therefore, we have derived rates that accurately capture both the branching ratios and total rate constants over a wide temperature range. Droege and Tully [113] previously measured absolute rate coefficients and branching fractions between 293–854 K through a laser photolysis/laser-induced fluorescence technique at 400 torr (in helium), with branching ratios determined by performing experiments using six selectively deuterated isotopes of propane. The resulting branching ratios were found to be strikingly similar to those previously determined by Walker’s fits to experiments at 297 K and 753 K [114]. More recently, rates and branching ratios of this reaction have been computed by Huynh et al. [115], who compared their predictions with numerous other efforts performed over the last 30 years, finding excellent agreement with the experimental work of Droege and Tully [113]. However, the authors did not publish their computed rates in any form other than in an Arrhenius plot. Thus, the branching ratios
published by Droege and Tully [113]were fitted to functional forms in this work a power law
fitting errors less than 5% below 1500 K. These were then used to define the rates for each channel based on the total rate fitted by Sivaramakrishnan et al. [116], which accurately captures experimental data spanning a wide temperature range. Sivaramakrishnan et al. [116] measured the total rate of C3H8 + OH in the temperature range of 7971259 K. In their study, they performed a modified three-parameter Arrhenius regression of their data along with those of 13 other studies spanning the temperature range of 1901248 K. This total rate in combination with the branching fits from the work of Droege and Tully [113] were used to derive new C3H8 + OH rate constant. Comparisons with this newly derived rate are made with other available rates in Figure 10. The new rates were adopted in this work and also fitted to a modified three-parameter Arrhenius form and are given in Table 4.
1012
1013
0.5 1 1.5 2 2.5
Droege and Tully 86, DeSain et al. 03 fit of R. Sivaramakrishnan Healy et al. 08
Ra
te
(c
m
3m
o
l
-1s
-1)
1000/T (K-1)total rate of C
3H
8+ OH
Figure 10. Comparison of the total rate of H-abstraction by OH on propane. Black solid line: fit of Sivaramakrishnan et al. [116], used in this work; blue dashed line: Droege and Tully [113], as well as DeSain et al. [117][118]; red dotted line: Healy et al. [94].
Table 4. Three-parameter modified Arrhenius fits to reaction rates studied in this work, computed
at the CCSD(T)-F12a/cc-pVTZ-F12//M08SO/MG3S level or re-evaluated. Units in cm3, mole, cal,
and s. Pressure dependent rate parameterizations included in the Supplementary Material.
Reaction channel High-pressure limit rate parameters*
𝐴 𝑛 𝐸𝑎 (cal/mol) HOCH2O HOCHO + H 4.83E+08 1.350 10726

![Figure 7. Arrhenius plot for the decomposition of HOCH 2 O. Black: this work; red: used in a number of other models [20][9][42] .](https://thumb-eu.123doks.com/thumbv2/123doknet/14723685.571173/28.918.228.482.228.590/figure-arrhenius-plot-decomposition-hoch-black-number-models.webp)
![Figure 24. Parity plot of all experimental shock tube data in this paper and the Supplementary Material ([9][21][22][23][29][43][44][47]) and the RCM data from this work with the corresponding predicted ignition delay time values](https://thumb-eu.123doks.com/thumbv2/123doknet/14723685.571173/52.918.145.606.510.903/figure-parity-experimental-supplementary-material-corresponding-predicted-ignition.webp)
![Figure S3. Ignition delay time data for the Cook et al. 2009 [3] shock tube conditions of 1% DME in Ar/O 2](https://thumb-eu.123doks.com/thumbv2/123doknet/14723685.571173/64.918.230.680.130.561/figure-ignition-delay-time-data-cook-shock-conditions.webp)
![Figure S6. Ignition delay time data for the Tang et al. 2012 [4] shock tube conditions of CH 4 /DME at](https://thumb-eu.123doks.com/thumbv2/123doknet/14723685.571173/66.918.194.707.113.535/figure-ignition-delay-tang-conditions-different-blending-ratios.webp)
![Figure S8. Methane (CH 4 ) species profile data for the Pyun et al. 2013 [5] shock tube conditions of 1%](https://thumb-eu.123doks.com/thumbv2/123doknet/14723685.571173/68.918.196.708.124.580/figure-methane-species-profile-data-pyun-shock-conditions.webp)
![Figure S9. Ethylene (C 2 H 4 ) species profile data for the Pyun et al. 2013 [5] shock tube conditions of 2%](https://thumb-eu.123doks.com/thumbv2/123doknet/14723685.571173/69.918.198.706.124.580/figure-ethylene-species-profile-data-pyun-shock-conditions.webp)