HAL Id: hal-00303194
https://hal.archives-ouvertes.fr/hal-00303194
Submitted on 28 Nov 2007HAL is a multi-disciplinary open access
archive for the deposit and dissemination of sci-entific research documents, whether they are pub-lished or not. The documents may come from teaching and research institutions in France or abroad, or from public or private research centers.
L’archive ouverte pluridisciplinaire HAL, est destinée au dépôt et à la diffusion de documents scientifiques de niveau recherche, publiés ou non, émanant des établissements d’enseignement et de recherche français ou étrangers, des laboratoires publics ou privés.
Rapid convective outflow from the U.S. to the upper
troposphere over the North Atlantic during the NASA
INTEX-NA airborne campaign: flight 13 case study
S. Y. Kim, R. Talbot, H. Mao, D. Blake, S. Vay, H. Fuelberg
To cite this version:
S. Y. Kim, R. Talbot, H. Mao, D. Blake, S. Vay, et al.. Rapid convective outflow from the U.S. to the upper troposphere over the North Atlantic during the NASA INTEX-NA airborne campaign: flight 13 case study. Atmospheric Chemistry and Physics Discussions, European Geosciences Union, 2007, 7 (6), pp.17367-17400. �hal-00303194�
ACPD
7, 17367–17400, 2007
Flight 13 case study during the NASA INTEX-NA campaign S. Y. Kim et al. Title Page Abstract Introduction Conclusions References Tables Figures ◭ ◮ ◭ ◮ Back Close
Full Screen / Esc
Printer-friendly Version Interactive Discussion
EGU Atmos. Chem. Phys. Discuss., 7, 17367–17400, 2007
www.atmos-chem-phys-discuss.net/7/17367/2007/ © Author(s) 2007. This work is licensed
under a Creative Commons License.
Atmospheric Chemistry and Physics Discussions
Rapid convective outflow from the U.S. to
the upper troposphere over the North
Atlantic during the NASA INTEX-NA
airborne campaign: flight 13 case study
S. Y. Kim1, R. Talbot1, H. Mao1, D. Blake2, S. Vay3, and H. Fuelberg4
1
Climate Change Research Center, Institute for the Study of Earth, Oceans, and Space, University of New Hampshire, Morse Hall, Durham, NH 03824, USA
2
Department of Chemistry, University of California – Irvine, Irvine, CA 92697, USA 3
Chemistry and Dynamics Branch, NASA Langley Res. Center, Hampton, VA 23681, USA 4
Department of Meteorology, Florida State University, Tallahassee, FL 32306, USA
Received: 19 October 2007 – Accepted: 13 November 2007 – Published: 28 November 2007 Correspondence to: S. Y. Kim (sk@gust.sr.unh.edu)
ACPD
7, 17367–17400, 2007
Flight 13 case study during the NASA INTEX-NA campaign S. Y. Kim et al. Title Page Abstract Introduction Conclusions References Tables Figures ◭ ◮ ◭ ◮ Back Close
Full Screen / Esc
Printer-friendly Version Interactive Discussion
Abstract
A case study of convective outflow from the United States (U.S.) was examined using airborne measurements from NASA DC-8 flight 13 during the Intercontinental Chemi-cal Transport Experiment – North America (INTEX-NA). Mixing ratios of methane (CH4) and carbon monoxide (CO) at 8–11 km altitude over the North Atlantic were elevated to 5
1843 ppbv and 134 ppbv respectively, while those of carbon dioxide (CO2) and carbonyl
sulfide (COS) were reduced to 372.4 ppmv and 411 pptv respectively. In this region, ur-ban and industrial influence was evidenced by elevated mixing ratios and good linear relationships between urban and industrial tracers compared to North Atlantic back-ground air. Moreover, low mixing ratios and a good correlation between COS and CO2 10
showed a fingerprint of terrestrial uptake and minimal dilution during rapid transport over a 1–2 day time period. Analysis of synoptic conditions, backward trajectories, and photochemical aging estimates based on C3H8/C2H6strongly suggested that elevated
anthropogenic tracers in the upper troposphere of the flight region were the result of fast transport via convective uplifting of boundary layer air over the southeastern U.S. This 15
mechanism is supported by the similar slopes values of linear correlations between long-lived (months) anthropogenic tracers (e.g., C2Cl4 and CHCl3) from the flight re-gion and the planetary boundary layer in the southeastern U.S. In addition, the aircraft measurements suggest that outflow from the U.S. augmented the entire tropospheric column at mid-latitudes over the North Atlantic. Overall, the flight 13 data demonstrate 20
a pervasive impact of U.S. anthropogenic emissions on the troposphere over the North Atlantic.
1 Introduction
Continental outflow plays an important role in influencing the chemical environment of the remote troposphere through long-range transport of natural and anthropogenic 25
ACPD
7, 17367–17400, 2007
Flight 13 case study during the NASA INTEX-NA campaign S. Y. Kim et al. Title Page Abstract Introduction Conclusions References Tables Figures ◭ ◮ ◭ ◮ Back Close
Full Screen / Esc
Printer-friendly Version Interactive Discussion
EGU NASA field campaigns such as PEM-WEST B and TRACE-P have characterized the
chemical composition of Asian outflow (Talbot et al.; 1997; Blake et al., 2003; Bartlett et al., 2003). Moreover, Asian dust and anthropogenic pollutants via Pacific trans-port can impact air quality in the U.S. (DeBell et al., 2004; Jaffe et al., 1999, 2003). Recently, long-range transport of Saharan dust over the Pacific route to western North 5
America has been documented in the middle troposphere (McKendry et al., 2007). One important component of the continental outflow over the north Pacific (Talbot et al., 1996a, 1997) and south Atlantic (Talbot et al., 1996b) basins is wet convective lifting of air masses over the continent with subsequent enhancement in mixing ratios of insoluble trace gases in downwind areas over the ocean at altitudes above 8 km. For 10
example, over the north Pacific Crawford et al. (2003) reported enhanced mixing ratios of CO in the entire 1–11 km vertical column of a cloud impacted area during TRACE-P. A case of deep convective lofting was also obtained during TRACE-A, where a NASA DC-8 flight in the vicinity of a meso-scale complex moving across burning Brazilian savannah measured high levels of biomass combustion products in the middle-to-upper 15
troposphere (Bartlett et al., 1996; Pickering et al., 1996). These scenarios are highly conducive to long-range transport of pollutants due to faster zonal winds aloft and reduced photochemical reactivity.
Unlike Asian outflow which has been characterized extensively by combustion trac-ers, a large suite of nonmethane hydrocarbons (NMHCs), and aerosol composition, 20
North America pollutant outflow over the Atlantic has focused largely on ozone (O3)
and CO (Dickerson et al., 1995; Mao et al., 2006; Millet et al., 2006; Parrish et al., 1993). In the Northeastern U.S. a primary mechanism for continental outflow is a warm conveyor belt (WCB) transport where a mature cyclone lifts air masses from the boundary layer up into the westerly flow in the upper troposphere (Cooper et al., 2001). 25
The U.S. plumes lofted to the free troposphere by the WCB can affect air quality in Eu-rope within a few days (Stohl et al., 2003). An extensive field campaign linked elevated trace gases mixing ratios in the lower troposphere over Scandinavia including Alpine areas, to polluted air that was lifted into the free troposphere by the WCB over the
east-ACPD
7, 17367–17400, 2007
Flight 13 case study during the NASA INTEX-NA campaign S. Y. Kim et al. Title Page Abstract Introduction Conclusions References Tables Figures ◭ ◮ ◭ ◮ Back Close
Full Screen / Esc
Printer-friendly Version Interactive Discussion ern U.S. (Huntrieser et al., 2005). A recent modeling study suggested that in summer
air masses in the central and southeastern U.S. may be lofted to the free troposphere by convection followed by export to the North Atlantic by the semi-permanent anticy-clone (Li et al., 2005). They also pointed out that U.S. regions with the most frequent occurrence of deep convection were the Midwest, the Gulf Coast, and the East Coast. 5
The International Consortium for Atmospheric Research on Transport and Transfor-mation (ICARTT) field campaign was designed and conducted to gain a better under-standing of factors influencing large-scale air quality over North America, the North At-lantic, and western Europe (Fehsenfeld et al., 2006). ICARTT measurement platforms used for studying intercontinental transport included aircraft, ship, satellites, sondes, 10
autonomous balloons, and ground sites that were all operational during July-August 2004. Here we present a case study of convective uplifting of polluted air to the free troposphere over the southeastern U.S. coupled with rapid transport to the North At-lantic. We utilized data obtained primarily on flight 13 of the NASA DC-8 during the Intercontinental Chemical Transport Experiment – North America (INTEX-NA) compo-15
nent of ICARTT (Singh et al., 2006).
2 Methods
2.1 Measurement data
INTEX-NA was performed over North America and the adjacent North Atlantic Ocean using the NASA DC-8 aircraft to examine the large-scale distribution of trace gases 20
and aerosols associated with the North America continent (Singh et al., 2006). This study focused on flight 13 which was conducted on 28 July 2004 with one of the main objectives being sampling of U.S. continental outflow. The DC-8 took off at about 12:00 UTC from the Pease International Airport in New Hampshire and landed at around 22:00 UTC, yielding a flight duration of about 10 h. The flight route, shown 25
ACPD
7, 17367–17400, 2007
Flight 13 case study during the NASA INTEX-NA campaign S. Y. Kim et al. Title Page Abstract Introduction Conclusions References Tables Figures ◭ ◮ ◭ ◮ Back Close
Full Screen / Esc
Printer-friendly Version Interactive Discussion
EGU stationary front and near the southern end of a cold front (Figs. 1 and 2).
A brief description of the overall measurement package on the DC-8 was provided previously in Singh et al. (2006). The principle trace gases of interest here were CO, CH4, CO2, COS, and a suite of NMHCs and halocarbons which are archived and
avail-able athttp://www-air.larc.nasa.gov/cgi-bin/arcstat. The majority of the data, including 5
CO and CH4, were obtained by the University of California – Irvine (UC-Irvine) (Blake et
al., 2003; Colman et al., 2001). Carbon dioxide was measured as described by Vay et al. (1999). Only flight 13 data collected over the Atlantic east of 70◦W was used in our
analysis. We used relationships between CH4, CO, CO2, and COS in boundary layer
air (<2 km) over the southeastern U.S., determined using all the INTEX-NA DC-8 flight
10
data (flights 6, 7, 10, 12, 16, and 19) obtained over the continent at latitudes<35◦N, to
understand the vertical distribution of trace gases along the flight 13 track. These are all long-lived trace gases, with CO having the shortest lifetime of about two months in summer due to reaction with hydroxyl radical (OH). Thus, these trace gases are photo-chemically stable so that dynamical process are the most important factors determining 15
their distribution downwind from North America on the transport time scales important to this analysis. NMHCs and halocarbons used in this study were mainly the urban and industrial tracers, C2Cl4, i-C5H12, CHCl3, and C6H6 (Wang et al., 1995; Chan et
al., 2006; Aucott et al., 1999; Na et al., 2001), and a combustion tracer, C2H2.
We also utilized “Measurement of OZone, water vapor, carbon monoxide and nitro-20
gen oxides by AIrbus in-service airCraft (MOZAIC)” to examine the vertical distribution of key trace gases over the east coast during the time period of flight 13. MOZAIC uses autonomous instruments loaded into five long-range passenger airliners, namely AIRBUS 340–300 aircraft. Of particular interest here was the four second data ob-tained on a flight from Vienna, Austria to Washington, D.C. (USA) on 28 July 2004. 25
This dataset provided additional information on the vertical profiles of O3and CO over the eastern U.S. between 60◦W–78◦W and 38◦N–48◦N obtained during descent into the Washington area.
ACPD
7, 17367–17400, 2007
Flight 13 case study during the NASA INTEX-NA campaign S. Y. Kim et al. Title Page Abstract Introduction Conclusions References Tables Figures ◭ ◮ ◭ ◮ Back Close
Full Screen / Esc
Printer-friendly Version Interactive Discussion in the northeastern U.S. for two days in July (27 and 28) 2004 were also utilized in this
study. The NMHCs and CO data from Thompson Farm (TF) in Durham, New Hamp-shire (23 m elevation, 43.11◦N and 70.95◦W) were 40 minute averages and those from the second location on Appledore Island (AI), ME (sea level, 42.97◦N and 70.62◦W) were 1 h averages (Sive et al., 2005; Zhou et al., 2005). Methane and CO in ambient 5
air were surveyed for selected U.S. cities by the UC-Irvine group using canisters (Baker et al., 2007). Specifically, we used monthly average values for August collected in the southeastern U.S. cities of Birmingham, Alabama and Barton Rouge, Louisiana during 2001, and Charlotte, North Carolina and Knoxville, Tennessee in 2002, and El Paso, Texas in 2003.
10
2.2 Backward trajectories and photochemical ages
Backward trajectories in combination with an analysis of synoptic conditions and photo-chemical ages can be an effective method to understand air mass transport. Kinematic backward trajectories were calculated at one minute time steps throughout the INTEX-NA flight series by Florida State University (http://fuelberg.met.fsu.edu/research/intexa/ 15
realtime/). The ratio of C3H8/C2H6was used for comparing the relative photochemical
age of air masses (McKeen and Liu, 1993; Parrish et al., 2004). To assess the relative transport time from the boundary layer in the southeastern U.S. to the flight legs over the North Atlantic, we utilized the chemical clock provided by the reactivity of C3H8and
C2H6with OH. Equation (1) was used to estimate the transport time:
20 ∆t = ln(r(C3H8)/r(C2H6))0 (r(C3H8)/r(C2H6))t (kC3H8− kC2H6)[OH] (1)
Here, (r(C3H8)/r(C2H6])0is the ratio of the mixing ratios of the two compounds in the
boundary layer, (r(C3H8)/r(C2H6))t is the same ratio at a later time t for each of the flight leg regions of interest,k is the OH reaction rate constant, and [OH] is OH
con-centration. The DC-8 flight data showed that (r(C H )/r(C H )) had a mean value of 25
ACPD
7, 17367–17400, 2007
Flight 13 case study during the NASA INTEX-NA campaign S. Y. Kim et al. Title Page Abstract Introduction Conclusions References Tables Figures ◭ ◮ ◭ ◮ Back Close
Full Screen / Esc
Printer-friendly Version Interactive Discussion
EGU 0.36±0.15 (n=66) for the boundary layer over the southeastern U.S. (hereinafter SBL).
As input for the estimates we used the measured OH mixing ratios, ambient pres-sures, and air temperatures measured on the DC-8 flights in the SBL. Mean values were 0.18 pptv for OH, 0.92 atm for pressure, and 294 K for temperature, which resulted in a concentration of 4.1×10⁶OH molecules cm−3 in the SBL. We used rate constants 5
for C3H8 and C2H6 of 1.1×10⁻¹²cm 3
molecule −1s−1 and 2.3×10⁻¹³cm3molecule
−1s−1 respectively at 294 K (Sander et al., 2003).
3 Synoptic meteorology
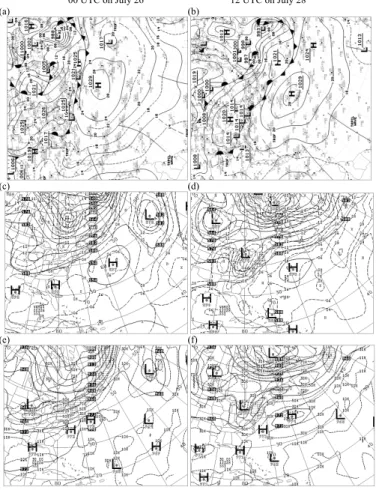
Shown in Fig. 2a–f are maps of sea level pressure (SLP), 500 and 300 hPa geopotential heights for 00:00 UTC on 26 July and 12:00 UTC on 28 July. Together these define 10
the surface, middle and upper tropospheric circulation patterns across the U.S. on the flight day and 60 h prior to it. According to the 6 hourly analyzed SLP, a Canadian Low with cold and warm fronts was situated north of Quebec, Canada at 12:00 UTC on 21 July. This low pressure system was moving eastward with the warm front evolving into an occluded front over the North Atlantic at 12:00 UTC on 23 July, and the cold front 15
remaining largely over the eastern U.S. through 00:00 UTC on 24 July.
A stationary front was located over the eastern U.S. and the western Atlantic starting at 12:00 UTC on 24 July (Fig. 2a and b) and it persisted throughout the duration of flight 13. It should be noted that several small short-lived cyclones were generated in association with the stationary front. In particular, one of these small disturbances 20
was generated over the southeastern U.S. at 06:00 UTC on 26 July and matured into a cyclone which propagated to the Virginia area over the following 24 h. Accompanying the cold front associated with this small cyclone was a weak WCB over the Southeast. These disturbances and associated WCB are conducive to lifting of boundary layer air masses to the free troposphere.
25
The 500 hPa geopotential heights at 12:00 UTC on 23 July showed that a trough associated with the Canadian Low was situated over the northern Great Plains. This
ACPD
7, 17367–17400, 2007
Flight 13 case study during the NASA INTEX-NA campaign S. Y. Kim et al. Title Page Abstract Introduction Conclusions References Tables Figures ◭ ◮ ◭ ◮ Back Close
Full Screen / Esc
Printer-friendly Version Interactive Discussion trough traveled across the Midwest (Fig. 2c) and reached southern Canada in the
vicin-ity of the Great Lakes at 12:00 UTC on 28 July (Fig. 2d). It subsequently moved northeastward relatively fast and weakened over the North Atlantic Ocean. While the influence of this trough existed over the U.S. until 00:00 UTC on 30 July, another trough formed over southern Canada at 12:00 UTC on 28 July (Fig. 2d).
5
The flow patterns at the 300 hPa geopotential height and isotachs resembled those at the 500 hPa level (Fig. 2e and f). Zonal wind speeds on the 300 hPa level were generally 5–25 m/s over the U.S., and increased to>35 m/s in the jet stream over the
northeastern U.S. In general, the jet stream is associated with upward motion (Holton, 1995), which facilitates air mass movement from lower altitudes to the upper tropo-10
sphere with subsequent transport over long distances. Overall, the maps of geopoten-tial height at 500 hPa and 300 hPa together suggested a dynamic westerly flow regime in the mid-to-upper troposphere.
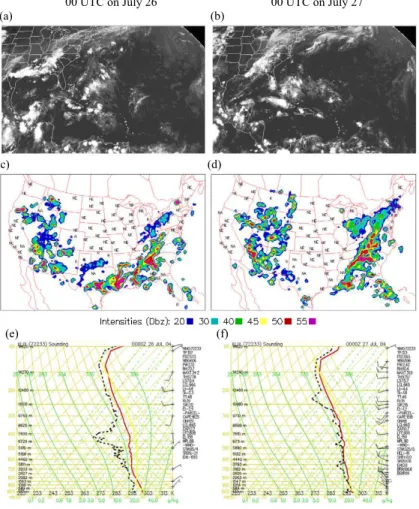
Manually digitized radar (MDR), GOES infrared imagery, and skewT and log P
dia-grams at 00:00 UTC on 26 July and 27 suggested a strong possibility of upward trans-15
port of air masses from the surface during that time period (Fig. 3a–f). GOES infrared imagery (Fig. 3a and b) revealed the presence of high clouds over the eastern U.S. ex-cept in coastal regions, extending from Texas eastward to western South Carolina and northeastward to New England. The area of high clouds coincided with heavy precipi-tation indicated by the MDR (Fig. 3c and d). Images of other times through 00:00 UTC 20
on 28 July were also examined, and they uniformly suggested similar conditions con-ducive to convection in this same region.
Furthermore, SkewT diagrams at individual locations from the eastern U.S. verified
the occurrence of convection. The convective available potential energy (CAPE) and Lifted Index (LI) on the Skew T diagrams (Fig. 3e and f) from the Slidell, Louisiana
25
(30.33◦N and 89.82◦W), during July 25 to 27 were used to diagnose the presence of
local convection. The CAPE values within the range of 1000–2500 J/kg and LI less than −4, all falling into the criteria for instable and convective atmospheric conditions (http://www.theweatherprediction.com/severe/indices/).
ACPD
7, 17367–17400, 2007
Flight 13 case study during the NASA INTEX-NA campaign S. Y. Kim et al. Title Page Abstract Introduction Conclusions References Tables Figures ◭ ◮ ◭ ◮ Back Close
Full Screen / Esc
Printer-friendly Version Interactive Discussion
EGU In summary, our synoptic analysis suggested that a stationary front associated with a
Canadian cyclone over the eastern U.S. continuously induced convection several days before 28 July, which facilitated fast transport of air masses from the boundary layer to the free troposphere. The WCB over the southeastern U.S. also contributed to the vertical transport as indicated by the spawning of small cyclones in association with 5
the stationary front. All meteorological evidence consistently pointed to the occurrence of convection combined with fast eastward transport in the free troposphere over the eastern U.S. during the two days prior to flight 13. In the following sections of this paper we examined the chemical signatures measured at high altitude over the Atlantic to provide support for the meteorological analysis conducted for flight 13.
10
4 Notable chemical characteristics of flight 13
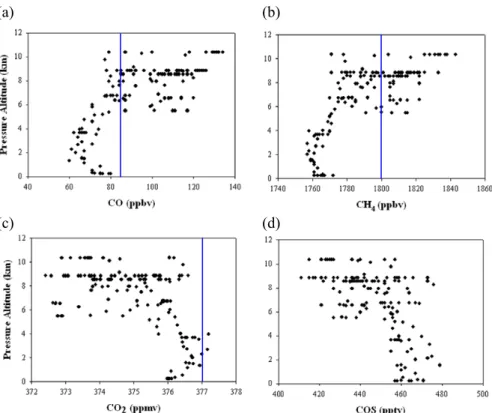
The vertical distribution of mixing ratios of CO, CH4, CO2, and COS is displayed for the
entire flight in Fig. 4. Mixing ratios of CO near the surface were 70 to 80 ppbv followed by a decrease to the lowest values of ∼60 ppbv at 2 km. At altitudes between 2 and 5 km, CO increased to 80 ppbv, and then continued to rise quickly above 5 km varying 15
over a range of 78–134 ppbv at altitudes >8 km. The vertical profile of CH4 tracked
CO closely, which exhibited levels of 1760 to 1770 ppbv near the surface followed by a slight decrease at 2 km. Between 2 and 5 km CH4again hovered around 1770 ppbv. An
increasing trend with altitude was accelerated above 5 km, where CH4 was enhanced
up to 1843 ppbv at 8–11 km. 20
The vertical profiles of CO2 and COS showed trends opposite those of CO and
CH4. Mixing ratios of CO2 were ∼376 ppmv near the surface, and then increased to
377 ppmv at 2 km followed by a decrease to ∼375.5 ppmv between 2 and 5 km and further decrease above 5 km. The minimum value of 372.4 ppmv was observed in the 8–11 km region. COS tracked CO2closely with mixing ratios varying over 455–475 pptv
25
near the surface, increasing to 480 pptv at 2 km, and then decreasing gradually to 455 pptv between 2 and 5 km. The lowest COS mixing ratios near 410 pptv were found
ACPD
7, 17367–17400, 2007
Flight 13 case study during the NASA INTEX-NA campaign S. Y. Kim et al. Title Page Abstract Introduction Conclusions References Tables Figures ◭ ◮ ◭ ◮ Back Close
Full Screen / Esc
Printer-friendly Version Interactive Discussion at 8–11 km.
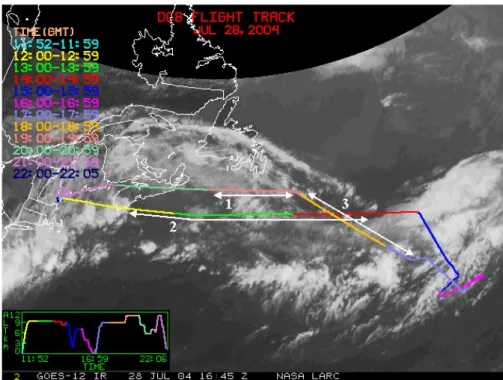
To understand the causes for the high mixing ratios of CO and CH4that occurred in the 8–11 km altitude region, we identified three time periods with the most enhanced levels (Fig. 1). These occurred on constant altitude flight legs, with the first region at 10.4 km over the time period of 19:00–20:00 UTC, the second at 8.9 km during 12:20– 5
14:40 UTC, and the third at 8.5 km over 17:30–19:00 UTC. All other segments of the flight are referred to as “Outside” (i.e., outside of the three regions), and they are dis-cussed in Sect. 5.
First, we used trace gas data from the NOAA Global Monitoring Division (GMD) mon-itoring site on Bermuda (http://www.esrl.noaa.gov/gmd/dv/ftpdata.html) and from Mace 10
Head, Ireland (Simmonds et al., 2006) to determine representative background mixing ratios over the North Atlantic. The monthly average surface mixing ratio at Bermuda in July 2004 was 1800 ppbv for CH4, 86 ppbv for CO, and 377 ppmv for CO2. The mean
mixing ratio of C2Cl4 at Mace Head, Ireland was 4.94±0.06 pptv from measurements over the period of 2000 to 2004 (Simmonds et al., 2006). In two rural areas of the U.S., 15
annual mean surface mixing ratios of COS from February 2002 to February 2005 were 444±8 pptv in Wisconsin and 441±8 pptv at Harvard Forest, Massachusetts (Montzka et al., 2007).
Statistics are provided in Table 1 to describe the chemical environment of the three regions of enhanced mixing ratios. CO, C2H2and C2Cl4exhibited mean mixing ratios
20
of 127 ppbv, 117 pptv and 10.2 pptv, respectively, in region 1, 106 ppbv, 93 pptv and 5.1 pptv in region 2, and 109 ppbv, 94 pptv and 5.5 pptv in region 3. Correspondingly, in regions 1, 2, and 3 the mean value of CH4was 1831 ppbv, 1805 ppbv, and 1808 ppbv
respectively. Compared to the background levels over the North Atlantic, the mean levels of CH4, CO, and C2Cl4 in regions 1, 2, and 3 were higher by 0–1.7%, 23–48%,
25
and 3.3–106% respectively. Mixing ratios of CS2, whose primary source is chemical
industrial processing (Chin and Davis, 1993), were mainly less than 4 pptv in each region with occasional levels up to 14 pptv. Overall, the three regions showed a clear influence of urban combustion emissions.
ACPD
7, 17367–17400, 2007
Flight 13 case study during the NASA INTEX-NA campaign S. Y. Kim et al. Title Page Abstract Introduction Conclusions References Tables Figures ◭ ◮ ◭ ◮ Back Close
Full Screen / Esc
Printer-friendly Version Interactive Discussion
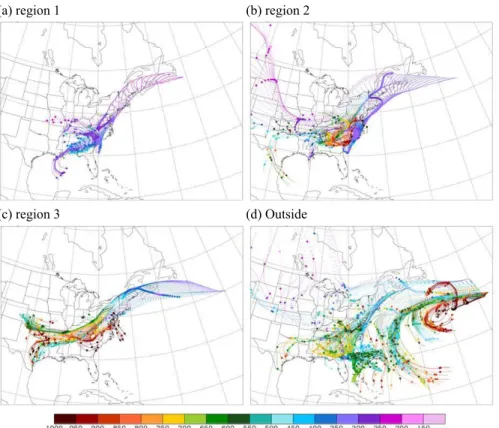
EGU Air mass transport was investigated using backward trajectories combined with
pho-tochemical age estimates of air masses in regions 1–3. Kinematic 5-day backward trajectories arriving in each of the three regions are presented in Fig. 5. Since many of the air masses appeared to meander over the southeastern U.S. for several days, 10-day backward trajectories (not shown) were used to examine the long-range trans-5
port of these air masses to the U.S. In the case of region 1, these trajectories showed mainly two origins, with one from over the eastern Pacific/U.S. west coast and the other from the Gulf of the Mexico. These air masses arrived over the southeastern U.S. in the mid-to-upper troposphere, and then spent ∼4 days over the southeastern U.S. in the altitude region of 550 to 300 hPa. Eventually they were transported in<20 h from
10
over the Virginia area at 00:00 UTC on 28 July to region 1 in the upper troposphere (>350 hPa). The mean value of C3H8/C2H6 was 0.23±0.02 in region 1, and
photo-chemical aging of an SBL air mass arriving in region 1 was 1.5 days based on Eq. (1). The backward trajectories for region 2 illustrated a complex dynamical situation. In this case there were a large number of trajectories indicating that the air spent 3–4 15
days over the southeast U.S. at altitudes ranging from near the surface to 500 hPa. In addition, approximately 13% of the trajectories followed zonal westerly flow at 300 hPa which intercepted the air masses residing over the southeast U.S. for several days. Ten-day backward trajectories indicated that the inflowing air had arrived from over the northwestern U.S., the North Pacific, and the Gulf of the Mexico. On 27 July this 20
mixture of air masses was quickly advected over the Northeast, and arrived at the flight altitude on 28 July. The value of C3H8/C2H6 was 0.20±0.04 in this region, and the
photochemical aging of an SBL air mass arriving in region 2 was 2 days.
Air masses transported to region 3 had their origin over mainly the south central and southeastern U.S. It appears that boundary layer air over eastern Texas was advected 25
at low level to the southeastern states and mixed with SBL air during vertical lifting on July 27 and mid-tropospheric air masses that originated over the Oklahoma/Colorado area. On the 28th the air passed over the Northeast in the mid-troposphere and arrived at the flight altitude of 8.5 km nearly coincident in time with the region 1 air masses.
ACPD
7, 17367–17400, 2007
Flight 13 case study during the NASA INTEX-NA campaign S. Y. Kim et al. Title Page Abstract Introduction Conclusions References Tables Figures ◭ ◮ ◭ ◮ Back Close
Full Screen / Esc
Printer-friendly Version Interactive Discussion The value of C3H8/C2H6 was 0.22±0.03 in region 3, and photochemical aging of an
SBL air mass arriving in this region was 1.7 days.
Backward trajectories and the synoptic weather patterns indicated that air masses sampled in regions 1–3 were influenced by SBL air transported vertically through con-vection and the WCB that developed in association with the stationary front. Ultrafine 5
aerosol showed distinct mean differences of 10 172 particles/cm3 in region 1, 1482 particles/cm3in region 2, and 1998 particles/cm3in region 3. A high degree of correla-tion between enhanced condensacorrela-tion nuclei number densities and mixing ratios of CO, CH4, NO, and OH has been observed in air masses influenced by deep convection
over the central U.S. (Twohy et al., 2002). However, we did not find such correlation 10
in the three regions in spite of the very high concentrations of ultrafine aerosols and increased mixing ratios of CO. Although our results do not parallel those of Twohy et al. (2002), our analysis implies an impact of convective outflow in regions 1–3. In addi-tion, a diagnostic indicator of wet convection is the ratio of CH3OOH/H2O2, since H2O2 is removed preferentially by wet scavenging compared to CH3OOH resulting in ratio
15
values >1 (Talbot et al., 1996b). The flight 13 measurements showed higher mean
values of CH3OOH/H2O2which were 0.85, 0.80, and 0.50 in regions 1–3, respectively, than a value of 0.38 from the SBL. This strongly suggests the likelihood of convection as a primary mechanism for the re-distribution of trace gases as documented by the flight 13 data.
20
The photochemical ages in regions 1, 2, and 3 are reasonably similar to the trans-port times deduced from the backward trajectories which corroborates fast transtrans-port with minimal apparent dilution of SBL air by aged background air. Evidence for min-imal mixing is provided by similar mixing ratios of CHCl3 between regions 1–3 (9.4–
10.5 pptv) and SBL (10.6 pptv). Additional evidence is the preserved low mixing ratios 25
of CO2and COS, which are typical of boundary layer air influenced by biospheric ac-tivity during the growing season. The mean mixing ratios of CO2 in regions 1–3 were
between 373.5 and 375 ppmv, and these were lower by 0.6–1% than the background mixing ratio from surface measurements at Bermuda. In comparison, mean mixing
ACPD
7, 17367–17400, 2007
Flight 13 case study during the NASA INTEX-NA campaign S. Y. Kim et al. Title Page Abstract Introduction Conclusions References Tables Figures ◭ ◮ ◭ ◮ Back Close
Full Screen / Esc
Printer-friendly Version Interactive Discussion
EGU ratios of COS in regions 1, 2, and 3 (426–440 pptv) were closer to values found in the
SBL over the U.S. The low mixing ratios of COS found in the upper troposphere during flight 13 is indicative of efficient terrestrial COS uptake in the SBL (Sandoval-Soto et al., 2005).
The backward trajectories suggested that the air masses arriving in the three study 5
regions spent 1–4 days over the southeastern U.S. and were then transported to the Northeast and upward by fast zonal flow in the middle and upper troposphere on 27–28 July. If the transport from the SBL to the flight regions was indeed rapid, then the effect of dilution and in situ chemical processing can be small, and subsequently the mixing ratios of trace gases in the source and flight regions should be similar. Mixing ratios 10
of tracers in the SBL were thus compared with upper tropospheric values (Table 1). In general, industrial or urban tracers in the SBL exhibited higher levels than those in each flight region except for C2Cl4. This result is reasonable since some dilution
would be expected during transport of SBL air to the upper troposphere. Enhanced mixing ratios of other urban tracers (e.g., C2Cl4 and CHCl3) and high concentrations
15
of ultrafine aerosol were also observed as evidence of urban impacted air masses in the upper troposphere. In the apparent SBL source region there are significant urban and industrial sources based on the emissions map of CHCl3 (Aucott et al.,
1999). The region is also widely covered with abundant vegetation as evidenced by isoprene emissions (Fiore et al., 2005), which accounts for uptake of COS and CO2 20
and consequently their reduced mixing ratios.
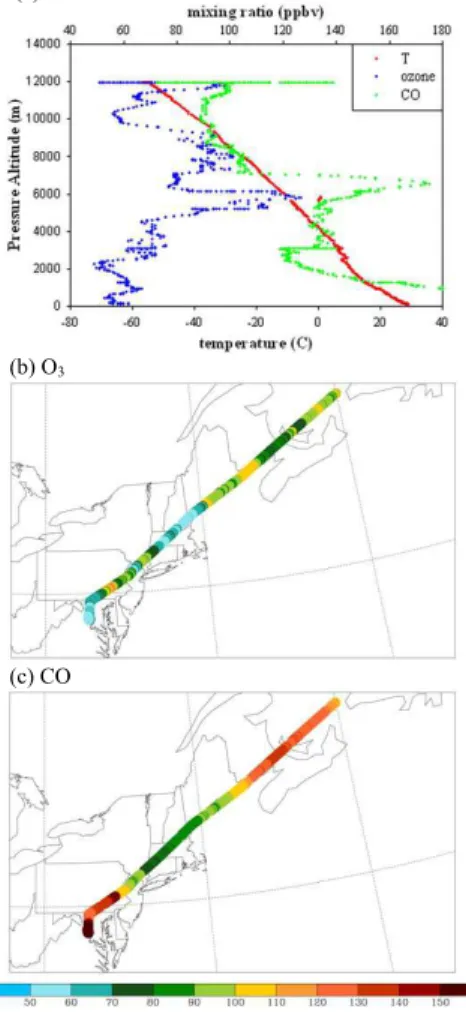
MOZAIC measurements were used as an independent source of data on air mass composition over the Atlantic and eastern U.S. One of the instrumented flights into Washington, D.C. from Europe on July 28 was essentially routed through the region of interest here. MOZAIC data collected at 16:20–19:00 UTC on July 28 sampled the up-25
per troposphere where the rapid transport of SBL air masses seemingly occurred from 00:00 UTC on 27 July to 16:00 UTC on 28 July. The MOZAIC CO and O3 spatial
dis-tributions are shown in Fig. 6. According to the backward trajectories, region 1 of flight 13 and the MOZAIC sampling route overlapped geographically over New Brunswick,
ACPD
7, 17367–17400, 2007
Flight 13 case study during the NASA INTEX-NA campaign S. Y. Kim et al. Title Page Abstract Introduction Conclusions References Tables Figures ◭ ◮ ◭ ◮ Back Close
Full Screen / Esc
Printer-friendly Version Interactive Discussion Nova Scotia, and the adjacent Oceanic area. The MOZAIC data showed mixing ratios
of CO as large as 140 ppbv in the upper troposphere (∼12 km). Ozone was between 74 and 110 ppbv for the data points with CO>100 ppbv, and a negative slope of −0.6
was identified for the O3-CO correlation. Coincident high levels of CO and O3 gener-ally indicate polluted air masses, while high O3(O3>100 ppbv) alone suggests a weak
5
stratospheric influence. These data together with the flight 13 measurements support a broad influence of U.S. outflow to the upper troposphere over the Atlantic Ocean by the deep trough system. Upon descent into a polluted layer over Washington D.C., CO mixing ratios up to 175 ppbv of were identified between 5 and 7 km (39.9–40.5◦N, and 75.6–76.6◦W). This polluted layer likely originated in the boundary layer over the 10
U.S. but did not get entrained in the flow pathway of the flight 13 upper tropospheric air masses. However, the HYSPLIT backward trajectories were not able to resolve this because of the inadequate vertical resolution.
We explored the possibility of an Asian impact on the flight 13 upper tropospheric study area as found on flights 3, 8, 10, 15 and 20 by Liang et al. (2007). Halon-15
1211 (CBrClF2), an important tracer of Asian polluted outflow (Blake et al., 2003),
averaged 4.3 pptv over the flight 13 route, similar to background levels in boundary layer over the Asia from TRACE-P, 4.3±0.04 pptv for CBrClF2 (Barletta et al., 2006).
Our backward trajectories analysis presented earlier and the key tracers indicated that Asian emissions did not affect directly the flight 13 region, and suggests that the outflow 20
from the U.S. dominated the pollution in the study area.
5 Outside air mass chemical composition
The average chemical composition of the Outside air, excluding regions 1–3, can be summarized to have an average composition of 84 ppbv CO, 375.4 ppmv CO2,
1781 ppbv CH4, 453 pptv COS, 45 pptv C2H2, 3.4 pptv C2Cl4, and 53 ppbv O3. To
25
find out whether the Outside chemical composition was similar to the North Atlantic background air, we again compared the airborne measurements with those from the
ACPD
7, 17367–17400, 2007
Flight 13 case study during the NASA INTEX-NA campaign S. Y. Kim et al. Title Page Abstract Introduction Conclusions References Tables Figures ◭ ◮ ◭ ◮ Back Close
Full Screen / Esc
Printer-friendly Version Interactive Discussion
EGU NOAA GMD monitoring site on Bermuda and Mace Head (Simmonds et al., 2006). The
results of this comparison showed that CH4, CO, C2Cl4 and CO2 were lower than at
Bermuda and Mace Head by 1.1%, 2.4%, 30.6%, and 0.4% respectively. Comparison of the mean values indicated that the Outside air was not affected by fresh urban and industrial source emissions. However, the mixing ratios of trace gases in the Outside 5
air varied over wider ranges than those in regions 1, 2, and 3. In fact, maximum mixing ratios of CS2, C6H6, and C2H2were even larger than those in the three regions.
Backward trajectories for the Outside region indicated the possibility of air masses with diverse origins (Fig. 5), which were categorized qualitatively into four source re-gions. The fractional contribution for each source region was estimated by comparison 10
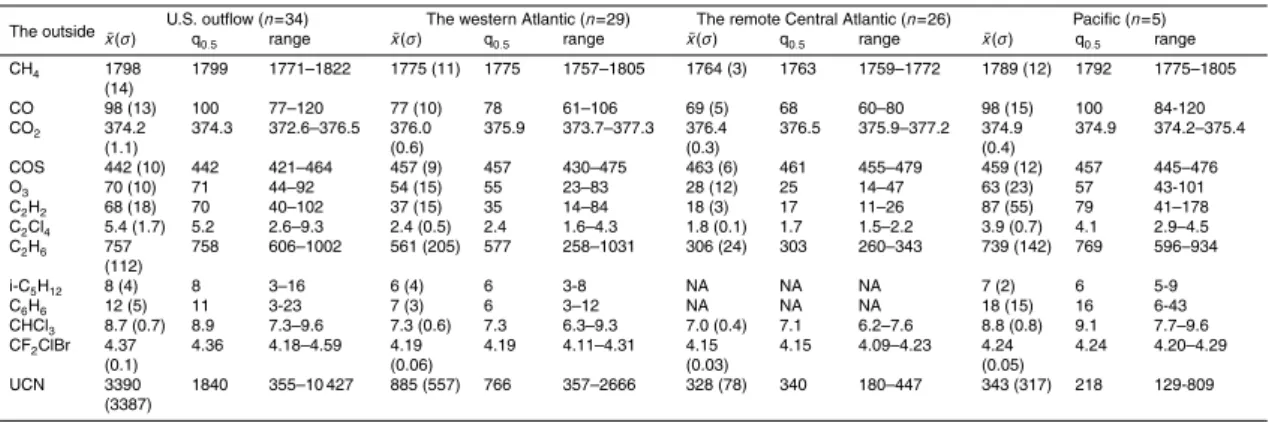
of the number of trajectories from each area to the total for the Outside. It was found that ∼44% of air masses in the Outside area were from U.S. outflow, ∼28% originated from the western Atlantic, ∼20% from the remote Central Atlantic, and ∼8% from over the North Pacific.
Chemical environments corresponding to the four source regions were summarized 15
in Table 2. The average mixing ratio of CO, C2H2and C2Cl4 were highest at 98 ppbv,
68 pptv and 5.4 pptv respectively in U.S. outflow, and lowest at 69 ppbv, 18 pptv and 1.8 pptv in air from the remote Central Atlantic. The average levels of O3, CH4, selected
anthropogenic NMHCs, and ultrafine aerosol followed the same source distribution. For example, the average mixing ratio of O3 showed the highest level of 70 ppbv in 20
the U.S. outflow, and the lowest of 28 ppbv in air masses from the remote Central Atlantic. However, CO2and COS exhibited opposite variation, with higher mixing ratios
from source regions far away from the North American continent. Specifically, the average mixing ratios of CO2 and COS were 374.2 ppmv and 442 pptv respectively in
the U.S. outflow, 376.0 ppmv and 457 pptv in air from the western Atlantic, 376.4 ppmv 25
and 463 pptv from over the remote Central Atlantic, and 374.9 ppmv and 459 pptv from the Pacific. These results clearly show the role of the terrestrial biosphere in modulating CO2and COS in the troposphere downwind of a continental area.
ACPD
7, 17367–17400, 2007
Flight 13 case study during the NASA INTEX-NA campaign S. Y. Kim et al. Title Page Abstract Introduction Conclusions References Tables Figures ◭ ◮ ◭ ◮ Back Close
Full Screen / Esc
Printer-friendly Version Interactive Discussion
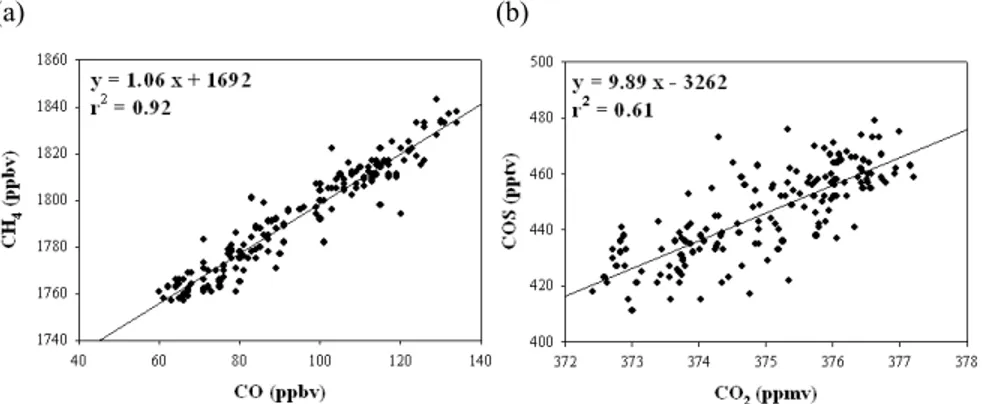
6 Chemical characterization using correlation analysis
The slope of the linear regression between correlated chemical compounds can be a useful source identifier (Xiao et al., 2004). Based on the similar vertical distributions recognizable from Fig. 4, correlation of the pairs CH4-CO and COS-CO2was examined
using all data from flight 13 (Fig. 7). Carbon monoxide and CH4 were correlated
re-5
markably well atr2=0.92. This implies that anthropogenic sources had a major impact on CH4mixing ratios at all altitudes sampled on flight 13 over the North Atlantic. The correlation between COS and CO2exhibited anr
2
=0.61, likely driven to a large extent by their close association with vegetative uptake.
Correlations between source indicators and CO/CO2were examined further for each 10
region and the results are presented in Table 3. The slope of CH4-CO had a value of
0.94 in region 1 (r2=0.84), 0.97 in region 2 (r2=0.80), and 0.67 in region 3 (r2=0.45). These values are reasonably close to the slope of 0.84 that was obtained for urban and industrial emissions by Harriss et al. (1994). To corroborate the urban and industrial influence, relationships between CO and a number of anthropogenic tracers were also 15
examined. Compounds that correlated with CO at r2>0.5, are CHCl3 and C2H2 in
region 1, CHCl3, C2Cl4, i-C5H12, and C2H2 in region 2, and CHCl3, C2Cl4, i-C5H12, C6H6 and C2H2 in region 3. This evidence clearly points to a significant influence of
urban, industrial, and combustion sources in all three regions.
To verify the SBL origin of the polluted air on flight 13, relationships between source 20
indicators and CO in the SBL were calculated and the values of r2 and correlation slopes are shown in Table 3. The slopes of CHCl3-CO and C2Cl4-CO in the SBL were
similar to those in the three flight regions, providing support for the SBL as the source region of the air masses encountered on the flight route. Note that slopes of i-C5H10
-CO, C6H6-CO and C2H2-CO in the SBL were much higher than those observed on
25
flight 13. For example, the slope of i-C5H10-CO in each region of flight 13 was between 0.19 and 0.33 compared to 0.82 in the SBL. The lifetimes of C2H2, C6H6, i-C5H12,
ACPD
7, 17367–17400, 2007
Flight 13 case study during the NASA INTEX-NA campaign S. Y. Kim et al. Title Page Abstract Introduction Conclusions References Tables Figures ◭ ◮ ◭ ◮ Back Close
Full Screen / Esc
Printer-friendly Version Interactive Discussion
EGU respectively. Therefore, maximum mixing ratios of short-lived i-C5H10, C6H6, and C2H2
in the SBL were much higher than on flight 13 (Table 1), which resulted in higher slope values in the SBL.
It is curious that, contrary to the tight CH4-CO correlation observed on flight 13, CH4 and CO data from city surveys in the Southeast exhibited a poor correlation (r2=0.16), 5
although the slope of CH4-CO was 0.94, nearly identical to values observed in regions
1 and 2. The slope of CH4-CO in the SBL sampled by the DC-8 was 0.70, similar
to region 3, but with much better correlation (r2=0.73) than the city surveys. The difference may be related to the multi-years of data collection for the city survey versus the flight 13 data record snapshot.
10
The slope of COS-CO2was compared between the SBL and over the North Atlantic. In the SBL CO2 was correlated with COS at r2=0.83, compared to r2=0.61 in the flight region. This difference is attributed to mixing of SBL air with ambient air while it meandered over the Southeast for several days and then during transit to the upper troposphere. The COS-CO2 slope value was 5.3 pptv/ppmv in the SBL, which was 15
almost a factor of two lower than the 9.9 pptv/ppmv value obtained from the flight 13 regions. Mixing ratios of CO2 in the SBL varied over the range 356 ppmv–380 ppmv,
which was a factor of 5 wider than the range in the flight 13 region of 372 ppmv– 377 ppmv. Similarly, the COS data showed the SBL had a factor of 2 greater variation in mixing ratios than the flight 13 data; 344 pptv–485 pptv in SBL and 411 pptv–479 pptv 20
for the flight regions. Wider ranges of CO2and COS in the SBL are due to much lower minimum values of two compounds compared to the flight route. The higher minimum values along the flight path is indicative of mixing process with the air mass types identified by our trajectory analysis. However, COS and CO2were not well correlated in regions 1 and 3, compared to region 2 and all the flight 13 data together.
25
A contribution of emissions from the Northeast to the flight regions was checked by utilizing UNH AIRMAP network data in New England. Ther2values and slopes of the correlations between selected trace gases and CO from ground-based measurements on 27–28 July (UTC) at TF and AI were very different than those shown here for flight
ACPD
7, 17367–17400, 2007
Flight 13 case study during the NASA INTEX-NA campaign S. Y. Kim et al. Title Page Abstract Introduction Conclusions References Tables Figures ◭ ◮ ◭ ◮ Back Close
Full Screen / Esc
Printer-friendly Version Interactive Discussion 13 (e.g., the slope of CH4-CO=0.28 (r
2
=0.06) at AI). Therefore, we concluded that emissions from the Northeast were not an important contributor to the elevated trace gas mixing ratios in the upper troposphere over the North Atlantic. This is consistent with our meteorological analysis which showed that the SBL was the likely primary source of pollutants in the upper troposphere
5
An important feature of the flight 13 dataset was the high degree of correlation be-tween trace gases in the Outside region. In fact, the correlations were close to, or better than, those in regions 1, 2, and 3 (e.g.,r2=0.89 for CH4-CO). This is a
surpris-ing result considersurpris-ing the diverse source regions indicated by our trajectory analysis. Typically, there is little or no correlation between most trace gases in air masses not 10
directly impacted by relatively fresh continental emissions. In this case, it appears that the entire tropospheric column over the North Atlantic during the time period surround-ing flight 13 was impacted by North American anthropogenic emissions. This region is in the direct outflow from the eastern U.S. (Parrish et al., 1993), but our analysis seems to suggest that the troposphere over the mid-latitude North Atlantic basin was 15
fumigated with U.S. pollutants in various stages of aging. This is supported by the trajectory-based partitioning of the Outside air source regions, where 44% pointed to an influence of U.S. continental outflow. Apparently, to retain their source relationships, these air masses were not mixed effectively with background marine air. The flight data demonstrate a pervasive impact of U.S. anthropogenic emissions on the mid-latitude 20
troposphere over the North Atlantic.
7 Summary
INTEX-NA, one of the components of ICARTT, was conducted over North America and the adjacent North Atlantic to investigate the distribution of trace gases and aerosols associated with emission sources in North America. The vertical distribution of trace 25
gases from DC-8 flight 13 during the campaign had mixing ratios of CH4 and CO of
ACPD
7, 17367–17400, 2007
Flight 13 case study during the NASA INTEX-NA campaign S. Y. Kim et al. Title Page Abstract Introduction Conclusions References Tables Figures ◭ ◮ ◭ ◮ Back Close
Full Screen / Esc
Printer-friendly Version Interactive Discussion
EGU reduced to 372.4 ppmv and 411 pptv respectively, in upper troposphere at 8–11 km
altitude over the North Atlantic.
The meteorology over the U.S. was identified as an ideal situation for strong convec-tive outflow for several days prior to flight 13. A stationary front, which evolved from a cold front associated with a Canadian low, existed in the eastern U.S. over the sev-5
eral days before the airborne measurements were conducted. As a result, it induced continuous convective activities and a weak WCB. In addition, a deep trough over the Midwest facilitated fast northwesterly transport that was sustained for several days prior to flight 13.
The chemical features in the upper troposphere over the North Atlantic were as 10
follows. Urban and industrial tracers such as CH4 and CO were elevated in the upper troposphere (e.g. 78 ppbv <CO<135 ppbv) and good linear relationships
be-tween the tracers (e.g. r2 for CH4–CO at region 1=0.84) showed the impact of
ur-ban/industrial emissions to the flight regions. Low mixing ratios of COS and CO2 (e.g. 372.4 ppmv<CO2<376.6 ppmv) indicated biogenic uptake at the surface in the
15
SBL with subsequent minimal dilution during the transport to the upper troposphere. Backward trajectories and photochemical aging indicated that the SBL was a potential source region for the chemical features. Agreement of the slopes for linear correlations of selected trace gases with a long atmospheric lifetime compared to the transport be-tween SBL and flight regions support the SBL as the primary source region. Overall, 20
meteorological and chemical analyses suggest rapid convective outflow from the SBL to the upper troposphere over the North Atlantic. In addition, the good linear correla-tion between urban and industrial tracers in whole flight regions (r2for CH4–CO=0.92)
and Outside (r2for CH4–CO=0.89) suggest that the troposphere over the mid-latitude North Atlantic was influenced significantly with U.S. pollutants in various stages of air 25
mass processing.
Acknowledgements. This research benefited greatly from the combined effort of NASA DC-8 flight and science teams for INTEX-NA. We are grateful to NASA Earth Science Tropospheric Chemistry Program for INTEX-NA funding which supported this work. Funding for this work
ACPD
7, 17367–17400, 2007
Flight 13 case study during the NASA INTEX-NA campaign S. Y. Kim et al. Title Page Abstract Introduction Conclusions References Tables Figures ◭ ◮ ◭ ◮ Back Close
Full Screen / Esc
Printer-friendly Version Interactive Discussion was also provided by the NOAA AIRMAP grant# NA06OAR4600189, and fellowship support
for SYK from the Climate Change Research Center at UNH. We also thank J.-P. Cammas and V. Thouret of the MOZAIC program, which is funded by the European Commission, CNRS (France), Forschungszentrum Julich (Germany), Meteo France, EADS (Airbus) and the airlines (Air France, Lufthansa, Austrian Airlines, and former Sabena who carry free of charge the 5
MOZAIC equipment and perform the maintenance). Helpful discussions were provided by J. Hegarty and B. Sive.
References
Aucott, M. L., McCulloch, A., Graedel, T. E., Kleiman, G., Midgley, P., and Li, Y.-F.: An-thropogenic emissions of trichloromethane (chloroform, CHCl3) and chlorodifluoromethane 10
(HCFC-22): Reactive Chlorine Emissions Inventory, J. Geophys. Res., 104(D7), 8405–8415, 1999.
Baker, A. K., Beyersdorf, A. J., Doezema, L. A., Katzenstein, A., Meinardi, S., Simpson, I. J., Blake, D. R., and Rowland, F. S.: Measurements of Nonmethane Hydrocarbons in 28 United States Cities, Atmos. Environ., doi:10.1016/j.atmosenv.2007.09.007, in press, 2007.
15
Barletta, B., Meinardi, S., Simpson, I. J., Rowland, F. S., Chan, C.-Y., Wang, X., Zou, S., Chan, L. Y., and Blake, D. R.: Ambient halocarbon mixing ratios in 45 Chinese cities, Atmos. Environ., 40, 7706–7719, 2006.
Bartlett, K. B., Sachse, G. W., Collins Jr., J.E., and Harriss, R. C.: Methane in the tropical South Atlantic: Sources and distribution during the late dry season, J. Geophys. Res., 101(D19), 20
24 139–24 150, 1996.
Bartlett, K. B., Sachse, G. W., Slate, T., Harward, C., and Blake, D. R.: Large-scale distribution of CH4 in the western North Pacific: Sources and transport from the Asian continent, J. Geophys. Res., 108(D20), 8807, doi:10.1029/2002JD003076, 2003.
Blake, N. J., Blake, D. R., Simpson, I. J., et al.: NMHCs and halocarbons in Asian con-25
tinental outflow during the Transport and Chemical Evolution over the Pacific (TRACE-P) Field Campaign: Comparison with PEM-West B., J. Geophys. Res., 108(D20), 8806, doi:10.1029/2002JD003367, 2003.
Chan, L.-Y., Chu, K.-W., Zou, S.-C., Chan, C.-Y., Wang, X.-M., Barletta, B., Blake, D. R., Guo, H., and Tsai, W.-Y.: Characteristics of nonmethane hydrocarbons (NMHCs) in industrial, 30
ACPD
7, 17367–17400, 2007
Flight 13 case study during the NASA INTEX-NA campaign S. Y. Kim et al. Title Page Abstract Introduction Conclusions References Tables Figures ◭ ◮ ◭ ◮ Back Close
Full Screen / Esc
Printer-friendly Version Interactive Discussion
EGU
industrial-urban, and industrial-suburban atmospheres of the Pearl River Delta (PRD) region of south China, J. Geophys. Res., 111, D11304, doi:10.1029/2005JD006481, 2006.
Chin, M. and Davis, D. D.: Global sources and sinks of OCS and CS2 and their distributions, Global Biogeochem. Cy., 7(2), 321–337, 1993.
Colman, J. J., Swanson, A. L., Meinardi, S., Sive, B. C., Blake, D. R., and Rowland, F. S.: De-5
scription of the analysis of a wide range of volatile organic compounds in whole air samples collected during PEM-Tropics A and B, Anal. Chem., 73, 3723–3731, 2001.
Cooper, O. R., Moody, J. L., Parrish, D. D., Trainer, M., Ryerson, T. B., Holloway, J. S., H ¨ubler, G., Fehsenfeld, F. C., Oltmans, S. J., and Evans, M. J.: Trace gas signatures of the airstreams within North Atlantic cyclones: Case studies from the North Atlantic Regional Experiment 10
(NARE ’97) aircraft intensive, J. Geophys. Res., 106(D6), 5437–5456, 2001.
Crawford, J., Olson, J., Davis D., et al.: Clouds and trace gas distributions during TRACE-P, J. Geophys. Res., 108(D21), 8818, doi:10.1029/2002JD003177, 2003.
DeBell, L. J., Vozzella, M., Talbot, R. W., and Dibb, J. E.: Asian dust storm events of spring 2001 and associated pollutants observed in New England by the Atmospheric Investigation, Re-15
gional Modeling, Analysis and Prediction (AIRMAP) monitoring network, J. Geophys. Res., 109, D01304, doi:10.1029/2003JD003733, 2004.
Dickerson, R. R., Doddridge, B. G., Kelley, P., and Rhoads, K. P.: Large-scale pollution of the atmosphere over the remote Atlantic Ocean: Evidence from Bermuda, J. Geophys. Res., 100(D5), 8945–8952, 1995.
20
Fehsenfeld, F. C., Ancellet, G., Bates, T. S., et al.: International Consortium for Atmospheric Re-search on Transport and Transformation (ICARTT): North America to Europe – Overview of the 2004 summer field study, J. Geophys. Res., 111, D23S01, doi:10.1029/2006JD007829, 2006.
Fiore, A. M., Horowitz, L. W., Purves, D. W., Levy II, H., Evans, M. J., Wang, Y., Li, Q., 25
and Yantosca, R. M.: Evaluating the contribution of changes in isoprene emissions to surface ozone trends over the eastern United States, J. Geophys. Res., 110, D12303, doi:10.1029/2004JD005485, 2005.
Harriss, R. C., Sachse, G. W., Collins Jr., J. E., Wade, L., Bartlett, K. B., Talbot, R. W., Browell, E. V., Barrie, L. A., Hill, G. F., and Burney, L. G.: Carbon monoxide and methane over 30
Canada: July–August 1990, J. Geophys. Res., 99(D1), 1659–1669, 1994.
Holton, J. R.: An introduction to dynamic meteorology, 511 pp., Academic Press, San Diego, 1992.
ACPD
7, 17367–17400, 2007
Flight 13 case study during the NASA INTEX-NA campaign S. Y. Kim et al. Title Page Abstract Introduction Conclusions References Tables Figures ◭ ◮ ◭ ◮ Back Close
Full Screen / Esc
Printer-friendly Version Interactive Discussion Huntrieser, H., Heland, J., Schlager, H., et al.: Intercontinental air pollution transport from
North America to Europe: Experimental evidence from airborne measurements and surface observations, J. Geophys. Res., 110, D01305, doi:10.1029/2004JD005045, 2005.
Jaffe, D., Anderson, T., Covert, D., Kotchenruther, R., Trost, B., Danielson, J., Simpson, W., Berntsen, T., Karlsdottir, S., Blake, D., Harris, J., Carmichael, G., and Uno, I.: Transport of 5
Asian Air Pollution to North America, Geophys. Res. Lett., 26(6), 711–714, 1999.
Jaffe, D., McKendry, I., Anderson, T., and Price, H.: Six “new” episodes of trans-Pacific transport of air pollutants, Atmos. Environ., 37, 391–404, 2003.
Li, Q., Jacob, D. J., Park, R., Wang, Y., Heald, C. L., Hudman, R., Yantosca, R. M., Martin, R. V., and Evans, M.: North American pollution outflow and the trapping of convectively lifted pollu-10
tion by upper-level anticyclone, J. Geophys. Res., 110, D10301, doi:10.1029/2004JD005039, 2005.
Liang, Q., Jaegl ´e, L., Hudman, R. C., et al.: Summertime influence of Asian pollu-tion in the free troposphere over North America, J. Geophys. Res., 112, D12S11, doi:10.1029/2006JD007919, 2007.
15
Mao, H., Talbot, R., Troop, D., Johnson, R., Businger, S., and Thompson, A. M.: Smart Balloon observations over the North Atlantic: O3data analysis and modeling, J. Geophys. Res., 111, D23S56, doi:10.1029/2005JD006507, 2006.
McKeen, S. A. and Liu, S. C.: Hydrocarbon ratios and photochemical history of air masses, Geophys. Res. Lett., 20(21), 2363–2366, 1993.
20
McKendry, I. G., Strawbridge, K. B., O’Neill, N. T., Macdonald, A. M., Liu, P. S. K., Leaitch, W. R., Anlauf, K. G., Jaegle, L., Fairlie, T. D., and Westphal, D. L.: Trans-Pacific transport of Saharan dust to western North America: A case study, J. Geophys. Res., 112, D01103, doi:10.1029/2006JD007129, 2007.
Millet, D. B., Goldstein, A. H., Holzinger, R., et al.: Chemical characteristics of North American 25
surface layer outflow: Insights from Chebogue Point, Nova Scotia, J. Geophys. Res., 111, D23S53, doi:10.1029/2006JD007287, 2006.
Montzka, S. A., Calvert, P., Hall, B. D., Elkins, J. W., Conway, T. J., Tans, P. P., and Sweeney, C.: On the global distribution, seasonality, and budget of atmospheric carbonyl sulfide (COS) and some similarities to CO2, J. Geophys. Res., 112, D09302, doi:10.1029/2006JD007665, 30
2007.
Na, K., Kim, Y. P., Moon, K.-C., Moon, I., and Fung, K.: Concentrations of volatile organic compounds in an industrial area of Korea, Atmos. Environ., 35, 2747–2756, 2001.
ACPD
7, 17367–17400, 2007
Flight 13 case study during the NASA INTEX-NA campaign S. Y. Kim et al. Title Page Abstract Introduction Conclusions References Tables Figures ◭ ◮ ◭ ◮ Back Close
Full Screen / Esc
Printer-friendly Version Interactive Discussion
EGU
Parrish, D. D., Holloway, J. S., Trainer, M., Murphy, P. C., Forbes, G. L., and Fehsenfeld, F. C.: Export of North American Ozone Pollution to the North Atlantic Ocean, Science, 259(5100), 1436–1439, 1993.
Parrish, D. D., Dunlea, E. J., Atlas, E. L., et al: Changes in the photochemical environment of the temperate North Pacific troposphere in response to increased Asian emissions, J. 5
Geophys. Res., 109, D23S18, doi:10.1029/2004JD004978, 2004.
Pickering, K. E., Thompson, A. M., Wang, Y., Tao, W.-K., McNamara, D. P., Kirchhoff, V. W. J. H., Heikes, B. G., Sachse, G. W., Bradshaw, J. D., Gregory, G. L., and Blake, D. R.: Convective transport of biomass burning emissions over Brazil during TRACE A, J. Geophys. Res., 101(D19), 23 993–24 012, 1996.
10
Sander, S. P., Finlayson-Pitts, B. J., Friedl, R. R., Golden, D. M., Huie, R. E., Kolb, C. E., Kurylo, M. J., Molina, M. J., Moortgat, G. K., Orkin, V. L., and Ravishankara, A. R.: Chemical Kinetics and Photochemical Data for Use in Atmospheric Studies, Evaluation Number 14, JPL Publication 02-25, Jet Propulsion Laboratory, Pasadena, CA., 2003.
Sandoval-Soto, L., Stanimirov, M., von Hobe, M., Schmitt, V., Valdes, J., Wild, A., and 15
Kesselmeier, J.: Global uptake of carbonyl sulfide (COS) by terrestrial vegetation: Estimates corrected by deposition velocities normalized to the uptake of carbon dioxide (CO2), Biogeo-sciences, 2, 125–132, 2005,
http://www.biogeosciences.net/2/125/2005/.
Simmonds, P. G., Manning, A. J., Cunnold, D. M., et al. : Global trends, seasonal cycles, and 20
European emissions of dichloromethane, trichloroethene, and tetrachloroethene from the AGAGE observations at Mace Head, Ireland, and Cape Grim, Tasmania, J. Geophys. Res., 111, D18304, doi:10.1029/2006JD007082, 2006.
Singh, H. B., Brune, W. H., Crawford, J. H., Jacob, D. J., and Russell, P. B.: Overview of the summer 2004 Intercontinental Chemical Transport Experiment – North America (INTEX-A), 25
J. Geophys. Res., 111, D24S01, doi:10.1029/2006JD007905, 2006.
Sive, B. C., Zhou, Y., Troop, D., Wang, Y., Little, W. C., Wingenter, O. W., Russo, R. S., Varner, R. K., and Talbot, R.: Development of a cryogen-free concentration system for measurements of volatile organic compounds, Anal. Chem., 77(21), 6989–6998, doi:10.1021/ac0506231, 2005.
30
Stohl, A., Forster, C., Eckhardt, S., Spichtinger, N., Huntrieser, H., Heland, J., Schlager, H., Wilhelm, S., Arnold, F., and Cooper, O.: A backward modeling study of interconti-nental pollution transport using aircraft measurements, J. Geophys. Res., 108(D12), 4370,
ACPD
7, 17367–17400, 2007
Flight 13 case study during the NASA INTEX-NA campaign S. Y. Kim et al. Title Page Abstract Introduction Conclusions References Tables Figures ◭ ◮ ◭ ◮ Back Close
Full Screen / Esc
Printer-friendly Version Interactive Discussion doi:10.1029/2002JD002862, 2003.
Talbot, R. W., Dibb, J. E., Klemm, K. I., Bradshaw, J. D., Sandholm, S. T., Blake, D. R., Sachse, G. W., Collins, J., Heikes, B. G., Gregory, G. L., Anderson, B. E., Singh, H. B., Thornton, D. C., and Merrill, J. T.: Chemical characteristics of continental outflow from Asia to the troposphere over the western Pacific Ocean during September-October 1991: Results from 5
PEM-West A, J. Geophys. Res., 101(D1), 1713–1725, 1996a.
Talbot, R. W., Bradshaw, J. D., Sandholm, S. T., Smyth, S., Blake, D. R., Blake, N. R., Sachse, G. W., Collins, J. E., Heikes, B. G., Anderson, B. E., Gregory, G. L., Singh, H. B., Lefer, B. L., and Bachmeier, A. S.: Chemical characteristics of continental outflow over the tropical South Atlantic Ocean from Brazil and Africa, J. Geophys. Res., 101(D19), 24 187–24 202, 1996b. 10
Talbot, R. W., Dibb, J. E., Lefer, B. L., Bradshaw, J. D., Sandholm, S. T., Blake, D. R., Blake, N. J., Sachse, G. W., Collins Jr., J. E., Heikes, B. G., Merrill, J. T., Gregory, G. L., Anderson, B. E., Singh, H. B., Thornton, D. C., Bandy, A. R., and Pueschel, R. F.: Chemical characteristics of continental outflow from Asia to the troposphere over the western Pacific Ocean during February – March 1994: Results from PEM-West B, J. Geophys. Res., 102(D23), 28 255– 15
28 274, 1997.
Twohy, C. H., Clement, C. F., Gandrud, B. W., et al.: Deep convection as a source of new particles in the midlatitude upper troposphere. J. Geophys. Res., 107(D21), 4560, doi:10.1029/2001JD000323, 2002.
Vay, S. A., Anderson, B. E., Conway, T. J., Sachse, G. W., Collins Jr., J. E., Blake, D. R., and 20
Westberg, D. J.: Airborne observations of the tropospheric CO2distribution and its controlling factors over the South Pacific Basin, J. Geophys. Res., 104(D5), 5663–5676, 1999.
Wang, C. J.-L., Blake, D. R., and Rowland, F. S.: Seasonal variations in the atmospheric distri-bution of a reactive chlorine compound, tetrachloroethene (CCl2=CCl2), Geophy. Res. Lett., 22(9), 1097–1100, 1995 .
25
Xiao, Y., Jacob, D. J., Wang, J. S., Logan, J. A., Palmer, P. I., Suntharalingam, P., Yantosca, R. M., Sachse, G. W., Blake, D. R., and Streets, D. G.: Constraints on Asian and European sources of methane from CH4-C2H6-CO correlations in Asian outflow, J. Geophys. Res., 109, D15S16, doi:10.1029/2003JD004475, 2004.
Zhou, Y., Varner, R. K., Russo, R. S., Wingenter, O. W., Haase, K. B., Talbot, R. W., and Sive, 30
B. C.: Coastal water source of short-lived halocarbons in New England, J. Geophys. Res., 110, D21302, doi:10.1029/2004JD005603, 2005.
ACPD
7, 17367–17400, 2007
Flight 13 case study during the NASA INTEX-NA campaign S. Y. Kim et al. Title Page Abstract Introduction Conclusions References Tables Figures ◭ ◮ ◭ ◮ Back Close
Full Screen / Esc
Printer-friendly Version Interactive Discussion
EGU Table 1. Chemical characteristics of flight regions and boundary layer in southeastern U.S. ¯x(σ)
is mean(standard deviation) and q0.5 means median. The units of the compounds are as follows; ppmv for CO2, ppbv for CH4, CO and O3, particles/cm3for UCN, and pptv for the other compounds
Region 1 (n=12) Region 2 (n=28) Region 3 (n=24) Outside (n=94) Southeastern Boundary (n=66)
¯
x(σ) q0.5 range x(σ)¯ q0.5 range x(σ)¯ q0.5 range x(σ)¯ q0.5 range x(σ)¯ q0.5 range
CH4 1831 (10) 1833 1804–1843 1805 (17) 1812 1771–1833 1808 (8) 1810 1782–1822 1781 (18) 1778 1757–1822 1823 (35) 1820 1764–1890 CO 127 (9) 130 100–134 106 (16) 113 78–126 109 (8) 110 86–119 84 (16) 80 60–120 122 (35) 117 76-212 CO2 373.6 (0.3) 373.6 372.8–374.2 374.5 (1.2) 374.4 372.4–376.6 374.8 (0.8) 374.6 373.7– 376.4 375.4 (1.2) 375.9 372.6–377.3 370.2 (6.8) 373.0 356.4-379.1 COS 426 (7) 425 415–440 437 (18) 433 411–473 440 (11) 438 422–473 453 (13) 456 421–479 420 (40) 429 344–485 O3 85 (6) 86 71–92 75 (16) 73 48–103 64 (7) 63 50–76 53 (21) 55 14–101 48 (11) 48 27–79 C2H2 117 (16) 122 79–130 93 (28) 101 38–136 94 (14) 97 55–118 45 (29) 41 11–178 140 (96) 120 32–428 C2Cl4 10.2 (2.0) 10.4 5.3–12.4 5.1 (1.6) 5.5 2.6–7.6 5.5 (1.1) 5.5 3.4–6.9 3.4 (1.9) 2.6 1.5–9.3 5.8 (4.2) 4.2 1.7–19.6 C2H6 928 (96) 937 659–1089 875 (143) 892 529–1036 974 (161) 918 727–1311 571 (228) 614 258–1031 1172 (597) 1013 370–3458 i-C5H12 9 (3) 9 3–13 12 (5) 14 4–19 12 (4) 13 3–17 7 (3) 7 3–16 109 (84) 93 15–506 C6H6 10 (3) 11 5–13 16 (6) 18 5–24 17 (3) 17 10–22 10 (6) 9 3–43 45 (30) 38 6–160 CHCl3 10.5 (0.8) 10.7 8.9–11.2 9.4 (1.0) 9.7 7.9–10.8 9.6 (0.8) 9.5 8.3–11.4 7.8 (1.0) 7.5 6.2–9.6 10.6 (2.9) 10.2 6.5–16.8 CF2ClBr 4.67 (0.12) 4.66 4.47–4.84 4.29 (0.05) 4.30 4.19–4.36 4.32 (0.09) 4.32 4.18–4.61 4.23 (0.11) 4.19 4.09–4.59 4.33 (0.08) 4.33 4.13–4.49 UCN 10 172 (2436) 10 833 2476–11 340 1482 (975) 1400 146–3574 1998 (1168) 1548 720–5517 1542 (2348) 694 129–10 427 3988 (3852) 2611 334–15 327 CS2 3.2 (3.6) 1.5 1.1–14.0 4.0 (2.5) 3.2 1.2–11.2 2.7 (1.8) 2.1 1.2–9.3 3.2 (2.9) 2.4 1.1–21.0 9.3 (7.9) 6.8 1.7–39.2
ACPD
7, 17367–17400, 2007
Flight 13 case study during the NASA INTEX-NA campaign S. Y. Kim et al. Title Page Abstract Introduction Conclusions References Tables Figures ◭ ◮ ◭ ◮ Back Close
Full Screen / Esc
Printer-friendly Version Interactive Discussion Table 2. Chemical Characteristics of “Outside” Air. Denotations and units are same as Table 1.
The outsidex(σ)¯ U.S. outflow (q n=34) The western Atlantic (n=29) The remote Central Atlantic (n=26) Pacific (n=5)
0.5 range x(σ)¯ q0.5 range x(σ)¯ q0.5 range x(σ)¯ q0.5 range
CH4 1798 (14) 1799 1771–1822 1775 (11) 1775 1757–1805 1764 (3) 1763 1759–1772 1789 (12) 1792 1775–1805 CO 98 (13) 100 77–120 77 (10) 78 61–106 69 (5) 68 60–80 98 (15) 100 84-120 CO2 374.2 (1.1) 374.3 372.6–376.5 376.0 (0.6) 375.9 373.7–377.3 376.4 (0.3) 376.5 375.9–377.2 374.9 (0.4) 374.9 374.2–375.4 COS 442 (10) 442 421–464 457 (9) 457 430–475 463 (6) 461 455–479 459 (12) 457 445–476 O3 70 (10) 71 44–92 54 (15) 55 23–83 28 (12) 25 14–47 63 (23) 57 43-101 C2H2 68 (18) 70 40–102 37 (15) 35 14–84 18 (3) 17 11–26 87 (55) 79 41–178 C2Cl4 5.4 (1.7) 5.2 2.6–9.3 2.4 (0.5) 2.4 1.6–4.3 1.8 (0.1) 1.7 1.5–2.2 3.9 (0.7) 4.1 2.9–4.5 C2H6 757 (112) 758 606–1002 561 (205) 577 258–1031 306 (24) 303 260–343 739 (142) 769 596–934 i-C5H12 8 (4) 8 3–16 6 (4) 6 3-8 NA NA NA 7 (2) 6 5-9 C6H6 12 (5) 11 3-23 7 (3) 6 3–12 NA NA NA 18 (15) 16 6-43 CHCl3 8.7 (0.7) 8.9 7.3–9.6 7.3 (0.6) 7.3 6.3–9.3 7.0 (0.4) 7.1 6.2–7.6 8.8 (0.8) 9.1 7.7–9.6 CF2ClBr 4.37 (0.1) 4.36 4.18–4.59 4.19 (0.06) 4.19 4.11–4.31 4.15 (0.03) 4.15 4.09–4.23 4.24 (0.05) 4.24 4.20–4.29 UCN 3390 (3387) 1840 355–10 427 885 (557) 766 357–2666 328 (78) 340 180–447 343 (317) 218 129-809
ACPD
7, 17367–17400, 2007
Flight 13 case study during the NASA INTEX-NA campaign S. Y. Kim et al. Title Page Abstract Introduction Conclusions References Tables Figures ◭ ◮ ◭ ◮ Back Close
Full Screen / Esc
Printer-friendly Version Interactive Discussion
EGU Table 3. Correlation coefficients and slopes for each compound at each region. Regions
denoted as reg1, reg2, and reg3 are shown in Fig. 1, and outside is the segment of the flight route outside the three regions. SBL stands for the boundary layer over the southeastern U.S. Ratios of O3-CO and CH4-CO are in unit of ppbv/ppbv, CO-CO2 in ppbv/ppmv, CH4-CO2 in ppmv/ppmv, COS-CO2in pptv/ppmv, and all others in pptv/ppbv.
r2 Slope
reg 1 reg 2 reg 3 outside SBL reg 1 reg 2 reg 3 outside SBL O3-CO 0.27 0.01 0.13 0.57 0.60 0.31 0.09 −0.3 0.98 0.25 CH4-CO 0.84 0.80 0.45 0.89 0.65 0.94 0.97 0.67 1.04 0.70 COS-CO 0.43 0.44 0.43 0.57 0.44 −0.45 −0.77 −0.84 −0.58 −0.76 CHCl3-CO 0.81 0.84 0.59 0.91 0.74 0.07 0.06 0.07 0.06 0.07 C2Cl4-CO 0.36 0.85 0.63 0.75 0.73 0.12 0.09 0.11 0.10 0.10 i-C5H12-CO 0.46 0.55 0.55 0.36 0.11 0.21 0.28 0.33 0.19 0.82 C6H6-CO 0.33 0.43 0.62 0.52 0.43 0.16 0.25 0.27 0.31 0.58 C2H2-CO 0.84 0.63 0.59 0.85 0.93 1.51 1.40 1.27 1.63 2.72 CH4-CO2 0.07 0.71 0.002 0.86 0.46 −0.01 −0.01 −0.0004 −0.01 −0.005 COS-CO2 0.1 0.64 0.009 0.63 0.83 6.7 11.9 1.31 8.11 5.26 CO-CO2 0.04 0.67 0.02 0.84 0.34 −5.95 −10.5 −1.41 −12.19 −2.93
ACPD
7, 17367–17400, 2007
Flight 13 case study during the NASA INTEX-NA campaign S. Y. Kim et al. Title Page Abstract Introduction Conclusions References Tables Figures ◭ ◮ ◭ ◮ Back Close
Full Screen / Esc
Printer-friendly Version Interactive Discussion
Fig. 1. Flight 13 route and the three regions in upper troposphere.
ACPD
7, 17367–17400, 2007
Flight 13 case study during the NASA INTEX-NA campaign S. Y. Kim et al. Title Page Abstract Introduction Conclusions References Tables Figures ◭ ◮ ◭ ◮ Back Close
Full Screen / Esc
Printer-friendly Version Interactive Discussion
EGU
00 UTC on July 26 12 UTC on July 28 (a) (b)
(c) (d)
(e) (f)
Fig. 2. Analyzed sea level pressure (a and b), 500hPa geopotential height (c and d), 300hPa geopotential height (e and f) for 00UTC July 26, 2004 and 12UTC July 28, 2004.
Fig. 2. Analyzed sea level pressure (a and b), 500 hPa geopotential height (c and d), 300 hPa
ACPD
7, 17367–17400, 2007
Flight 13 case study during the NASA INTEX-NA campaign S. Y. Kim et al. Title Page Abstract Introduction Conclusions References Tables Figures ◭ ◮ ◭ ◮ Back Close
Full Screen / Esc
Printer-friendly Version Interactive Discussion
00 UTC on July 26 00 UTC on July 27 (a) (b)
(c) (d)
(e) (f)
Fig. 3. GOES infrared images (a and b), Manually digitized radars (c and d), and skew T and log P diagram (e and f) for 00 UTC July 26, 2004 and 00 UTC July 27, 2004.
Fig. 3. GOES infrared images (a and b), Manually digitized radars (c and d), and skewT and
ACPD
7, 17367–17400, 2007
Flight 13 case study during the NASA INTEX-NA campaign S. Y. Kim et al. Title Page Abstract Introduction Conclusions References Tables Figures ◭ ◮ ◭ ◮ Back Close
Full Screen / Esc
Printer-friendly Version Interactive Discussion
EGU
(a) (b)
(c) (d)
Fig. 4. Vertical distribution of (a) CO, (b) CH4, (c) CO2, and (d) COS. Lines in the graphs are for
Fig. 4. Vertical distribution of (a) CO, (b) CH4, (c) CO2, and (d) COS. Lines in the graphs are for average mixing ratios on July, 2004 in Bermuda.