HAL Id: hal-01586161
https://hal.archives-ouvertes.fr/hal-01586161
Submitted on 12 Feb 2018
HAL is a multi-disciplinary open access archive for the deposit and dissemination of sci-entific research documents, whether they are pub-lished or not. The documents may come from teaching and research institutions in France or abroad, or from public or private research centers.
L’archive ouverte pluridisciplinaire HAL, est destinée au dépôt et à la diffusion de documents scientifiques de niveau recherche, publiés ou non, émanant des établissements d’enseignement et de recherche français ou étrangers, des laboratoires publics ou privés.
Probing heterogeneity of cortical bone with ultrasound
axial transmission
Josquin Foiret, Quentin Grimal, Maryline Talmant, Roberto Longo, Pascal
Laugier
To cite this version:
Josquin Foiret, Quentin Grimal, Maryline Talmant, Roberto Longo, Pascal Laugier. Probing het-erogeneity of cortical bone with ultrasound axial transmission. IEEE Transactions on Ultrason-ics, Ferroelectrics and Frequency Control, Institute of Electrical and Electronics Engineers, 2012, �10.1109/TUFFC.2013.2549�. �hal-01586161�
Probing Heterogeneity of Cortical Bone
With Ultrasound Axial Transmission
Josquin Foiret, Quentin Grimal, Maryline Talmant, Roberto Longo, and Pascal Laugier, Member, IEEE
Abstract—In clinical examination of long cortical bones
based on ultrasound axial transmission, the parameter cur-rently used as indicator of bone fragility is the velocity of the first arriving signal (VFAS). VFAS is inherently related to the material properties of the bone site. However, experimental uncertainties may hide the true sensitivity of VFAS to elastic characteristics of bone. Measurements are performed with a multi-element compact array placed in contact with the bone. Therefore, VFAS measurements may be biased by variability imposed by geometrical irregularities of the sample below the probe and/or by probe misalignment. In this paper, we test the assumption that despite experimental errors, VFAS varia-tions resulting from material properties can be measured. The methodology was to compare VFAS and velocities of compres-sion bulk waves (VBWs) on carefully matched sites around the circumference of a test sample (bovine femur). VBW was mapped on bone cross-sections using a through-transmission technique. VBW and VFAS were highly correlated [R2 = 0.80,
root mean square error = 23 m·s−1, p < 10−5] and the slope
of the linear regression was close to 1 except in a part of the circumference with a pronounced curvature. In measure-ments performed with the same protocol as for clinical mea-surements, regions with different material properties (reflected by VBW) could be identified. This work demonstrates that within-specimen variations of material properties can be as-sessed with a technique available for in vivo measurements.
I. I
A
ultrasound frequencies, long cortical bones such as the radius and tibia are assessed most commonly by the axial transmission (AT) technique. A linear arrange-ment of emitters and receivers along the bone axis al-lows excitation of several axially transmitted waves and capturing of the multi-component signal associated with them. Current clinical measurements rely mostly on the measurement of the velocity of the first arriving signal (VFAS). The VFAS was shown to be a relevant indicator of fracture risk [1], [2].Cortical bone is known to be heterogeneous, i.e., its ma-terial properties vary around its circumference and along the bone axis [3]–[5]. This heterogeneity, which reflects bone remodeling and adaptation to loading conditions, may be relevant with regard to fracture risk prediction. Furthermore, measuring the heterogeneity could be a
sig-nificant advantage for advanced quantitative ultrasound (QUS) methods for the assessment of bone which attempt to recover bone properties from experimental signals based on a model following an inverse problem strategy. The rea-son for this is that models of cortical bone which account for random fluctuations of mechanical properties should allow a more accurate and more robust inversion [6], [7].
In the actual AT clinical protocol, VFAS is measured on several spatial positions for one individual. However the output of the protocol is a unique value of VFAS, which results from a sorting and a classification of several hundreds of raw VFAS values.
In this paper, we consider these raw data and test the assumption that, despite experimental uncertainties, their variations with spatial position reflect heterogeneity of cortical bone elastic properties. Our objective is to assess the potential of VFAS and of the established AT clinical protocol to measure the spatial variability of elastic prop-erties in the cortical bone of an individual.
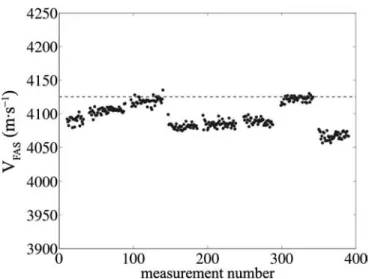
More precisely, the usual clinical protocols include an angular scan around the distal part of the forearm [8]–[10]. During one scan, several hundred VFAS values are re-corded and the 95th percentile is retained as the indicator of bone quality (Fig. 1). Note that signals recorded when the contact is loose between the probe and the measured site or recorded during the movement of the probe (an-gular scan) are not taken into account. Usable raw data (points on Fig. 1) can be biased mostly by the residual experimental uncertainty, which includes misalignment of the probe with respect to bone axis and effects resulting from local irregular geometry. On standard geometry and homogeneous materials, it was previously shown that mis-alignment leads to a systematic decrease of VFAS and this motivated the choice of the highest VFAS value (95th per-centile) to design a robust clinical parameter. Finally, for that parameter, a precision of ±20 m·s−1 can be achieved in vivo (inter-operator reproducibility using the clinical
protocol) [10]. This precision was close to the one obtained
in vitro on human radius samples (with repeated
measure-ment including repositioning of the probe without angular scan). Therefore, during a clinical angular scanning per-formed on a patient, the VFAS variations observed can be due to different factors in addition to variations of elastic properties. It follows that the contribution of bone hetero-geneity to the signal fluctuations may not be measurable. Two AT probes working at center frequencies of 1 and 2 MHz were used to measure one bone specimen at several circumferential locations following the protocol developed for the in vivo measurements. The spatial distribution of the material bulk wave velocities (VBW) of the specimen
J. Foiret, Q. Grimal, M. Talmant, and P. Laugier are with the Labo-ratoire d’Imagerie Paramétrique, UMR 7623, Université Pierre et Marie Curie—Paris VI, Paris, France (e-mail: jfoiret@gmail.com).
R. Longo is with the Department of Mechanical Engineering, Vrije Universiteit Brussel, Brussels, Belgium.
was obtained subsequently and compared with the AT data to test the sensitivity of AT to bone heterogeneity.
Cortical thickness (C.Th) is a potential confounding factor affecting VFAS in addition to material properties. Because in this study we focused our attention on the sen-sitivity of VFAS to the spatial heterogeneity of elasticity, the experimental protocol has been specifically designed to avoid any influence of thickness on VFAS that may arise from local variations of bone C.Th. For this purpose, a bovine femur was used because of its large C.Th (more than 1 cm). According to simulations of propagation on plates and tubular shells [11], VFAS measured with 1- and 2-MHz probes is independent of the thickness and is close to VBW, the velocity of compression bulk waves which propagate through the bone cross-section. Conse-quently, the first arriving signal (FAS) will not be affected by the finite thickness and will solely reflect the material properties, which are the focus of this work. With this approach, a direct comparison between VFAS and VBW can be achieved.
II. M M
A. Bone Specimen
A bovine femur was obtained from a local butcher. Epiphyses were cut and soft tissues were removed from the diaphysis. The bone was stored at −20°C between mea-surements. An orthonormal frame was defined, with z-axis aligned with the diaphysis axis (Fig. 2).
In the mid-diaphysis, a 1-cm-long region of interest was inspected with AT at several locations around the bone circumference. The length of the region of interest is ap-proximately the length of the probe reception array along the bone axis.
Five roughly equal angular sectors, A, B, C, D, and E, were defined around the bone axis z. In addition, regu-larly spaced marks (5-mm spacing) were drawn around the circumference to allow a fine location of the probe. Sectors and 5-mm-spaced marks were used to co-localize bulk wave (BW) and AT measurements.
For BW measurement purposes, after AT measure-ments, three cross-sectional slabs of about 3-mm-thickness were cut with a precision saw (1-mm-thick blade; ISOM-ET 4000, Buehler SARL, Dardilly, France) under continu-ous irrigation in the part of the diaphysis measured with AT. Because of the strong ultrasound absorption in bone tissue at the frequencies used for BW measurements, it is hardly possible to measure a 1-cm-thick slab in through transmission. The 3-mm-thickness is a compromise to op-timize the signal-to-noise ratio of the BW measurements.
B. AT Measurements
AT measurements were taken with two custom-made bidirectional probes working at central frequencies of 1 and 2 MHz. The probes are made up of a linear arrange-ment of receivers located around the center and trans-mitters distributed on both sides of the receiving area. The bidirectional technique, consisting of calculating the harmonic mean of FAS velocity obtained in each opposite direction of propagation, was used for VFAS determina-tion [12]. In each direcdetermina-tion, the VFAS was measured as the ratio of inter-receiver distance over time delay using a linear regression. The first extremum of the FAS waveform was used to detect the FAS. AT measurements were per-formed by a trained operator using two distinct sequences: 1) The ordered sequence was used to compare AT mea-surement with site-matched BW velocities around the entire circumference. For this purpose, 25 regu-larly spaced locations were marked around the cir-cumference (spacing between marks was 5 mm). The
Fig. 1. Dots show a series of 400 experimental velocities of the first ar-riving signal (FAS) acquired in vivo on a human radius. As the probe is moved around the bone circumference, different values for the velocity VFAS are observable. The dashed horizontal line indicates the 95th per-centile of the distribution, which is the retained value for VFAS.
Fig. 2. (left) Cross-section of the bone and definition of the 4 angular sectors, A, B, C, D, which were measured with the clinical sequence. In this sequence, the probe is moved intermittently to cover the whole sec-tor and record 3 cycles of 400 velocity of the first arriving signal (VFAS) measurements. In the ordered sequence, the probe is placed successively at known positions spaced by 5 mm and 100 VFAS values are recorded. (right) Diaphysis of the bovine femur with the 2-MHz clinical probe aligned with the bone axis.
probe was successively placed over each mark and 100 VFAS values were recorded at each location. The operator held the probe motionless over each mark during the measurement (no voluntary move-ment) and all 100 VFAS values recorded at one loca-tion were averaged.
2) The clinical sequence was adapted from the sequence of measurements used in clinical examination [8]– [10]. The probe was intermittently moved back and forth to cover each of the angular sectors, A, B, C, and D (Fig. 2). Three cycles of 400 VFAS measure-ments were performed in each sector. As in clinical measurements, the velocities biased by probe move-ments were removed. In addition, unstabilized veloc-ities were eliminated according to the criterion used in clinical measurements: isolated unstable velocities were rejected by identifying VFAS variations larger than ±50 m·s−1 inside a sliding window of ±5 suc-cessive measurements [10]. Note that in contrast to the actual in vivo clinical sequence, the data were not reduced to the 95th percentile or the maximum value. As opposed to the ordered sequence, the clini-cal sequence did not record the position of the probe within the sector.
Preliminary measurements have shown that AT tech-nique failed on sector E because of its pronounced surface curvature in the xy-plane. Accordingly, results are pre-sented for sectors A through D only.
C. BW Measurements
The longitudinal VBW in the bone’s axial direction (z-axis) was measured at the points of a regular grid in the
xy-plane of each slab. The grid step was 1 mm, resulting
in images of VBW with 1 mm2 pixels.
At each point, VBW was measured in through-trans-mission with a method similar to that described by Longo
et al. [13]. The originality of the method, which
evalu-ates the thickness simultaneously with the velocity, is that VBW is determined without a priori knowledge of the exact sample thickness at the measurement point. This is a critical point because the bone slab preparation method does not allow a precise control of its thickness.
The method was previously shown to recover the veloc-ity with a reproducibilveloc-ity better than 0.05% on standard materials [13]. The emitting and receiving transducers (V312-SU, Panametrics, Waltham, MA; 6 mm diameter) and sample were immersed in a water tank. The emit-ting transducer was excited with a continuous compressed signal (function generator 33220A, Agilent Technologies Inc., Santa Clara, CA) resulting in an excitation signal with a 4 MHz bandwidth centered at 5 MHz. The emitter and the receiver were placed on each side of the sample at 7 and 3 cm, respectively. The sample was placed on a motorized support, allowing displacement along x- and
y-axes, controlled via a computer (MM 4006, Newport
Corp., Irvine, CA). Each recorded signal is the result of
the average of 16 temporal signals of 100 µs duration each. Signals were recorded by a digital oscilloscope (TDS 1012, Tektronix Inc., Beaverton, OR). A reference signal in wa-ter was acquired every 120 points. Wawa-ter temperature was monitored and sound velocity in water was calculated from the formula of Lubbers and Graaf [14].
BW velocities were recovered from measurements of the transmission coefficient as a function of frequency, in the bandwidth 4 to 6 MHz, using an inversion scheme [13]. The differences between the experimental and theoretical transfer functions were minimized. The theoretical trans-fer function involves four parameters which are identified: through-sample time-of-flight, VBW, density, and attenu-ation. Because of the variability of VBW in cross-sections, several sets of initial values were systematically tested to ensure a correct convergence of the minimization algo-rithm. The behavior of the algorithm for the determina-tion of VBW at each point on the edges of the samples was carefully checked; VBW values were rejected where necessary.
Validation of the method to map VBW in a cross-sec-tion with moderate thickness variability was achieved us-ing a poly(methyl methacrylate) (PMMA) plate (see the Appendix).
Sectors A, B, C, and D were manually defined and di-vided in 25 sub-sectors corresponding to the marks (dis-tant of 5 mm) drawn on the circumference of the diaphysis (see Fig. 2). Finally, internal and external radial regions of interest were defined: a 3-mm-thick external (periosteal) region, referred to as the external ring, was obtained us-ing a square structurus-ing element of 3 × 3 pixels applied on the external edge; the internal region, referred to as the internal ring, consisted of the entire image with the external ring removed.
Imaging was performed separately on the three cross-sectional slabs. For the analysis, the values of VBW in site-matched regions (sectors or sub-sectors) of the three slabs were pooled together.
D. Data Analysis
Data analysis consisted of investigating the variabil-ity of BW and AT measurements and elucidating their relationships. The hypothesis explored is that AT mea-surement variability can be largely explained by the BW heterogeneity.
Only VBW values in the external ring (Fig. 3) were processed because AT measurements probe this peripheral part of the cortical shell. The normality of VBW distribu-tions in the different regions of interest was tested using Lilliefors test. The heterogeneity was analyzed by com-paring the velocities in the external ring sectors (clinical sequence) and the velocities in the 5-mm-spaced positions (ordered sequence). The statistical differences of VBW values in different regions of interest were tested using parametric or nonparametric tests (Kruskal–Wallis).
The possibility of measuring small variations of ma-terial properties with the AT probe was investigated by
comparing 25 site-matched VBW (each subsector) and VFAS (each measurement point of the ordered sequence) values. The trend of variations of the velocity values was evaluated with linear regression analysis.
The possibility of measuring bone heterogeneity with the clinical sequence was explored by comparing VFAS measured with the 1- and 2-MHz probes and VBW in the external ring. In the clinical sequence measurement proto-col, VFAS occurs in the form of several groups of similar values that fluctuate around a plateau value (Figs. 2 and 6). The average value and standard deviation of VFAS were calculated for each group separately.
Significance level for all tests was 5%.
III. R
The range of values obtained with the 2 MHz probe with the ordered sequence and with the two probes for the clinical sequence are indicated in Table I.
A. Maps of Bulk Wave Velocity in Cross-Sections
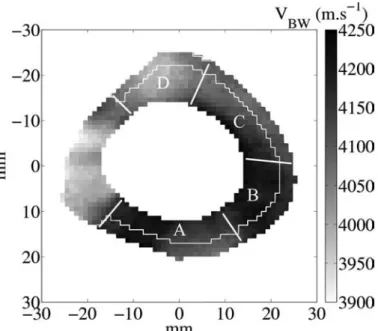
The average VBW (all measurement points pooled) was 4130 m·s−1, in agreement with values found in litera-ture [15]. Images of VBW reveal a complex pattern of the velocity distribution (Fig. 3). The distributions of VBW in each sector (A, B, C, or D) were significantly different from all of the other distributions. Concerning the radial variation, significant differences were observed between the external and internal ring, sector by sector (A, B, or C), except in sector D. In the subsectors of the external ring, VBW values were normally distributed, except in two subsectors. More than 70% of the 24 pairs of adjacent subsectors were significantly different. These differences appear mainly in sectors A and D and moderately in sec-tors B and C. Mean values and standard deviations (typi-cally 18 m·s−1) of VBW in each subsector are plotted in Fig. 4. An asterisk indicates significant differences exist between the VBW distributions of 2 adjacent subsectors.
In other words, the statistical analysis suggests that subsectors on the external ring are areas in which VBW can be considered statistically homogeneous, i.e., VBW
Fig. 3. A typical image of velocity of the bulk wave (VBW) values on a 3-mm-thick slab. The velocity is shown in grayscale in meters per second. The pixel size is 1 mm2. The angular sectors A, B, C, and D and the
external ring used in the data analysis are also represented.
TABLE I. V F A S (VFAS) V O C O S. Frequency Clinical Ordered 1 MHz 2 MHz 2 MHz Min(VFAS) (m·s−1) 3881 3890 3916 Max(VFAS) (m·s−1) 4215 4190 4192 Range(VFAS) (m·s−1) 334 300 276
Fig. 4. Comparison between velocity of the first arriving signal (VFAS) obtained with the ordered axial transmission (AT) sequence at 2 MHz (dashed line) and the corresponding velocity of the bulk wave (VBW; continuous line) on the external ring. AT measurements were spaced out at 5-mm intervals. Each point is the mean value of the distribution at the known circumferential position. The error bars indicate the standard devia-tion of the distribudevia-tion. An asterisk indicates a significant difference between two adjacent distribudevia-tions of VBW.
are normally distributed. At larger scales (i.e., over several subsectors), VBW distributions are not normal, revealing significant differences between subsectors associated with the heterogeneity of VBW on bone.
B. Ordered Sequence
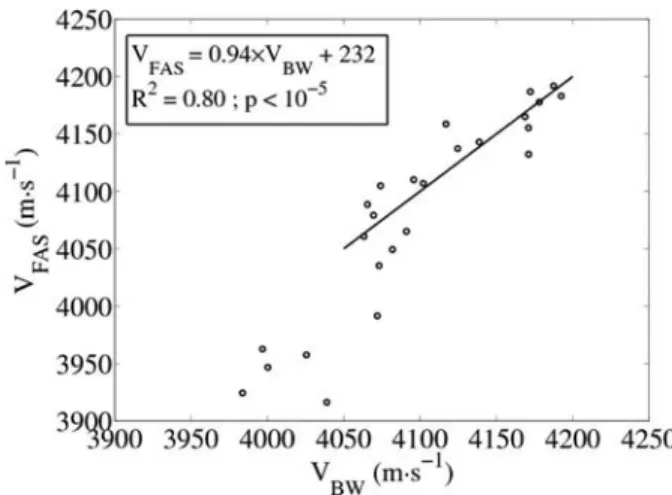
VFAS values measured with AT (2 MHz) at succes-sive marked positions closely reflect the local site-matched VBW in external ring sub-sectors, except mostly in sec-tor D (Fig. 4). In secsec-tor D, the concavity is more pro-nounced in the yz-plane. The average values of VBW in the sub-sectors on the external ring in sectors A, B, and C were significantly correlated to AT measurements in site-matched regions (R2 = 0.80, p <10−5, root mean square error = 23 m·s−1; see Fig. 5). The slope of the linear re-gression was 0.94 (confidence interval: [0.71 to 1.18]).
C. Clinical Sequence
VFAS values obtained during the clinical sequence ap-pear in groups around plateau values (Fig. 6), similar to
in vivo measurements with the same protocol [10]. Each
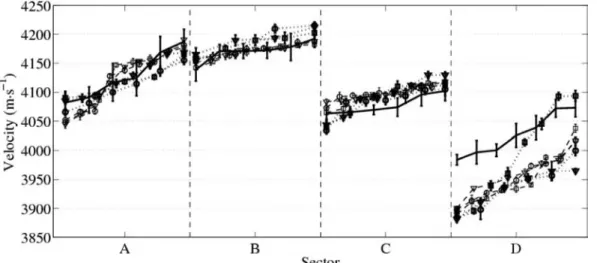
plateau is obtained when the operator does not move. In each sector, VFAS plateau values and VBW follow the same trend (Fig. 7). Our way to relate VBW mea-surements to VFAS was to sort, in each sector separately, both VBW and plateau values in ascending order. In Fig. 7, data are represented such that in each sector, values are spanned on the same arbitrary interval. The indicated VBW values are the average values in each external ring subsector.
IV. D
This work demonstrates that the in vivo sequence of measurements, applied in vitro to a bovine femur, allows
VFAS measurements sensitive to tissue heterogeneity. The clinical protocol set for human long bones includes 3 cycles of 400 VFAS measurements and intermittent back and forth circumferential motion. The protocol yields about 10 plateau values in each angular sector, which span the range of values that are expected in view of the material heterogeneity. The clinical protocol is thus found to be sufficient to probe the circumferential heterogeneity.
We have quantified the heterogeneity of material prop-erties in terms of axial compression bulk wave velocity. These were measured with a particularly precise method which was developed previously [13]. The ordered sequence with the AT probe allowed a site-matched comparison of VBW and VFAS. In the linear model, up to 80% of VFAS variations were explained by the underlying heterogeneity of the material properties (VBW) in the external ring. We suggest that the unexplained VFAS variations are due to imperfect site-matching, misalignment of the AT probe with the bone axis, and precision of the device.
To consider the implication of the work for in vivo as-sessment of human bone, several points must be discussed. 1) First, we chose to measure a bovine femur, which has a high thickness-to-wavelength ratio; in that case, FAS was shown to be insensitive to thickness ac-cording to model predictions [11]. FAS corresponds to a lateral wave which is the trace on the surface of the compression bulk wave propagating in corti-cal bone. However, when corticorti-cal thickness is below or comparable to the wavelength, guided waves are involved in FAS, and VFAS is sensitive to thickness. For instance in the human forearm (radius), where cortical thickness is typically in the range 1 to 4 mm [16], [17], the variability of cortical thickness under the probe, contributing to the variability of VFAS in addition to that of material properties, must be taken into account.
2) Heterogeneity of material properties in bovine bone and human long bone may be different. To our
Fig. 5. Velocity of the first arriving signal (VFAS) acquired with the ordered sequence with the 2-MHz axial transmission (AT) probe as a function of velocity of the bulk wave (VBW) in the subsectors. The lin-ear regression is shown with the continuous line. Points belonging to the smallest values (sector D) were not considered for the regression.
Fig. 6. Typical acquisition with the 2-MHz probe (clinical sequence). Ve-locity of the first arriving signal (VFAS) values were obtained after 400 measurements on the angular sectors A (•), B (×), C (□), and D (△).
knowledge, the material heterogeneity of the human radius has not been documented at a length scale relevant to the present work (i.e., a few millimeters). Nevertheless, heterogeneity within cross-sections of human femurs has been observed [3]–[5].
3) This work shows that in most sites around the di-aphysis circumference, on bovine bone, the surface is suited to a correct measurement. The geometry (sur-face shape) of the human radius and bovine femur diaphysis differs. The radius of curvature in the hu-man bone is smaller, which may limit the precision of the measurements. The external shape of the bone is a limitation on the measurement of heterogeneity. The characteristic plateaus can be associated with-out ambiguity to a material property (VBW) only in those cases where the bone surface is regular enough. 4) In this work, we did not consider soft tissues between the probe and the bone. In a previous work, it was found that the thickness of soft tissues modeled by a water layer have a small effect on VFAS measure-ment [12]. However, heterogeneities of elastic proper-ties in soft tissues, if any, may alter the sensitivity of our technique to bone heterogeneity. Note that with the bidirectional axial transmission technique, effects of uneven soft tissue thickness are automati-cally corrected [12].
The possibility of measuring heterogeneous material properties of cortical bone with a clinical device is likely to foster research on novel QUS indicators of fracture risks accounting for heterogeneity and novel inversion strategies to recover bone properties.
V. C
In this study, a direct comparison between FAS veloci-ties (VFAS) in the axial transmission configuration and
compression BW velocities (VBW) was made on a bovine femur.
VFAS was measured using a dedicated clinical device following two protocols: first, VFAS was measured at fixed known positions (ordered sequence) and second, clinical examination of angular sectors was performed (clinical se-quence). A through-transmission technique was used to draw VBW maps of bone cross-sections. VBW and VFAS showed a good correlation for site-matched measurements. Concerning the clinical sequences, VFAS was shown to reflect the same fluctuations as VBW in angular sectors. However, these results with VFAS were found when the contact between the axial transmission probe and the bone surface was optimal. This work shows that VFAS closely reflects bone material heterogeneities when FAS is not affected by the thickness.
A
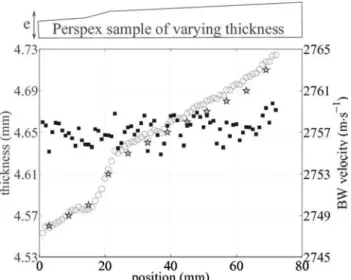
In our experiment on the bovine femur, cutting slabs with a constant thickness showing less than 100-µm varia-tions proved difficult, because of the large cortical thick-ness and bone diameter. To assess the precision of velocity and thickness measurements with BW, a PMMA plate of varying thickness was prepared. Its average thickness was 4.65 mm with an almost linear variation of 20 µm·cm−1. A part of the plate was sanded to increase the thickness variability. As shown on Fig. 8, determined thickness and velocity were found to be unrelated. The average BW velocity was 2757.2 m·s−1 with a standard deviation of 1.4 m·s−1 and no coherent fluctuations that would reveal any coupling with the thickness determination were vis-ible. Estimated thicknesses were very close to those mea-sured with a caliper, with differences less than 15 µm. Therefore, velocity measurements on bone were consid-ered to be independent of the sample thickness.
Fig. 7. Comparison between velocity of the bulk wave (VBW) data (continuous line) and the 3 cycles of velocity of the first arriving signal (VFAS) obtained with the clinical sequence at 1 MHz (dotted line) and 2 MHz (dashed line) for each sector, A to D. For the VBW data, each point is the mean value obtained in a subsector on the external ring. For the VFAS data, each point is the mean value obtained on a plateau as shown in Fig. 6. The error bars indicate the standard deviation of the group of data around each plateau (VFAS) or in each subsector (VBW).
R
[1] R. Barkmann, E. Kantorovich, C. Singal, D. Hans, H. K. Genant, M. Heller, and C. C. Gluer, “A new method for quantitative ul-trasound measurements at multiple skeletal sites—First results of precision and fracture discrimination,” J. Clin. Densitom., vol. 3, no. 1, pp. 1–7, 2000.
[2] C. F. Njeh, N. Shaw, J. M. Gardner-Medwin, C. M. Boivin, and T. R. Southwood, “Use of quantitative ultrasound to assess bone status in children with juvenile idiopathic arthritis,” J. Clin. Densitom., vol. 3, no. 3, pp. 251–260, 2000.
[3] S. Bensamoun, J.-M. Gherbezza, J.-F. de Belleval, and M.-C. Ho Ba Tho, “Transmission scanning acoustic imaging of human cortical bone and relation with the microstructure,” Clin. Biomech., vol. 19, no. 6, pp. 639–647, 2004.
[4] Q. Grimal, S. Haupert, D. Mitton, L. Vastel, and P. Laugier, “As-sessment of cortical bone elasticity and strength: Mechanical testing and ultrasound provide complementary data,” Med. Eng. Phys., vol. 31, no. 9, pp. 1140–1147, 2009.
[5] J. Grondin, Q. Grimal, K. Yamamoto, M. Matsukawa, A. Saïed, and P. Laugier, “Relative contributions of porosity and mineralized ma-trix properties to the bulk axial ultrasonic wave velocity in human cortical bone,” Ultrasonics, vol. 52, pp. 467–471, 2012.
[6] K. Macocco, Q. Grimal, S. Naili, and C. Soize, “Elastoacoustic mod-el with uncertain mechanical properties for ultrasonic wave vmod-elocity prediction: Application to cortical bone evaluation,” J. Acoust. Soc.
Am., vol. 119, no. 2, pp. 729–740, 2006.
[7] C. Desceliers, C. Soize, Q. Grimal, M. Talmant, and S. Naili, “Deter-mination of the random anisotropic elasticity layer using transient wave propagation in a fluid–solid multilayer: Model and experi-ments,” J. Acoust. Soc. Am., vol. 125, no. 4, pp. 2027–2034, 2009. [8] E. Bossy, “Evaluation ultrasonore de l’os cortical par
transmis-sion axiale: Modelisation et expérimentation in vitro et in vivo,” Ph.D. thesis, Laboratoire d’Imagerie Paramétrique, Université Paris 6, Paris, France, 2004, [Online]. Available: http://tel.archives -ouvertes.fr/tel-00003220
[9] M. Weiss, A. Ben-Shlomo, P. Hagag, and S. Ish-Shalom, “Discrimi-nation of proximal hip fracture by quantitative ultrasound measure-ment at the radius,” Osteoporos. Int., vol. 11, no. 5, pp. 411–416, 2000.
[10] M. Talmant, S. Kolta, Ch. Roux, D. Haguenauer, I. Vedel, B. Cas-sou, E. Bossy, and P. Laugier, “In vivo performance evaluation of bi-directional ultrasonic axial transmission for cortical bone assess-ment,” Ultrasound Med. Biol., vol. 35, no. 6, pp. 912–919, 2009. [11] E. Bossy, M. Talmant, and P. Laugier, “Three-dimensional
simula-tions of ultrasonic axial transmission velocity measurement on
cor-tical bone models,” J. Acoust. Soc. Am., vol. 115, no. 5, pt. 1, pp. 2314–2324, 2004.
[12] E. Bossy, M. Talmant, M. Defontaine, F. Patat, and P. Laugier, “Bi-directional axial transmission can improve accuracy and precision of ultrasonic velocity measurement in cortical bone: A validation on test materials,” IEEE Trans. Ultrason. Ferroelectr. Freq. Control, vol. 51, no. 1, pp. 71–79, 2004.
[13] R. Longo, Q. Grimal, P. Laugier, S. Vanlanduit, and G. Patrick, “Simultaneous determination of acoustic velocity and density of a cortical bone slab: Ultrasonic model-based approach,” IEEE Trans.
Ultrason. Ferroelectr. Freq. Control, vol. 57, no. 2, pp. 496–500, 2010.
[14] J. Lubbers and R. Graaf, “A simple and accurate formula for the sound velocity in water,” Ultrasound Med. Biol., vol. 24, no. 7, pp. 1065–1068, 1998.
[15] S. Lees and D. Z. Klopholz, “Sonic velocity and attenuation in wet compact cow femur for the frequency range 5 to 100 MHz,”
Ultra-sound Med. Biol., vol. 18, no. 3, pp. 303–308, 1992.
[16] E. Bossy, M. Talmant, F. Peyrin, L. Akrout, P. Cloetens, and P. Laugier, “An in vitro study of the ultrasonic axial transmission tech-nique at the radius: 1-Mhz velocity measurements are sensitive to both mineralization and intracortical porosity,” J. Bone Miner. Res., vol. 19, no. 9, pp. 1548–1556, 2004.
[17] H. Sievänen, S. Cheng, S. Ollikainen, and K. Uusi-Rasi, “Ultrasound velocity and cortical bone characteristics in vivo,” Osteoporos. Int., vol. 12, no. 5, pp. 399–405, 2001.
Fig. 8. Comparison between caliper-measured thicknesses (asterisks, pre-cision ±0.01 mm) and estimated thicknesses (circles). Thickness is indi-cated on the left axis. Estimated velocities are shown by square markers. Velocity is indicated on the right axis. Note that the relative variation of velocity is less than 6 m·s−1.