HAL Id: inserm-00821092
https://www.hal.inserm.fr/inserm-00821092
Submitted on 7 May 2013HAL is a multi-disciplinary open access archive for the deposit and dissemination of sci-entific research documents, whether they are pub-lished or not. The documents may come from teaching and research institutions in France or abroad, or from public or private research centers.
L’archive ouverte pluridisciplinaire HAL, est destinée au dépôt et à la diffusion de documents scientifiques de niveau recherche, publiés ou non, émanant des établissements d’enseignement et de recherche français ou étrangers, des laboratoires publics ou privés.
CT-scan images preprocessing and segmentation to
improve bioprosthesis leaflets morphological analysis.
Vito Giovanni Ruggieri, Pascal Haigron, Qian Wang, Simon Esneault, Raphael
Madeleine, Jean-François Heautot, Alain Leguerrier, Jean-Philippe Verhoye
To cite this version:
Vito Giovanni Ruggieri, Pascal Haigron, Qian Wang, Simon Esneault, Raphael Madeleine, et al.. CT-scan images preprocessing and segmentation to improve bioprosthesis leaflets morphological analysis.. Medical Hypotheses, Elsevier, 2013, 81 (1), pp.86-93. �10.1016/j.mehy.2013.03.032�. �inserm-00821092�
CT-scan images preprocessing and segmentation to improve bioprosthesis leaflets
morphological analysis
V.G. Ruggieri, MD, PhD, P. Haigron, PhD, Q. Wang, S. Esneault, PhD, R. Madeleine, JF
Heautot, PhD, A. Leguerrier, J-Ph. Verhoye, PhD.
CHU Rennes, Department of Cardiovascular and Thoracic Surgery, Rennes, France
INSERM, U1099, Rennes, France
Université de Rennes 1, LTSI, Rennes, France
Address for correspondence:
Vito Giovanni RUGGIERI, MD, PhD
Service de Chirurgie Thoracique et Cardiovasculaire Hopital Pontchaillou
2, rue Henri Le Guilloux 35003 Rennes Cedex 9, France Tel# 0033-299-28-91-64 Fax# 0033-299-28-24-96
ABSTRACT
The visualization of bioprosthesis leaflet morphology might help to better understand the
underlying mechanism of dysfunction in degenerated aortic bioprosthesis. Because today such
visualization of bioprosthesis leaflet morphology is intricate to impossible with other imaging
techniques, we hypothesized that the processing of multi-detector CT images would allow
better visualization of the prosthetic valve leaflets after biological aortic valve replacement.
The purpose of our study was to prospectively evaluate patients with a degenerated aortic
bioprosthesis, waiting for reoperation, by using 64-slice CT to evaluate prosthetic leaflets
morphology. A semi-automatic segmentation of pre-operative tomodensitometric images was
conducted, using 2 different implementations of the region growing algorithm. Here we report
all segmentation steps (selection of the region of interest, filtering, segmentation). Studied
degenerated aortic bioprostheses were represented by two Carpentier-Edwards Supra Annular
Valve (porcine leaflets), one Edwards Perimount (pericardial leaflets) and one Medtronic
Mosaic (porcine leaflets). Both segmentation methods (Isotropic Region Growing and Stick
Region Growing) allowed a semi-automatic segmentation with 3D reconstruction of all
bioprosthetic components (stent, leaflets, degeneration/calcifications). Explanted
bioprosthesis CT images were also processed and used as reference. Segmentation results
were compared by means of quantitative criteria. Semi-automatic segmentation using region
growing algorithm seems to provide an interesting approach for the morphological
characterization of degenerated aortic bioprostheses. We believe that in the next future CT
scan images segmentation may play an important role to better understand the mechanism of
dysfunction in failing aortic bioprostheses. Moreover, bioprostheses 3D reconstructions could
INTRODUCTION
During the last decade, the relative use of bioprosthetic aortic valves has clearly increased.
Improvements in surgical techniques and valve durability are likely to have fueled this
increase. On the other hand, the mortality risk of redo aortic valve surgery has similarly
decreased. Together with the best postoperative quality of life, these good surgical results
contribute to the large diffusion of bioprostheses implantation even in younger patients. This
phenomenon, associated to the increased life expectancy in industrialized countries, will
probably show its consequences in the next years when a large number of elderly patients
with associated comorbidities will need a re-intervention for bioprosthesis degeneration. With
the introduction of the transcatheter aortic valve to treat native aortic valve stenosis in high or
prohibitive surgical risk patients through a less invasive technique, medical community has
discovered a seducing but still emergent option to treat bioprosthesis failure in the same kind
of patients. Transcatheter valve implantation avoids re-sternotomy and cardiopulmonary
bypass and can potentially reduce resource utilization by accelerating patient recovery and
reducing hospital stay. The major failure mechanism for bioprostheses is represented by
leaflet degeneration and the current reference standard for follow-up in patients after aortic
valve replacement remains trans-thoracic echocardiography, with trans-esophageal
exploration in case of questionable findings at trans-thoracic. Echocardiography represents the
gold standard for functional assessment of bioprostheses. However, both trans-thoracic and
trans-esophageal echocardiography have limited usefulness for morphological assessment,
especially concerning bioprosthetic leaflets, because of their thickness and the acoustic
shadowing from stent or suture ring that often prevents their good visualization. Furthermore,
given their two-dimensional imaging nature, it is generally impossible to directly image the
the moment, limited application on the aortic bioprostheses also because of the anterior
position.
During the last years, multi-detector computed tomography (CT) has shown its potential to
provide precise diagnostic information in different cardiac clinical situations, such as
noninvasive evaluation of coronary disease [1–6], ventricular morphology and function [7],
and myocardial viability [8–10]. Multi-detector CT can also help visualize the morphology
and motion of native and diseased stenotic aortic valves and precisely measure aortic valve
opening areas. Several studies [11–17] suggest that multi-detector CT can also help assess
mechanism of dysfunction in mechanical prosthetic heart valve disorders.
In clinical practice CT scan images normally allow a tridimensional reconstruction of the
structures of interest, thanks to their high spatial resolution. The 3D analysis improves the
users understanding and facilitates the planning of surgical/interventional procedures.
In this context, the starting idea of this research work was that the tridimensional
reconstruction of bioprosthetic structures, in particular of prosthetic leaflets, could make
easier the morphological analysis of degenerated bioprostheses during normal follow-up and
be used for patients’ selection, improved planning and simulation of valve-in-valve procedure
in the future. Currently, the available softwares to analyze and process CT scan images do not
allow an efficient and effective tridimensional reconstruction of the bioprosthetic leaflets:
bovine pericardium and porcine valve leaflets are in fact too thin and CT images are also
altered by noise, stent metal artifacts and heart beat. This makes difficult the automatic
analysis with available tools and new methods to process these high resolution images have to
be considered.
We hypothesized that multi-detector CT would allow better visualization of the prosthetic
was to prospectively evaluate patients with a degenerated aortic bioprosthesis, waiting for
reoperation, by using 64-slice CT to morphologically analyze bioprosthetic leaflets.
METHODS
Study Protocol
The study protocol was approved by the institutional review board. Written informed consent
was obtained from patient after they were explained about the radiation exposure. Patients
with a failing aortic bioprosthesis and waiting for reoperation at our institution were included
in the study. All patients were in stable hemodynamic condition. Exclusion criteria were as
follows: urgent operation (hemodynamic instability or supine position suffering), constant
arrhythmia (atrial fibrillation or more than five premature heart beats per minute), New York
Heart Association class IV heart failure, renal insufficiency (serum creatinine level greater
than 1.4 mg/dL), and known allergy to iodinated contrast agents.
In-Vivo scanning protocol (Coronary CT protocol) : in order to reduce motion artifacts,
included patients underwent preoperative electrocardiographically gated cardiac
multi-detector CT performed with a 64-slices system (General Electric Medical Systems VCT 64 or
Discovery 750HD, GE Healthcare, Waukesha, WI). Patients with a heart rate of more than 75
beats per minute received oral Bisoprolol 5 mg/day for 2 days prior to CT associated to
intravenous Atenolol (intravenous bolus injection of 5 mg before exam) if they had no
contraindication to beta-blocker administration.
The scanning direction was craniocaudal and extended from the level of the carina to the
diaphragm. Prior to scanning, a technologist instructed all patients regarding breath holding in
an effort to minimize changes in body posture during the examination. The scanning sequence
was as follows: topography was performed and was followed by a bolus tracking examination
The intravenous bolus of contrast medium was tracked in the ascending aorta at the level of
the pulmonary trunk every 2 seconds. The administered contrast medium was Iobitridol
(Xenetix) (Guerbet Aulnay-sous-Bois, France) or Iohexol (Omnipaque) (GE Healthscare
Healthcare, Inc. Princeton, NJ). The intravenous triple bolus was realized with 95 ml of
contrast medium, followed by 45 ml of a mix of contrast and saline solution (50/50%) and
finally rinsed by 30 ml of saline solution at 5 ml/sec. Individual body weight–adapted volume
of contrast media and injection rate were not performed.
Retrospective CT angiography was performed with the following parameters: helical scanning
direction, 233-msec x-ray exposure time (two-thirds of the gantry rotation speed), 64 x
0.625-mm collimation, 0.35-second gantry rotation time, 100-kV tube voltage, 0.16–0.22 pitch and
use of dose modulation (peak tube current of 750 mA during 0%– 90% of the R-R interval
and minimal tube current of 300 mA) to reduce DLP (Dose Length Product in mGy x cm).
Retrospective reconstruction of multiple phases of cardiac cycle was performed. The diastole
phase (70% of cardiac cycle) was considered as the best to study the aortic bioprosthesis with
leaflets in their closed position.
Ex-Vivo scanning protocol (Temporal bone protocol) : after reoperation and intraoperative
evaluation of the failure mechanism, CT-scan images of the isolated explanted aortic
bioprosthesis were obtained using a high image resolution protocol with the following
parameters: 64 x 0.3125-mm collimation, 1-second gantry rotation time, 140-kV tube voltage,
0.531 pitch and tube current of 170 mA.
Patient Population
During a 2 years period, 9 patients were considered for the study. Among these, only 4
patients were included according to selection criteria. Three patients were excluded because
insufficiency which contraindicated the use of iodinated contrast enhanced imaging.
Degenerated bioprostheses were represented by two Carpentier-Edwards Supra Annular
Valve (Case 2 – MAG and 3 - BOU), one 23 mm Edwards Perimount (Case 1 – HER) and
one 23 mm Medtronic Mosaic (Case 4 – DAV). Bioprostheses echocardiographic
characteristics and failure mechanisms are shown in table 1.
Image Processing
A semi-automatic segmentation of pre-operative tomodensitometric images was conducted,
using 2 different implementations of the region growing algorithm. Here we report all
segmentation steps.
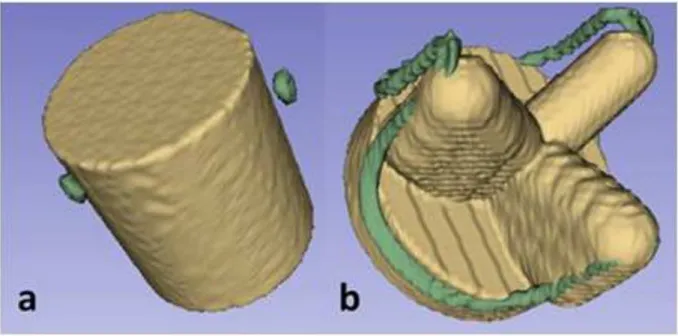
1 - Selection of the region of interest
In order to deal with the difficulties of segmentation of the bioprosthesis CT images (metal
artifacts, thickness of leaflets compared with image resolution, density of valve components
compared to stent) we considered a region of interest (ROI) defined by the stent. According to
the type of bioprosthesis stent implanted in the patient, we considered two kind of shape for
the ROI: a cylindrical shape preferentially for incomplete metallic stents and a conformational
shape for complete metallic stents (Fig. 1).
2 - Preprocessing
A preprocessing step is implemented in order to reduce the noise in CT images. The goal is to
increase the signal to noise ratio (SNR) as well as to increase the contrast of the structures of
interest, especially the valve leaflets. We considered methods based on diffusion filters
(curvature and anisotropic diffusion filter) as well as an adaptation of stick filters, initially
introduced to segment ultrasound images, and to reduce noise and keep details in thin
considered the SNR as the performance criterion. To compute the SNR we used the definition given in [20]: 10 ( ) 10*log ( ) ( ) ax Var n Var = (1)
where Vari is the the local variance in the neighborhood of leaflets and vascular lumen voxels
located in the ROI. Voxels located at the boundary between leaflets and vascular lumen are
used to obtain the maximum variance whereas voxels located in the vascular lumen are used
to obtain minimum variance. Due to their high value, voxels representing stent, calcifications
and pannus are not considered in the computation of SNR.
The diffusion filters are non-linear filters based on partial differential equations. They have
been proposed for noise reduction and segmentation, particularly for vascular images.
In classical Perona-Malik (PM) Model [21], the values of resulting voxels Itp+1are
calculated as: 1 , , ( ) | | p t t t t p p p q p q q p I I c I I ! " ! + # = +
%
$ $ , (2)where Itpis the current value of the voxel. !Itp q, is the discrete gradient along the qth direction (defined by the current voxel and a voxel of the neighborhood). c(x) is the classifier between
edge and noise. c(x) can take different expressions such as:
2 1 ( ) 1 ( / ) c x x k = + or 2 ( ) exp( ( / ) ) c x = ! x k , (3)
where!pis the neighborhood of the current voxel and !p is the number of voxels in !p. ! and k are two parameters to control diffusion intensity.
Classical Anisotropic diffusion operators as PM model can enhance edge while denoising the
image. Nevertheless, they may exhibit both edge and noise in low SNR conditions.
Anisotropic Curvature Diffusion, which is based on a modified curvature diffusion equation
(MCDE) [22-24], has been introduced to overcome this problem and to be less sensitive to
noise.
In Anisotropic Curvature Diffusion, the Discrete Gradient ,
t p q I
! used in PM Model was
replaced by Gaussian Curvature of the voxel:
1 , , ( ( )) ( ) p t t t t p p p q p q q I I c Curv P Curv P N ! " + # = $
%
(4)wherePp qt, is the plane defined by the current voxel and a direction given by a voxel of the
neighborhood !p. ( t, ) p q
Curv P is the Gaussian Curvature at the voxel.
As suggested by Perona et al [21], in the proposed CT data pre-processing approach we chose
|!p| 26= and N=9 (3*3*3 cubic neighborhood). Higher values of !p may smooth edge and
increase computational complexity too much. 1 ( ) 1 ( / ) c x x k = +
was selected thanks to its simple
computational complexity. Values of ! and k were set at 1 for a low level of noise (high SNR). In the case of images showing a high level of noise (SNR<=8), ! and k were set at 0.5. In general, K value should be set in a range of grey level values between the gradient
leaflet/vascular lumen and the gradient inside the noise.
Stick filter is also a non-linear filter. With stick filtering approach, the neighborhood of the
considered voxel is divided into a set of asymmetric sticks to perform a non-linear filtering of
the image. Because of its asymmetric stick, the filter could get better performance in terms of
The filter output I' at the current voxel was originally defined as: 1 1 ' * N i i i I g I W = = ! and 1 N i i W g = =! (5)
where Ii denotes the local mean value along the th stick, is the number of sticks, gi is the
reciprocal of local variance along the ith stick, used to classify edge and noise.
This filter was adapted to pre-process CT images of degenerative aortic valve bioprosthesis.
In our approach, the resulting value of the filtering process was considered as the sum of voxel
median values normalized by the standard deviation along 4 voxels length sticks defined in the
neighborhood. The values of resulting voxels I' were more precisely defined as:
1 1 ' * N i M i i I W = = ! and 1 N i i W g = =! (6)
where I denotes the local median value along the th stick, is the number of sticks
( 2
24 48 26
N= L ! L+ in 3D conditions), L is the number of voxels along the stick, and gi is the
reciprocal of local variance along the ith stick.
L, the length of stick, is the main parameter of this filter. We tested different values of L, from
3 to 7. L should be larger than texture caused by noise and smaller than thin structure (leaflet).
We found that normally, L=5 is suitable for our data sets (voxel is 0.312*0.312*0.625mm^3,
thickness of leaflets is 0.5-1mm, width of noise texture is different in data sets, 3-5 voxels).
Other values of L can be used if the parameters of data set change. L is also determined by
SNR of original CT images. When SNR<=8, L=5; 8<SNR<=10, L=4; SNR>10, L=3.
Besides, the number of iteration is not a critical issue unlike Diffusion Filter. Stick Filter
shows a convergent behavior after several iterations. Typically, in a low SNR condition
(SNR<=8), the result converged after 5 iterations (after 3 iterations when SNR>10). It was not
The drawback of Stick Filter is its high computation complexity. A 5 voxels-length Stick
Filter ( a 9*9*9 cubic neighborhood), requires for each voxel and at each iteration, the
calculation of 386 local medians and local variances. The time of calculation can be decreased
by the stent-defined ROI. The number of voxels located in the ROI is much less than in the
cubic volume encompassing the aortic valve bioprosthesis. Cylindrical ROI typically decreases
the number of voxels to 40% and conformational ROI to 16%.
3 - Valve segmentation
According to surgical expertise, four main classes of tissues were identified. They were
related to the Hounsfield Units (HU) measured by CT. We considered, from high to low HU,
the following classes: stent, calcifications, vascular lumen and leaflets. The first two elements,
showing high CT values, can be easily segmented by thresholding; the issue of segmentation is
more particularly focused on bioprosthetic leaflets.
Two kinds of region-based segmentation processes were implemented, with a decreasing
level of user interactivity.
A - Isotropic Region Growing (IRG)
It was applied using the 3D Slicer software, an open-source application that assists with the
visualization, registration, segmentation and quantification of medical image data. It can be
downloaded at http://www.slicer.org.
Multiple seed points were interactively selected for each component of the prosthesis. The
region growing algorithm was started (26-neighbour connectivity) with automatic calculation
of the criterion used for the aggregation of voxels. This similarity criterion was based on mean
and standard deviation of the voxel values within the considered cubic neighborhood [25]. The
extraction and visualization of the resulting 3D surface meshes delineating the regions were
B - Stick Region Growing (SRG)
To better deal with the segmentation of thin structures, like the components of a valve
bioprosthesis and especially valve leaflets, we developed a directional region growing process
based on stick neighborhood. The segmentation was thus performed by the stick region
growing algorithm applied to a previously selected region of interest (ROI).
Some seeds were interactively selected inside the leaflets at different locations (typically 4
to 6 seeds). A set of N voxels inside the leaflets was defined by considering for each seed the
voxels belonging to their neighborhood. The similarity criterion was locally based on mean
and standard deviation of the CT voxel values along the directions defined by the sticks. This
approach was implemented using MatLab development tools.
In order to examine each voxel in the cubic neighborhood of the seed, we specifically
computed the stick variances in the set of sticks defined by each of these voxels:
2 , 1 ( ) L i j i j I I Var L = ! = " ,
where L is the length of the stick.
L was chosen to be less than the thickness of the leaflets. Typically L was between 3 and 5
voxels (about 1mm).
To ensure region growth is not early stopped, or in other words to limit the number of seed
points selection in some critical cases (highly noisy data), the size of the cubic neighborhood
was chosen to be large enough to include space between homogeneous fragment of leaflets.
We typically used a 342-connected neighborhood (7x7x7). We also defined , 1 1 L m m j j I I L = = ! , the
local mean of the stick with minimum local variance.
The voxels were classified as belonging to the region of the seed voxel ( as a voxel of
normal leaflet tissue) when: (i) Im belongs to the grey level range of normal leaflets and (ii)
determined by the difference of local cubic neighborhood variances of leaflets voxels and
boundary voxels. These variances have been previously calculated in SNR computation (for
image preprocessing). When this voxel belonged to the ROI, it constituted a new seed voxel.
This process was iterated until no new voxel can be marked as a seed.
RESULTS
We obtained preoperative CT images (in-vivo) in four patients (HER, MAG, BOU, DAV)
presenting a degeneration of aortic bioprosthesis. The radiation dose for each patient was
comprised between 440 and 480 DLP (Dose Length Product - mGy x cm). Depending on the
case, the reoperation was performed from 7 to 19 years after implantation for different
pathological reasons. In one case it was a pericardial bioprosthesis (HER), in which bovine
pericardium is cut to reproduce aortic valve leaflets that are sewn on a complete metallic stent.
Three more cases were represented by porcine bioprostheses, in which a porcine aortic valve is
mounted on a complete metallic stent (2 cases: MAG and BOU) or incomplete metallic stent (1
case: DAV). After reoperation, CT-scan images of isolated explanted aortic bioprosthesis were
obtained using the highest image resolution protocol (ex-vivo). Table 2 shows the results of
resolution parameters for in-vivo and ex-vivo images.
The preprocessing based either on diffusion or on stick filter was applied to the in-vivo CT
volumes of the four patients. The bioprosthesis voxels were first isolated by considering the
ROI defined by the stent. An example of original image and the result of two different filters is
reported in Fig. 2. A first qualitative appreciation of the results let appear that stick filter based
approach better enhance the contrast between valve leaflets and surrounding structures.
In addition to this qualitative assessment, the SNR was computed on original images and
resulting images (Fig. 3). This objective assessment showed that stick filtering had the best
Following the ad hoc preprocessing step, the different segmentation methods (IRG and
SRG) were applied to the in-vivo (IV) and ex-vivo (EV) images. Ex-vivo images, easier to
segment with both methods and showing similar results, were used as reference.
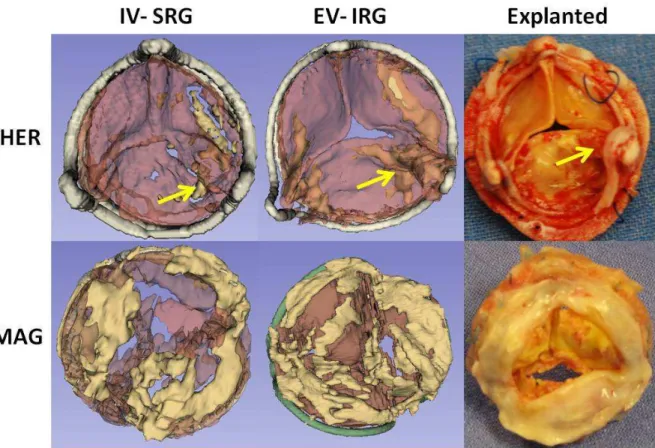
Figures 4 and 5 show some examples of segmentation with both methods. The first case of a
segmented pericardial bioprosthesis (HER) showed minimal leaflet degeneration. The leaflet
prolapse resulting in imperfect coaptation appears as commissure lost in the segmented images.
The second case (MAG), a porcine bioprothesis, was characterized by a calcified pannus that
was responsible for valve obstruction. The pannus was not detected at preoperative
echocardiography.
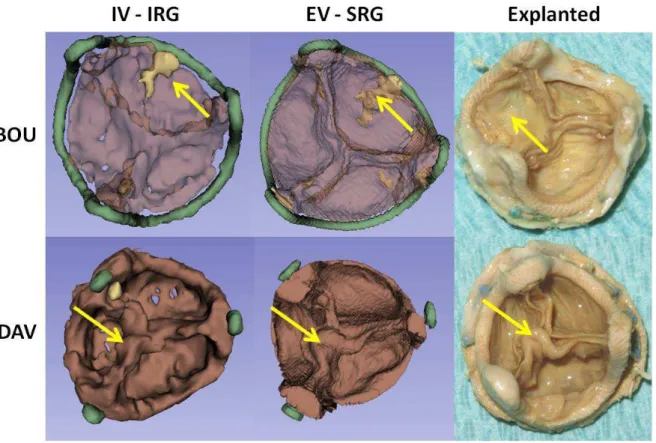
In the third case (BOU) the calcification of a leaflet was responsible for a functional
stenosis of the porcine bioprosthesis. The last case (DAV) was represented by a porcine
bioprosthesis with an incomplete metallic stent. This bioprosthesis, considered as normal at
preoperative echocardiography, was explanted during a surgery for infected ascending aorta
pseudo-aneurysm. Intra-operative evaluation showed leaflets thickening as starting process of
infective endocarditis.
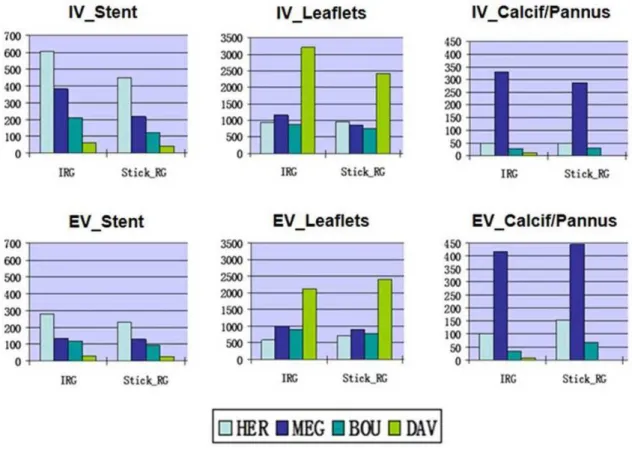
!" #$%&'('%'()*" %&%+,-(-" .%-" '/*&" 01&2$0'*2" '1" 134*0'()*+," 0156%7*" '/*" 7*-$+'-" obtained respectively by IRG and SRG on in-vivo (IV) and ex-vivo (EV) images. The criterion used to
evaluate the results was the volume of bioprothesis components computing the voxel volume
and counting the number of voxels for each component (stent, leaflets, and calcifications).
Results of this analysis are shown in Fig. 6 (volumes are expressed in mm3). When we look at
stent results we find that the stent of the first case is bigger in volumes comparing to the
others. This corresponds to reality because the stent of the bioprosthesis Edwards Perimount
is volumetrically bigger than the Carpentier-Edwards Supra Annular Valve or the Medtronic
Mosaic stents. Moreover stent volumes in vivo are bigger than ex-vivo. Concerning leaflets,
an incomplete stent. In this case segmentation considered the basal part of the non metallic
stent as leaflet. This explains the big volumes of leaflets in this case. The studied
bioprostheses doesn’t show leaflets strongly calcified. Only the case 2 – MAG was
characterized by a calcified sub-valvular pannus that was well represented in volume analysis.
DISCUSSION
An aortic bioprosthesis can have functional degradation and prosthesis dysfunction over time
[27,28]. In more recent bioprostheses, the rate of structural failure appears to be somewhat
lower [29,30] than with the first generation, but it is still occurring.
Obstruction in aortic bioprosthesis may be caused by the presence of thrombus on the leaflets
or stents, by fibrous or calcified pannus (ie, fibrous tissue growing within the bioprosthesis
due to excessive cicatrisation) or by the structural deterioration of leaflets due to calcification.
Prosthetic thrombosis may be suspected clinically when the bioprosthesis shows acute
deterioration of its effective orifice area (EOA). Fibrous pannus and structural deterioration
may be suspected when EAO decreases slowly over time. Treatment is different: thrombosis
may reverse with anticoagulation treatment. Structural deterioration and fibrous pannus are
irreversible and typically require reoperation with replacement of the bioprosthesis, which has
a high risk of surgical morbidity and mortality, especially in elderly patients with associated
comorbidities. Moreover, in the next future, these high risk patients suffering from a structural
valve deterioration of their bioprosthesis, could benefit from the new techniques of
trans-catheter aortic valve implantation (valve-in-valve procedure) [31].
Understanding the precise mechanism of bioprosthesis dysfunction would thus be important
to direct clinical management. Yet, it can often be difficult to identify these entities in clinical
practice. Indeed, both transthoracic and transesophageal echocardiography have limited
usefulness for detection of the mechanism of stenotic bioprostheses, because of the acoustic
CT images would potentially allow better visualization of the bioprosthetic valve leaflets after
aortic valve replacement, but at the moment CT scan softwares don’t allow automatic leaflets
enhancement. In this study we have tested two different implementations of the region growing
segmentation on CT images of degenerated aortic bioprosthesis. These two methods,
considered as semiautomatic segmentation methods, seem to be similar in terms of results even
if different in their approach.
The pre-processing represents a key point of the analysis: bioprostheses CT images need to
be treated before to be segmented because of noise and metallic stent artifacts.
The ROI selection reduces most of the effects of the artifacts. In fact we define a ROI in order
to stop region growing into artifacts. Normally, metal artifact reduction needs a process of
radon translation, interpolation and in-translation. These represent very complex methods that
often loose images details as thin structure. Remaining artifacts could impact on qualitative
and quantitative results of segmentation.
Different filters have been tested in order to improve images by noise reduction and to reach
the best leaflets enhancement. Stick filtering showed the best results and this was confirmed by
SNR analyses. The stick filtering process can directly reduce metal artifacts (without the need
for radon translation) keeping a reliable surrounding tissue. This filtering process is performed
by MatLab software and it takes time to be finalized. To reduce this computing time it is
important to select a ROI that takes into account only the bioprosthesis stent region with its
leaflets. Stick processing time is estimated in 2 hours for each data set from original images to
segmentation. The algorithm can be optimized using more processors to parallelize the process
and obtain faster results in order to improve its clinical application.
Concerning segmentations results, we have some considerations. Among the analyzed data
has to be attributed to the thickness of the valve tissue: pericardial leaflets are largely thicker
than porcine with consequent better detection by CT scan.
There are different factors that could explain the volumes differences observed in some cases
for in-vivo images comparing to ex-vivo. Firstly, image resolution is not the same. In-vivo
acquisition protocol represents the standard protocol used for coronary ECG gated
angio-CT-scan. Changing the acquisition parameters was not considered and specific acquisition for
bioprosthesis analysis doesn’t exist at the moment. For the ex-vivo images we chose the
highest resolution protocol to be close to reality and to use these images as reference. Other
than image resolution, we can consider heart motion and blood superposition as important
factor for volumes differences. These two factors participate to modify the experimental
condition of in-vivo images that explain the differences with ex-vivo images in qualitative and
quantitative analysis.
Computing of leaflets volumes can be altered by the non-metallic part of bioprosthesis stent.
Only the metallic stent can be used as spatial limitation for the leaflets because the non metallic
part has the same density of the leaflets. For this reason leaflet volumes are higher than normal
in the only case with incomplete metallic stent.
Another factor that plays a fundamental role for the quality of in-vivo images (preoperative
images) is the heart rate during the exam. It should be as low as possible and not more than 70
bpm. Patient preoperative clinical conditions can be responsible for higher heart rate and
contra-indicate medical therapy as beta-blockers to reduce it.
In all cases, we observed in-vivo underestimation of leaflets degeneration. This is only
partially true. In fact, in the studied cases, leaflets are not so calcified and most part of
degeneration consists in leaflets thickening. These leaflets modifications do not appear with the
actual calcifications can be detected with consequent underestimation compared to ex-vivo
images, in which smaller differences in density can be easily appreciated.
The study has a number of limitations: the small number of studied data sets and their
heterogeneity do not allow data validation by statistical analysis. Moreover the quantitative
analysis is conducted on in-vivo and ex-vivo data of bioprostheses in different experimental
conditions which can explain the volumetric deviations.
Our study suggests that segmentation of CT images could play a role in clarifying the
mechanism of bioprosthesis dysfunction. Indeed, we demonstrated that segmentation can help
directly visualize leaflet morphology. Furthermore, we demonstrated the ability of these
methods to identify bioprosthesis leaflet thickening, calcification as well as presence of
pannus under bioprosthetic leaflets.
Our preliminary results suggest the feasibility to enhance aortic bioprosthesis leaflets by the
application of the region growing segmentation to preoperative CT images after filtering
process. Because today such morphological evaluation of bioprosthesis leaflets is intricate to
impossible with other imaging techniques, we believe that in the next future CT scan images
segmentation may play an important role to better understand the mechanism of dysfunction
in patients with a degenerated aortic bioprosthesis during normal follow-up. After acquisition
protocols adaptation and methods validations by larger series application, 3D reconstructions
could be used for patient’s selection, planning and simulation of the valve-in-valve procedure.
ACKNOWLEDGMENTS
The authors are grateful to ADETEC Society for the important contribution in this study.
CONFLICT OF INTEREST STATEMENT
All authors attest that there is no conflict of interest or financial/commercial interest in any of
REFERENCES
[1] Vanhoenacker PK , Heijenbrok-Kal MH ,Van Heste R , et al. Diagnostic performance of
multidetector CT angiography for assessment of coronary artery disease: metaanalysis.
Radiology 2007 ; 244 : 419 – 428.
[2] Miller JM , Rochitte CE , Dewey M , et al. Diagnostic performance of coronary
angiography by 64-row CT . N Engl J Med 2008 ; 359 : 2324 – 2336.
[3] Sun Z , Jiang W . Diagnostic value of multislice computed tomography angiography in
coronary artery disease: a meta-analysis. Eur J Radiol 2006 ; 60 : 279 – 286.
[4] Hausleiter J , Meyer T , Hadamitzky M , et al. Non-invasive coronary computed
tomographic angiography for patients with suspected coronary artery disease: the
Coronary Angiography by Computed Tomography with the Use of a Submillimeter
resolution (CACTUS) trial . Eur Heart J 2007 ; 28 : 3034 – 3041.
[5] Budoff MJ , Dowe D , Jollis JG , et al. Diagnostic performance of 64-multidetector row
coronary computed tomographic angiography for evaluation of coronary artery stenosis in
individuals without known coronary artery disease: results from the prospective
multicenter ACCURACY (Assessment by Coronary Computed Tomographic
Angiography of Individuals Undergoing Invasive Coronary Angiography) trial . J Am
Coll Cardiol 2008 ; 52 : 1724 – 1732.
[6] Mowatt G, Cook JA , Hillis GS , et al . 64-slice computed tomography angiography in the
diagnosis and assessment of coronary artery disease: systematic review and metaanalysis.
Heart 2008 ; 94 : 1386 – 1393 .
[7] Juergens KU, Fischbach R . Left ventricular function studied with MDCT . Eur Radiol
[8] Mahnken AH, Koos R , Katoh M , et al. Assessment of myocardial viability in reperfused
acute myocardial infarction using 16-slice computed tomography in comparison to
magnetic resonance imaging . J Am Coll Cardiol 2005 ; 45 : 2042 – 2047.
[9] Gerber BL, Belge B , Legros GJ , et al. Characterization of acute and chronic myocardial
infarcts by multidetector computed tomography: comparison with contrastenhanced
magnetic resonance . Circulation 2006 ; 113 : 823 – 833.
[10] Lardo AC , Cordeiro MA , Silva C , et al . Contrast-enhanced multidetector computed
tomography viability imaging after myocardial infarction: characterization of myocyte
death, microvascular obstruction, and chronic scar . Circulation 2006 ; 113 : 394 – 404.
[11] Teshima H , Aoyagi S , Hayashida N , et al. Dysfunction of an ATS valve in the aortic
position: the first reported case caused by pannus formation . J Artif Organs 2005 ; 8 :
270 – 273 .
[12] Teshima H , Hayashida N , Fukunaga S , et al . Usefulness of a multidetector-row
computed tomography scanner for detecting pannus formation . Ann Thorac Surg 2004 ;
77 : 523 – 526 .
[13] Teshima H , Hayashida N , Enomoto N , Aoyagi S , Okuda K , Uchida M . Detection of
pannus by multidetector-row computed tomography. Ann Thorac Surg 2003 ; 75 : 1631 –
1633.
[14] Aoyagi S , Fukunaga S , Arinaga K , Shojima T , Ueda T . Prosthetic valve obstruction:
diagnostic usefulness of cineradiography and multidetector-row computed tomography.
Thorac Cardiovasc Surg 2007 ; 55 : 517 – 519.
[15] Kim RJ , Weinsaft JW , Callister TQ , Min JK . Evaluation of prosthetic valve
endocarditis by 64-row multidetector computed tomography . Int J Cardiol 2007 ; 120 :
[16] Tsai IC , Lin YK , Chang Y , et al . Correctness of multi-detector-row computed
tomography for diagnosing mechanical prosthetic heart valve disorders using operative
findings as a gold standard. Eur Radiol 2009 ; 19 : 857 – 867.
[17] Konen E , Goitein O , Feinberg MS , et al. The role of ECG-gated MDCT in the
evaluation of aortic and mitral mechanical valves: initial experience. AJR Am J
Roentgenol 2008 ; 191 : 26 – 31 .
[18] Czerwinski R. N., Jones D L. Line and boundary detection in speckle images. IEEE
Trans. Image Processing 1998; 7:1700–1714.
[19] Chang-Yan Xiao, Zhang Su, Ya-zhu Chen. A diffusion stick method for speckle
suppression in ultrasonic images. Pattern Recognition Letters 2004; (25)16:1867-1877.
[20] González RC, Woods RE. Digital image processing. Prentice Hall. p. 354.
[21] Perona P, Malik J. Scale space and edge detection using anisotropic diffusion. IEEE
Transactions on Pattern Analysis and Machine Intelligence, 1990, 12(7): 629-639.
[22] Yezzi A. Modified Curvature Motion for Image Smoothing and Enhancement. IEEE
Transaction on Medical Imaging, Vol 7 (3), 1998.
[23] Qian Y, Zhang Y, Morgan M. A comparison of medical image segmentation methods
for cerebral aneurysm computational hemodynamics. Biomedical Engineering and
Informatics (BMEI), 2011 4th International Conference, 2011, Vol2: 901-904
[24] Brassel M, Bretin E. A modified phase field approximation for mean curvature flow with
conservation of the volume, Mathematical Methods in the Applied Sciences Volume 34,
Issue 10, pages 1157–1180, 15 July 2011.
[25] Boskamp T, Rinck D, Link F, Kummerlen B, Stamm G, Mildenberger P. New vessel
analysis tool for morphometric quantification and visualization of vessels in ct and mr
[26] William E. Lorensen, Harvey E. Cline: Marching Cubes: A high resolution 3D surface
construction algorithm. In: Computer Graphics, Vol. 21, Nr. 4, July 1987.
[27] Bloomfi eld P , Wheatley DJ , Prescott RJ , Miller HC . Twelve-year comparison of a
Bjork-Shiley mechanical heart valve with porcine bioprostheses . N Engl J Med 1991 ;
324 : 573 – 579 .
[28] Hammermeister KE, Sethi GK, Henderson WG, Oprian C, Kim T, Rahimtoola S. A
comparison of outcomes in men 11 years after heart-valve replacement with a mechanical
valve or bioprosthesis. Veterans Affairs Cooperative Study on Valvular Heart Disease . N
Engl J Med 1993 ; 328 : 1289 – 1296 .
[29] Puvimanasinghe JP , Steyerberg EW , Takkenberg JJ , et al . Prognosis after aortic valve
replacement with a bioprosthesis: predictions based on meta-analysis and
microsimulation. Circulation 2001 ; 103 : 1535 – 1541.
[30] Ruggieri VG, Flecher E, Anselmi A, et al. Long-Term Results of the Carpentier-Edwards
Supraannular Aortic Valve Prosthesis. Ann Thorac Surg. 2012 Jul 7.
[31] Piazza N, Bleiziffer S, Brockmann G, et al. D. Transcatheter aortic valve implantation for
failing surgical aortic bioprosthetic valve: from concept to clinical application and
!"#$%&'
Tab. 1: pre-operative echocardiographic assessment and intra-operative failure evaluation of studied bioprostheses.'
Case Bioprosthesis type Bioprosthesis Size Echocardiographic assessment Failure mechanism
1 - HER Edwards Perimount 23 mm Aortic regurgitation Leaflet prolapse
2 - MAG Edwards SAV 25 mm Aortic stenosis Calcified pannus
3 - BOU Edwards SAV 23 mm Aortic stenosis Leaflet calcification
4 - DAV Medtronic Mosaic 23 mm Normal Endocarditis
'
Figures Legend
Fig. 1: 3D representation of a cylindrical (a) or conformational (b) region of interest.
Fig. 2: Example of results about pre-processing by diffusion and stick filters for case n 3 -
BOU. The same section, before and after filtering processes, is presented including the stent
Fig. 3: Results of preprocessing (SNR) with stick filter and curvature diffusion filter for each
Fig. 4: Examples of segmentation results for cases HER (the yellow arrows show the
Fig. 5: Examples of segmentation results for cases BOU (yellow arrows show the calcified