HAL Id: inserm-01098222
https://www.hal.inserm.fr/inserm-01098222
Submitted on 23 Dec 2014
HAL is a multi-disciplinary open access
archive for the deposit and dissemination of
sci-entific research documents, whether they are
pub-lished or not. The documents may come from
teaching and research institutions in France or
abroad, or from public or private research centers.
L’archive ouverte pluridisciplinaire HAL, est
destinée au dépôt et à la diffusion de documents
scientifiques de niveau recherche, publiés ou non,
émanant des établissements d’enseignement et de
recherche français ou étrangers, des laboratoires
publics ou privés.
Detection of independent associations in a large
epidemiologic dataset: a comparison of random forests,
boosted regression trees, conventional and penalized
logistic regression for identifying independent factors
associated with H1N1pdm influenza infections
Yohann Mansiaux, Fabrice Carrat
To cite this version:
Yohann Mansiaux, Fabrice Carrat. Detection of independent associations in a large epidemiologic
dataset: a comparison of random forests, boosted regression trees, conventional and penalized logistic
regression for identifying independent factors associated with H1N1pdm influenza infections. BMC
Medical Research Methodology, BioMed Central, 2014, 14, pp.99. �10.3201/eid1610.100516�.
�inserm-01098222�
R E S E A R C H A R T I C L E
Open Access
Detection of independent associations in a large
epidemiologic dataset: a comparison of random
forests, boosted regression trees, conventional
and penalized logistic regression for identifying
independent factors associated with H1N1pdm
influenza infections
Yohann Mansiaux
1,2*and Fabrice Carrat
1,2,3Abstract
Background: Big data is steadily growing in epidemiology. We explored the performances of methods dedicated to big data analysis for detecting independent associations between exposures and a health outcome.
Methods: We searched for associations between 303 covariates and influenza infection in 498 subjects (14% infected) sampled from a dedicated cohort. Independent associations were detected using two data mining methods, the Random Forests (RF) and the Boosted Regression Trees (BRT); the conventional logistic regression framework (Univariate Followed by Multivariate Logistic Regression - UFMLR) and the Least Absolute Shrinkage and Selection Operator (LASSO) with penalty in multivariate logistic regression to achieve a sparse selection of
covariates. We developed permutations tests to assess the statistical significance of associations. We simulated 500 similar sized datasets to estimate the True (TPR) and False (FPR) Positive Rates associated with these methods. Results: Between 3 and 24 covariates (1%-8%) were identified as associated with influenza infection depending on the method. The pre-seasonal haemagglutination inhibition antibody titer was the unique covariate selected with all methods while 266 (87%) covariates were not selected by any method. At 5% nominal significance level, the TPR were 85% with RF, 80% with BRT, 26% to 49% with UFMLR, 71% to 78% with LASSO. Conversely, the FPR were 4% with RF and BRT, 9% to 2% with UFMLR, and 9% to 4% with LASSO.
Conclusions: Data mining methods and LASSO should be considered as valuable methods to detect independent associations in large epidemiologic datasets.
Keywords: Data mining, Random forest, Boosted regression trees, LASSO, Logistic regression, Influenza
* Correspondence:yohann.mansiaux@iplesp.upmc.fr 1
INSERM, UMR_S 1136, Institut Pierre Louis d’Epidémiologie et de Santé Publique, F-75013 Paris, France
2Sorbonne Universités, UPMC Univ Paris 06, UMR_S 1136, Institut Pierre Louis d’Epidémiologie et de Santé Publique, F-75013 Paris, France
Full list of author information is available at the end of the article
© 2014 Mansiaux and Carrat; licensee BioMed Central Ltd. This is an Open Access article distributed under the terms of the Creative Commons Attribution License (http://creativecommons.org/licenses/by/4.0), which permits unrestricted use, distribution, and reproduction in any medium, provided the original work is properly credited. The Creative Commons Public Domain Dedication waiver (http://creativecommons.org/publicdomain/zero/1.0/) applies to the data made available in this article, unless otherwise stated.
Mansiaux and Carrat BMC Medical Research Methodology 2014, 14:99 http://www.biomedcentral.com/1471-2288/14/99
Background
“Big data” [1] in information science refers to the collec-tion and management of large and complex datasets. Big data is steadily growing in biomedicine with the de-velopment of electronic medical records, increased use of high-throughput technologies, and facilitated access to large environmental database [2-6]. In epidemiology, the collection of hundreds to thousands of covariates is common in large-scale cohort studies and offers new challenges for the discovery of associations between in-dividual or collective exposures and a health outcome. The use of specific methods to explore these associations, without any pre-specified hypothesis, therefore becomes essential.
In hypothesis-driven epidemiology, the search for associations involves statistical modeling and testing of the relationships between one or several covariates and the outcome. Logistic regression is the most widely used model when the outcome follows a binomial dis-tribution. The usual epidemiologic analytic framework consists in testing the association between each covariate and the outcome through univariate logistic models; a subset of those covariates is then selected for multivariate logistic models based on some quantile of the test statistic for the covariate coefficient under the null hypothesis, i.e. the Pvalue. This framework is the reference method in epidemiology for variable selection, and the use of alterna-tive approaches remains uncommon [7,8]. With large datasets, the number of covariates selected in the uni-variate analyses can be high. As multiuni-variate logistic re-gression can handle a limited number of covariates simultaneously [9], it might therefore be poorly adapted to large epidemiologic datasets for identifying inde-pendent associations.
“Data mining”, a term which appeared in the early 1990’s [10], describes data-driven analysis without any a
priori hypothesis about the structure or the potential
relationships that could exist in the data. Data mining applications are broad, ranging from consumption ana-lysis to fraud detection in high-dimensional databases [11]. Data mining methods are non-parametric, more flexible than statistical regression methods, and are able to deal with a large number of covariates. Several studies have compared the performances of logistic regression and data mining methods for predicting a health outcome without clear conclusions about the superiority of one of these methods over the others [12-17]. Most studies explored classification and regression trees, artificial neural networks or linear discriminant analysis, but only a few focused on more recently developed “ensem-ble-based” methods such as random forests or boosted regression trees [13,16,17].
Shrinkage methods, such as the Least Absolute Shrinkage and Selection Operator (LASSO) [18], have been developed
to overcome the limitation of usual regression models when the number of covariates is high. However, LASSO logistic regression remains unfamiliar to epide-miologists and few applications of this method have been found [19,20].
We hereby performed a comparison of two data min-ing methods, random forests and boosted regression trees, with the conventional multivariate logistic regres-sion and with the LASSO logistic regresregres-sion for identi-fying independent associations in a large epidemiologic dataset including hundreds of covariates. Random for-ests and boosted regression trees were chosen among data mining methods for their ability to provide quanti-tative information about the strength of association be-tween covariates and the outcome. The methods were used to detect covariates associated with H1N1 pan-demic (pdm) influenza infections. We also assessed the performance of these methods to detect associations through simulations.
Methods
Data source
We used data from the CoPanFlu France cohort whose aim was to study the risk of influenza infection. Briefly, the cohort includes 601 households randomly selected between December 2009 and July 2010 and followed using an active surveillance system in order to detect influenza-like illness symptoms over two consecutive influenza seasons (2010–2011 and 2011–2012). More details about the study protocol, data collection and rep-resentativeness of households can be found elsewhere [21]. Ethics approval was given for this study by the institutional review board “Comité de Protection des Personnes Ile-de-France 1” and written informed consent was obtained for all participants.
The outcome of our study was H1N1pdm influenza infection during 2010–2011 season, defined as either a positive H1N1pdm RT-PCR [22] or a positive H1N1pdm RespiFinder assay [23] on a nasal swab collected during winter 2010–2011 or a seroconversion (4-fold increase of Haemagglutination inhibition (HAI) antibody titer [24] between post and pre-seasonal serum samples). Infection status for the 2010–2011 season was available in house-hold members from 498 househouse-holds. To neutralize within household correlation and ensure statistical independence of individuals included in the analysis, we adopted a case– control selection strategy. One case was sampled from each household where at least one influenza infection was detected and one control was selected from each house-hold where no influenza infection occurred. Our analysis therefore focused on 498 subjects, 68 (14%) cases and 430 controls. Association with the outcome was explored for 303 covariates (a complete description can be found in Lapidus et al. [25]).
Mansiaux and Carrat BMC Medical Research Methodology 2014, 14:99 Page 2 of 10
The mean age of study subjects was 44.3 years (SD = 21.1); 42% (208 individuals) were male. A total of 215 subjects (43%) had at least one history of chronic disease. The proportions of seasonal and pandemic vaccines recipients for 2009–2010 season were 19% and 10%, respectively. The mean number of subjects per household was 2.5 (SD = 1.3) and the number of children per household was 0.5 (SD = 0.9).
Methods for detection of independent associations Random forests (RF)
Random Forests models were proposed by Leo Breiman [26]. RF consists of an ensemble of classification and re-gression trees. Each tree of the random forest is built as followed: a bootstrap sample of the original dataset is drawn with replacement. The rest of the observations compose the “out-of-bag” sample, used to assess the per-formances of the selected tree. At each node of the tree, a random subset of covariates is selected (usually as much as the square root of the total number of covari-ates). Selection of a covariate to split a “parent” node into two “child” nodes is the covariate among the subset leading to the largest decrease in the Gini impurity
criter-ion, that is, for a binary outcome, 1 – p2– (1 – p)2with p
the proportion of individuals classified with the outcome (the influenza infection in our case). The partitioning process is iterated until the final nodes contain only indi-viduals belonging to the same classes or until they contain only one individual. The tree is then used to classify every individual in the “out-of-bag” sample. This process is re-peated until a pre-specified number of trees is reached (one thousand). Note that prediction for each individ-ual is based on the averaged predictions over all trees. To rank potential relevant associations with covariates selected in the RF, we used the importance score, i.e., the decrease in Gini impurity criterion from splitting on the covariate, averaged over all trees.
Boosted regression trees (BRT)
Boosted regression trees is another ensemble method combining regression trees with weak individual pre-dictive performances, into a single model with high performances [27,28].
First a regression tree model is fitted to a subset of data to minimize a loss function (in our case the deviance), which quantifies the loss in predictive performance due to a suboptimal model. The “boosting” algorithm is a numerical optimization technique for minimizing the loss function by iteratively fitting new trees to the prediction residuals of the preceding tree. For example, at the second step, a tree is fitted to the residuals of the first tree, and that second tree could contain different covariates and split nodes compared with the first. The two regression trees are combined and the residuals
are calculated, a new tree is fitted and so on. To im-prove accuracy and reduce overfitting, each regression tree is grown from a bootstrap sample (without re-placement) of the original dataset (usually 50% of the original sample) [29]. The final model is built by com-bining weighted individual tree contributions, weights being proportional to the trees performances.
To assess and rank potential associations with covari-ates, we used the Friedman “relative influence” [27], i.e., the number of times a covariate is selected for splitting, weighted by the squared improvement of the loss func-tion by splitting on that covariate. One thousand trees were used for each model. To allow complex interaction detection, the “interaction.depth” parameter of the BRT models was set to a value of 3; implying models with up to 3-way interactions.
Conventional logistic regression framework
Logistic regression (LR) is a well-known Generalized Linear Model adapted to test association between a bi-nomial outcome and covariates [30]. In order to iden-tify independent associations, we reproduced the usual epidemiologic analytic framework – that is, Univariate Followed by Multivariate Logistic Regression (UFMLR). We explored two thresholds for the selection of covari-ates in the univariate step, Pvalue <0.05 (UFMLR05) and Pvalue <0.20 (UFMLR20), with coefficient tested with the Wald test. We also distinguished whether or not a back-ward selection of covariates was further applied in multi-variate regression model.
Least Absolute Shrinkage and Selection Operator logistic regression (LASSO)
We used LASSO to fit a multivariate logistic model with penalty on the magnitude of coefficients. The LASSO method maximizes the log-likelihood of the model, while applying constraints on the sum of the absolute values of the coefficients– shrinking the less important coefficients to zero [18]. The constraint was expressed in terms of a penalty parameter; the optimal value of this parameter was determined by minimizing the deviance of the multi-variate logistic model (hereafter called LASSO-max) aver-aged over five-fold cross-validation subsamples [31]. In addition to this optimal model, we also considered a parsi-monious LASSO model with a higher penalty parameter (hereafter called LASSO-se) so that the mean deviance of the model was within one standard error of the LASSO-max average deviance [28,32]. To rank potential associa-tions with covariates, we used the proportion of estimated non-null parameters over one hundred LASSO models.
Permutation test for statistical significance of associations
No threshold exists to assess the statistical significance of measures of association, i.e. the Gini impurity criterion in
Mansiaux and Carrat BMC Medical Research Methodology 2014, 14:99 Page 3 of 10
RF models or the Friedman relative influence in BRT models or the proportion of estimated non-null parame-ters in LASSO models. We used permutation tests [33], which were applied in RF models to derive Pvalues for predictors and were suggested to be used with any method that provides a measure of covariate relevance [34]. The null hypothesis was the absence of association between a given covariate and the outcome. We computed the Pva-lue by randomly permuting 999 times the vaPva-lues of the outcome and comparing the measures of association of the covariates in the permuted datasets with that from the original dataset [35]. Permutation of the outcome has the advantage of preserving the dependence structure between the covariates [34]. The one-sided Pvalue was computed
as follows: Px¼1þ Number of permuted datasets where Sper
>Sobs
1þNumber of permutations with
Sperand Sobsthe measures of association for covariate x in
the permuted and the real dataset, respectively. To in-crease consistency we also applied this method to UFMLR models, using the Wald test statistic as measure of associ-ation. We also checked whether permutation test Pvalues were similar to those obtained with the conventional Wald test (see Additional file 1).
Simulated data
To assess the performances of the different methods in detection of associations in a similar-sized dataset, we sim-ulated 500 datasets with 500 individuals and 300 covari-ates, sampled from a multivariate normal distribution (the simulation process is detailed in Additional file 1). The simulated logit model involved 150 continuous and 150 binary covariates. Four covariates of each type were directly associated with the outcome. Four covariates (2 binary and 2 continuous) were involved in pairwise multiplicative interactions. Two hundred and ninety-two covariates were not associated (neither directly nor through interactions) with the outcome. Twenty covariates (the 8 associated covariates and 12 non-associated covariates - 6 continuous and 6 binary) were correlated (ρ = 0.5). To ex-plore the influence of correlation among a higher number of covariates, we increased the number of correlated co-variates to 58 (the 8 associated coco-variates and 50 non-associated covariates – see Additional file 1). For both simulations, the number of permutations of the outcome was set to 99. Performances were assessed in terms of True Positive Rate (TPR), i.e. the proportion of associated covariates which were detected, and False Positive Rate (FPR), i.e. the proportion of non-associated covariates which were detected, at 5% nominal level (see Additional file 1 for TPR and FPR at 1% nominal level). We also distinguished between covariates with and without pair-wise interactions for the calculation of TPR, and be-tween covariates with and without correlations with associated covariates for the calculation of FPR.
Fitting procedures and software
In all analyses, the covariates were centered and scaled prior to model fitting.
Statistical analyses were performed with R version 2.15.3. The following packages were used: “randomForest” [36] for RF models, “gbm” [37] for BRT models, “glmnet” [31] for LASSO-LR models.
Results
Detection of associations in the CoPanFlu dataset
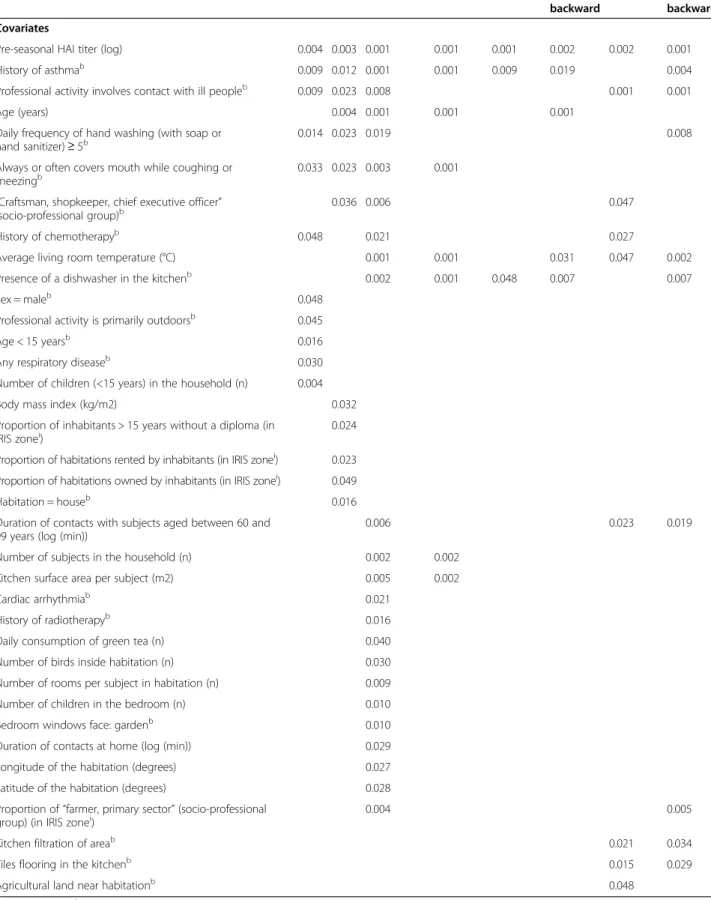
With a nominal type I error of 5%, 11 independent asso-ciations were identified with RF, 12 with BRT, 24 with the LASSO-max, 8 with the LASSO-se, 3 to 5 with UFMLR05, and 9 to 10 with UFMLR20 (Table 1). Asso-ciation between influenza infection and the pre-seasonal HAI titer was detected with all methods. The covariates “History of asthma”, “Professional activity involves con-tact with ill people”, “Daily frequency of hand washing (with soap or hand sanitizer) ≥ 5” and “Always or often covers mouth while coughing or sneezing”, were also identified by RF, BRT, and LASSO-max. This last covari-ate, as well as 23 additional covariates, were not detected by any of the UFMLR methods. Three associations iden-tified by UFMLR20, with or without backward selection, were not retrieved by any of the data mining or LASSO methods. Of note, backward selection applied in UFMLR was associated with more and sometimes different asso-ciations than UFLMR without selection. Finally, 266 (87%) covariates were not selected by any method.
Simulated data
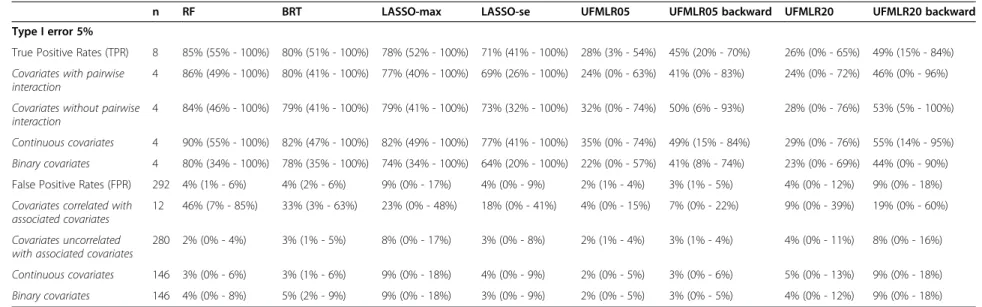
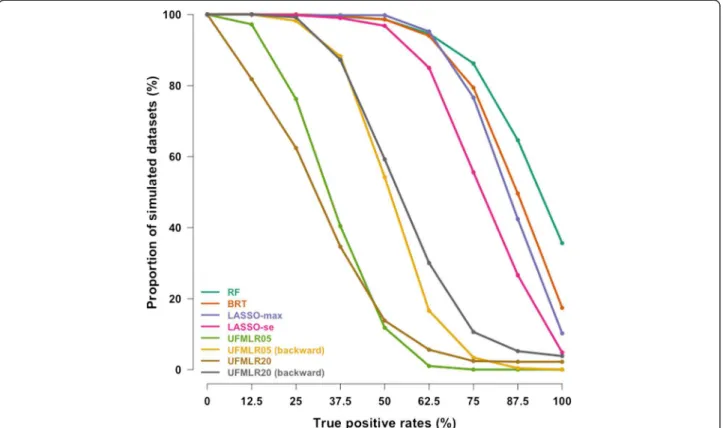
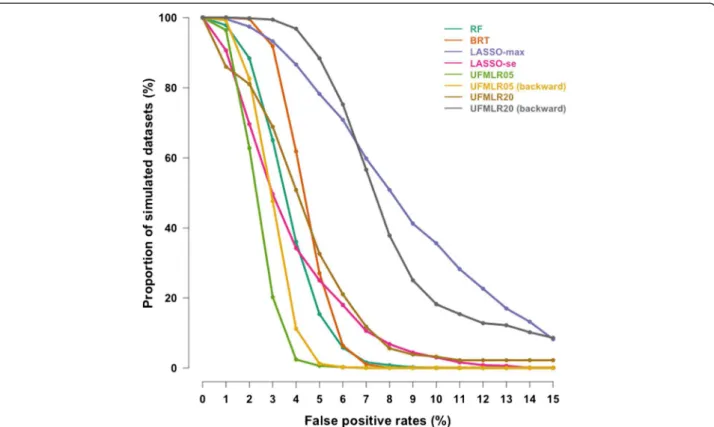
At 5% nominal level, the True Positive Rate was 85% with RF, 80% with BRT and 71% to 78% with LASSO (Table 2). The UFMLR, with or without backward selec-tion, was the least efficient method at detecting true as-sociations, with a TPR ranging between 26% and 49%. All methods, except RF and BRT, exhibited higher TPR when associated covariates did not interact with other associated covariates. The TPR for continuous covariates was higher than the TPR for binary covariates with all methods. The proportion of simulated datasets in which all associated covariates were detected was 36% with RF, 17% for BRT, 10% for LASSO-max, 5% for LASSO-se, 0% for UFMLR05 with or without backward selection, 4% and 2% for UFMLR20 with and without backward se-lection, respectively (Figure 1). UFMLR20 without back-ward selection detected none of the associated covariates in 18% of the simulated datasets. Overall, the FPR was below or equal to the nominal type I error with all methods except for LASSO-max and UFMLR20 with backward selection. UFLMR05 without backward selec-tion was the most conservative with a FPR of 2% (Table 2 and Figure 2). RF, BRT, LASSO methods and UFMLR20 with backward selection suffered from an increase of type
Mansiaux and Carrat BMC Medical Research Methodology 2014, 14:99 Page 4 of 10
Table 1 Significant associations with RF, BRT, LASSO and UFMLR
RF BRT LASSO-max LASSO-se UFMLR05 UFMLR05
backward
UFMLR20 UFMLR20 backward Covariates
Pre-seasonal HAI titer (log) 0.004 0.003 0.001 0.001 0.001 0.002 0.002 0.001
History of asthmab 0.009 0.012 0.001 0.001 0.009 0.019 0.004
Professional activity involves contact with ill peopleb 0.009 0.023 0.008 0.001 0.001
Age (years) 0.004 0.001 0.001 0.001
Daily frequency of hand washing (with soap or hand sanitizer) ≥ 5b
0.014 0.023 0.019 0.008
Always or often covers mouth while coughing or
sneezingb 0.033 0.023 0.003 0.001
“Craftsman, shopkeeper, chief executive officer” (socio-professional group)b
0.036 0.006 0.047
History of chemotherapyb 0.048 0.021 0.027
Average living room temperature (°C) 0.001 0.001 0.031 0.047 0.002
Presence of a dishwasher in the kitchenb 0.002 0.001 0.048 0.007 0.007
Sex = maleb 0.048
Professional activity is primarily outdoorsb 0.045
Age < 15 yearsb 0.016
Any respiratory diseaseb 0.030
Number of children (<15 years) in the household (n) 0.004
Body mass index (kg/m2) 0.032
Proportion of inhabitants > 15 years without a diploma (in
IRIS zonei) 0.024
Proportion of habitations rented by inhabitants (in IRIS zonei) 0.023 Proportion of habitations owned by inhabitants (in IRIS zonei) 0.049
Habitation = houseb 0.016
Duration of contacts with subjects aged between 60 and 99 years (log (min))
0.006 0.023 0.019
Number of subjects in the household (n) 0.002 0.002
Kitchen surface area per subject (m2) 0.005 0.002
Cardiac arrhythmiab 0.021
History of radiotherapyb 0.016
Daily consumption of green tea (n) 0.040
Number of birds inside habitation (n) 0.030
Number of rooms per subject in habitation (n) 0.009
Number of children in the bedroom (n) 0.010
Bedroom windows face: gardenb 0.010
Duration of contacts at home (log (min)) 0.029
Longitude of the habitation (degrees) 0.027
Latitude of the habitation (degrees) 0.028
Proportion of “farmer, primary sector” (socio-professional
group) (in IRIS zonei) 0.004 0.005
Kitchen filtration of areab 0.021 0.034
Tiles flooring in the kitchenb 0.015 0.029
Agricultural land near habitationb 0.048
bbinary covariate.iIRIS zones are statistical block groups of about 2000 inhabitants defined by the French Institut National de la Statistique et des Etudes
Economiques (INSEE).
Mansiaux and Carrat BMC Medical Research Methodology 2014, 14:99 Page 5 of 10
Table 2 Performances of RF, BRT, LASSO and UFMLR in the 500 simulated datasets
n RF BRT LASSO-max LASSO-se UFMLR05 UFMLR05 backward UFMLR20 UFMLR20 backward
Type I error 5%
True Positive Rates (TPR) 8 85% (55% - 100%) 80% (51% - 100%) 78% (52% - 100%) 71% (41% - 100%) 28% (3% - 54%) 45% (20% - 70%) 26% (0% - 65%) 49% (15% - 84%)
Covariates with pairwise interaction
4 86% (49% - 100%) 80% (41% - 100%) 77% (40% - 100%) 69% (26% - 100%) 24% (0% - 63%) 41% (0% - 83%) 24% (0% - 72%) 46% (0% - 96%)
Covariates without pairwise interaction
4 84% (46% - 100%) 79% (41% - 100%) 79% (41% - 100%) 73% (32% - 100%) 32% (0% - 74%) 50% (6% - 93%) 28% (0% - 76%) 53% (5% - 100%)
Continuous covariates 4 90% (55% - 100%) 82% (47% - 100%) 82% (49% - 100%) 77% (41% - 100%) 35% (0% - 74%) 49% (15% - 84%) 29% (0% - 76%) 55% (14% - 95%)
Binary covariates 4 80% (34% - 100%) 78% (35% - 100%) 74% (34% - 100%) 64% (20% - 100%) 22% (0% - 57%) 41% (8% - 74%) 23% (0% - 69%) 44% (0% - 90%) False Positive Rates (FPR) 292 4% (1% - 6%) 4% (2% - 6%) 9% (0% - 17%) 4% (0% - 9%) 2% (1% - 4%) 3% (1% - 5%) 4% (0% - 12%) 9% (0% - 18%)
Covariates correlated with associated covariates
12 46% (7% - 85%) 33% (3% - 63%) 23% (0% - 48%) 18% (0% - 41%) 4% (0% - 15%) 7% (0% - 22%) 9% (0% - 39%) 19% (0% - 60%)
Covariates uncorrelated with associated covariates
280 2% (0% - 4%) 3% (1% - 5%) 8% (0% - 17%) 3% (0% - 8%) 2% (1% - 4%) 3% (1% - 4%) 4% (0% - 11%) 8% (0% - 16%)
Continuous covariates 146 3% (0% - 6%) 3% (1% - 6%) 9% (0% - 18%) 4% (0% - 9%) 2% (0% - 5%) 3% (0% - 6%) 5% (0% - 13%) 9% (0% - 18%)
Binary covariates 146 4% (0% - 8%) 5% (2% - 9%) 9% (0% - 18%) 3% (0% - 9%) 2% (0% - 5%) 3% (0% - 5%) 4% (0% - 12%) 9% (0% - 18%)
Performances are shown as: Mean (95% confidence interval).
Mansiaux and Carrat BMC Medical Research Method ology 2014, 14 :99 Page 6 of 10 http://ww w.biomedce ntral.com/1 471-2288/14/99
I error when the non-associated covariates were correlated with associated covariates.
When increasing the number of non-associated covari-ates correlated with associated covaricovari-ates, the TPR de-creased with all methods, except for UFMLR20 with backward selection. The FPR were close to the FPR ob-served with a lower number of non-associated correlated covariates, with the exception of UFMLR20 with backward selection (14%, see Additional file 1).
Discussion
Without any pre-specified hypotheses, Random Forests, Boosted regression trees and LASSO models identified 8 to 24 covariates independently associated with influenza infection, among which 23 were not detected by the “univariate followed by multivariate logistic regression” framework. On the other hand, when a Pvalue threshold of 0.20 was applied to select covariates for multivariate lo-gistic regression during univariate lolo-gistic models, a sub-stantial number of spurious independent associations were detected which were not retrieved by any other methods. Simulations showed that RF, BRT and LASSO outperformed the conventional logistic framework to tect independent associations, while the false positive de-tection rates remained at the nominal significance level
(RF, BRT and LASSO-se) or moderately increased above it (LASSO-max).
When covariates not associated with the outcome were correlated with covariates associated with the outcome, the false positive rate was high, particularly with RF. For this method, this finding was explained by the sensitivity of the Gini impurity criterion to between-covariates cor-relation [38]. More strikingly, increasing the number of correlated covariates also affected the true positive rate, which decreased with almost all methods (see Additional file 1). This finding may be attributed to a decrease of covariate strength of association due to a large number of correlated covariates and consequently, a decrease to be detected by any of the methods, as was shown in RF and LASSO [39].
In this work, we used an exploratory approach to analyze a large epidemiologic dataset, i.e. we aimed to detect associations between numerous covariates and an outcome, without pre-specified hypothesis. Despite the high number of covariates under study, the multiple test-ing issue was not considered. It is common to disttest-inguish between two type of error rates: the comparisonwise error rate (CER) which corresponds to the probability, for an in-dividual test, to reject the null hypothesis when it is actu-ally true; and the experimentwise error rate (EER - also known as the familywise error rate), which corresponds to Figure 1 Cumulative distribution curves of the True Positive Rates in the 500 simulated datasets. y-axis shows the proportion of simulated datasets with True Positive Rates above or equal to the True Positive Rates on the x-axis.
Mansiaux and Carrat BMC Medical Research Methodology 2014, 14:99 Page 7 of 10
the probability of rejecting at least one true null hy-pothesis among the multiple tests performed [40]. Ac-cording to the simulations performed, we observed that the false positive rates associated to the permuta-tion test was close to the expected CER level (5%) with almost all methods. Working at the individual covari-ate level, no adjustment was necessary. Adjusting Pva-lues would have been required if the EER had to be controlled, e.g. in order to build a predictive model or to confirm the detected associations [41]. It is never-theless essential to keep in mind that the significant re-sults correspond to exploratory rere-sults, which require further confirmation.
To our knowledge, our study is the first to compare the performance in terms of associations detection of the random forest and boosted regression trees import-ance measures to the LASSO and the widely used analytic framework in the simultaneous analysis of hundreds to thousands of covariates to detect independent associa-tions, a growing issue in epidemiology. Although such datasets offer analytic challenges, they are hardly com-parable to datasets explored in omic-based approaches, in which the number of covariates (up to millions) is far higher to the number of samples, and for which the use of dedicated approaches, e.g. the elastic net penalty [42], would have been unavoidable.
Some associations with influenza infection detected with RF, BRT or LASSO-se methods were expected: HAI titers are well-known correlates of protection against in-fluenza infection [43], young age is a known risk factor for H1N1pdm influenza infection [44], non-pharmaceutical preventive measures such as handwashing have been found to be determinants of H1N1pdm infection [45], and asthma was also reported as a specific risk factor [46]. Having a professional activity involving contact with ill people sounds logical as a potential risk factor, and several reports have shown that hospital staff were at increased risk of infection [47]. For other associations, e.g. “Always or often covers mouth while coughing or sneezing”, we did not find consistent findings in the literature and it could be hard to hypothesize how the detected covari-ates could be linked with the risk of H1N1pdm influ-enza infection. However, “Professional activity involves contact with ill people” and age were correlated with this covariate (ρ = 0.10, Pvalue = 0.020 and ρ = 0.29, Pvalue < 0.001, respectively); based on our simulation findings we suspect that this association, as many others (e.g. “Presence of a dishwasher in the kitchen”), are likely to be false positives.
Having no prior knowledge about the covariates truly associated with influenza infections we performed a simulation study to assess the performances of the Figure 2 Cumulative distribution curves of the False Positive Rates in the 500 simulated datasets. y-axis shows the proportion of
simulated datasets with False Positive Rates above or equal to the False Positive Rates on the x-axis.
Mansiaux and Carrat BMC Medical Research Methodology 2014, 14:99 Page 8 of 10
different methods at detecting true and false associations in similar sized data, with a similar number of positive outcomes and covariates. Although we did not perform an extensive analysis exploring varying proportions of associated covariates or interactions between covariates, our simulations clearly demonstrated that UFMLR, with or without backward selection, were inefficient. We de-veloped permutation tests to assess the significance of the covariates association with the outcome in RF, BRT and LASSO; their results with UFMLR were comparable to that of the Wald test in terms of nominal coverage (see Additional file 1). Although permutation tests ex-hibited slightly less power than the Wald test, this did not modify our general findings.
Conclusions
The conventional multivariate logistic regression frame-work is obviously not adapted for exploratory analysis of large epidemiologic datasets in view of detecting inde-pendent associations without any pre-specified hypoth-esis. In this respect, data mining methods and LASSO should be considered as credible alternatives to multi-variate logistic regression.
Additional file
Additional file 1: Simulation process description and additional simulation results. Description of the simulation process; TPR and FPR at 1% nominal significance level; TPR and FPR with an increased number of correlated covariates; and comparisons of UFMLR TPR and FPR with Wald test and permutation test.
Abbreviations
LASSO:Least absolute shrinkage and selection operator; H1N1pdm influenza: H1N1 pandemic influenza; HAI: Haemagglutination inhibition; RF: Random forests; BRT: Boosted regression trees; LR: Logistic regression; UFMLR: Univariate followed by multivariate logistic regression; TPR: True positive rate; FPR: False positive rate.
Competing interests
The authors declare that they have no competing interests. Authors’ contributions
YM and FC conceived and designed the experiments. YM performed the experiments and analyzed the data. YM and FC wrote the paper. All authors read and approved the final manuscript.
Acknowledgements
We thank Rosemary M. Delabre for critical review of the manuscript. This work was supported by the Ministry of Higher Education and Research of France.
Author details 1
INSERM, UMR_S 1136, Institut Pierre Louis d’Epidémiologie et de Santé Publique, F-75013 Paris, France.2Sorbonne Universités, UPMC Univ Paris 06, UMR_S 1136, Institut Pierre Louis d’Epidémiologie et de Santé Publique, F-75013 Paris, France.3Public Health Unit, Saint-Antoine Hospital, 75012 Paris, France.
Received: 24 April 2014 Accepted: 14 August 2014 Published: 26 August 2014
References
1. Trelles O, Prins P, Snir M, Jansen RC: Big data, but are we ready? Nat Rev
Genet 2011, 12:224.
2. Fontana JM, Alexander E, Salvatore M: Translational research in infectious disease: current paradigms and challenges ahead. Transl Res 2012, 159:430–453.
3. Shah NH, Tenenbaum JD: The coming age of data-driven medicine: translational bioinformatics’ next frontier. J Am Med Informatics Assoc 2012, 19:e2–e4.
4. Bougnères P, Valleron A-J: Causes of early-onset type 1 diabetes: toward data-driven environmental approaches. J Exp Med 2008, 205:2953–2957. 5. Choi H, Pavelka N: When one and one gives more than two: challenges
and opportunities of integrative omics. Front Genet 2011, 2:105. 6. Murdoch TB, Detsky AS: The inevitable application of big data to health
care. JAMA 2013, 309:1351–1352.
7. Liao H, Lynn HS: A survey of variable selection methods in two Chinese epidemiology journals. BMC Med Res Methodol 2010, 10:87.
8. Walter S, Tiemeier H: Variable selection: current practice in epidemiological studies. Eur J Epidemiol 2009, 24:733–736. 9. Peduzzi P, Concato J, Kemper E, Holford TR, Feinstein AR: A simulation
study of the number of events per variable in logistic regression analysis. J Clin Epidemiol 1996, 49:1373–1379.
10. Smyth P: Data mining: data analysis on a grand scale? Stat Methods Med
Res 2000, 9:309–327.
11. Maimon O, Rokach L (Eds): Data Mining and Knowledge Discovery Handbook. New York: Springer; 2010.
12. Austin PC: A comparison of regression trees, logistic regression, generalized additive models, and multivariate adaptive regression splines for predicting AMI mortality. Stat Med 2007, 26:2937–2957. 13. Maroco J, Silva D, Rodrigues A, Guerreiro M, Santana I, DE Mendonca A: Data
mining methods in the prediction of dementia: a real-data comparison of the accuracy, sensitivity and specificity of linear discriminant analysis, logistic regression, neural networks, support vector machines, classification trees and random forests. BMC Res Notes 2011, 4:299.
14. Green M, Björk J, Forberg J, Ekelund U, Edenbrandt L, Ohlsson M: Comparison between neural networks and multiple logistic regression to predict acute coronary syndrome in the emergency room. Artif Intell Med 2006, 38:305–318.
15. Regnier-Coudert O, McCall J, Lothian R, Lam T, McClinton S, N’dow J: Machine learning for improved pathological staging of prostate cancer: a performance comparison on a range of classifiers. Artif Intell Med 2012, 55:25–35.
16. Austin PC, Lee DS, Steyerberg EW, Tu JV: Regression trees for predicting mortality in patients with cardiovascular disease: what improvement is achieved by using ensemble-based methods? Biometrical J 2012, 54:657–673.
17. Austin PC, Tu JV, Ho JE, Levy D, Lee DS: Using methods from the data-mining and machine-learning literature for disease classification and prediction: a case study examining classification of heart failure subtypes. J Clin Epidemiol 2013, 66:398–407.
18. Tibshirani R: Regression shrinkage and selection via the Lasso. J R Stat Soc
Ser B 1996, 58:267–288.
19. Xu C-J, van der Schaaf A, Schilstra C, Langendijk JA, van’t Veld AA: Impact of statistical learning methods on the predictive power of multivariate normal tissue complication probability models. Int J Radiat Oncol Biol Phys 2012, 82:e677–e684.
20. Avalos M, Adroher ND, Lagarde E, Thiessard F, Grandvalet Y, Contrand B, Orriols L: Prescription-drug-related risk in driving: comparing
conventional and lasso shrinkage logistic regressions. Epidemiology 2012, 23:706–712.
21. Lapidus N, De Lamballerie X, Salez N, Setbon M, Ferrari P, Delabre RM, Gougeon M-L, Vely F, Leruez-Ville M, Andreoletti L, Cauchemez S, Boëlle P-Y, Vivier E, Abel L, Schwarzinger M, Legeas M, Le Cann P, Flahault A, Carrat F: Integrative study of pandemic A/H1N1 influenza infections: design and methods of the CoPanFlu-France cohort. BMC Public Health 2012, 12:417. 22. CDC protocol of realtime RTPCR for influenza A (H1N1). [http://www.who.
int/csr/resources/publications/swineflu/realtimeptpcr/en/]
23. Reijans M, Dingemans G, Klaassen CH, Meis JF, Keijdener J, Mulders B, Eadie K, van Leeuwen W, van Belkum A, Horrevorts AM, Simons G: RespiFinder: a new multiparameter test to differentially identify fifteen respiratory viruses. J Clin Microbiol 2008, 46:1232–1240.
Mansiaux and Carrat BMC Medical Research Methodology 2014, 14:99 Page 9 of 10
24. European Medicines Agency - Committee for proprietary medicinal products. Note for guidance on harmonization of requirements for influenza vaccines (CPMP/BWP/214/96). [http://www.ema.europa.eu/docs/ en_GB/document_library/Scientific_guideline/2009/09/WC500003945.pdf] 25. Lapidus N, de Lamballerie X, Salez N, Setbon M, Delabre RM, Ferrari P,
Moyen N, Gougeon M-L, Vely F, Leruez-Ville M, Andreoletti L, Cauchemez S, Boëlle P-Y, Vivier E, Abel L, Schwarzinger M, Legeas M, Le Cann P, Flahault A, Carrat F: Factors associated with post-seasonal serological titer and risk factors for infection with the pandemic A/H1N1 virus in the French general population. PLoS One 2013, 8:e60127.
26. Breiman L: Random Forests. Mach Learn 2001, 45:123–140. 27. Friedman JH: Greedy function approximation: a gradient boosting
machine. North 2001, 29:1189–1232.
28. Hastie T, Tibshirani R, Friedman J: The Elements of Statistical Learning: Data
Mining, Inference, and Prediction. 2nd edition. New York: Springer; 2009.
29. Friedman JH: Stochastic gradient boosting. Comput Stat Data Anal 2002, 38:367–378.
30. McCullagh P, Nelder JA: Generalized Linear Models. 2nd edition. London: Chapman and Hall/CRC; 1989.
31. glmnet: Lasso and elastic-net regularized generalized linear models. [http://cran.r-project.org/web/packages/glmnet/]
32. Friedman J, Hastie T, Tibshirani R: Regularization paths for generalized linear models via coordinate descent. J Stat Softw 2010, 33:1–22. 33. Hesterberg T, Moore DS, Monaghan S, Clipson A, Epstein R: Bootstrap
Methods and Permutation Tests. In Introd to Pract Stat. Volume 5. Edited by Moore D, McCabe G. New York: WH Freeman & Co; 2005.
34. Altmann A, Toloşi L, Sander O, Lengauer T: Permutation importance: a corrected feature importance measure. Bioinformatics 2010, 26:1340–1347. 35. Steuer R, Kurths J, Daub CO, Weise J, Selbig J: The mutual information:
detecting and evaluating dependencies between variables. Bioinformatics 2002, 18(Suppl 2):S231–S240.
36. Liaw A, Wiener M: Classification and regression by randomForest. R News 2002, 2/3:18–22.
37. Ridgeway G: Generalized boosted models: a guide to the gbm package.
Compute 2007, 1:1–12.
38. Touw WG, Bayjanov JR, Overmars L, Backus L, Boekhorst J, Wels M, van Hijum SAFT: Data mining in the Life Sciences with Random Forest: a walk in the park or lost in the jungle? Brief Bioinform 2013, 14:315–326. 39. Tolosi L, Lengauer T: Classification with correlated features: unreliability of
feature ranking and solutions. Bioinformatics 2011, 27:1986–1994. 40. Bender R, Lange S: Adjusting for multiple testing–when and how? J Clin
Epidemiol 2001, 54:343–349.
41. Bender R, Lange S: Multiple test procedures other than Bonferroni’s deserve wider use. BMJ 1999, 318:600–601.
42. Zou H, Hastie T: Regularization and variable selection via the elastic net.
J R Stat Soc - Ser B Stat Methodol 2005, 67:301–320 [Series B (Statistical
Methodology)].
43. Ng S, Fang VJ, Ip DKM, Chan K-H, Leung GM, Peiris JSM, Cowling BJ: Estimation of the association between antibody titers and protection against confirmed influenza virus infection in children. J Infect Dis 2013, 208:1320–1324.
44. Riley S, Kwok KO, Wu KM, Ning DY, Cowling BJ, Wu JT, Ho L-M, Tsang T, Lo S-V, Chu DKW, Ma ESK, Peiris JSM: Epidemiological characteristics of 2009 (H1N1) pandemic influenza based on paired sera from a longitudinal community cohort study. PLoS Med 2011, 8:e1000442.
45. Simmerman JM, Suntarattiwong P, Levy J, Jarman RG, Kaewchana S, Gibbons RV, Cowling BJ, Sanasuttipun W, Maloney SA, Uyeki TM, Kamimoto L, Chotipitayasunondh T: Findings from a household randomized controlled trial of hand washing and face masks to reduce influenza transmission in Bangkok, Thailand. Influenza Other Respi Viruses 2011, 5:256–267.
46. Kloepfer KM, Olenec JP, Lee WM, Liu G, Vrtis RF, Roberg KA, Evans MD, Gangnon RE, Lemanske RF, Gern JE: Increased H1N1 infection rate in children with asthma. Am J Respir Crit Care Med 2012, 185:1275–1279. 47. Chen MIC, Lee VJM, Barr I, Lin C, Goh R, Lee C, Singh B, Tan J, Lim WY, Cook
AR, Ang B, Chow A, Tan BH, Loh J, Shaw R, Chia KS, Lin RTP, Leo YS: Risk factors for pandemic (H1N1) 2009 virus seroconversion among hospital staff, Singapore. Emerg Infect Dis 2010, 16:1554–1561.
doi:10.1186/1471-2288-14-99
Cite this article as: Mansiaux and Carrat: Detection of independent associations in a large epidemiologic dataset: a comparison of random forests, boosted regression trees, conventional and penalized logistic regression for identifying independent factors associated with H1N1pdm influenza infections. BMC Medical Research Methodology 2014 14:99.
Submit your next manuscript to BioMed Central and take full advantage of:
• Convenient online submission
• Thorough peer review
• No space constraints or color figure charges
• Immediate publication on acceptance
• Inclusion in PubMed, CAS, Scopus and Google Scholar
• Research which is freely available for redistribution
Submit your manuscript at www.biomedcentral.com/submit
Mansiaux and Carrat BMC Medical Research Methodology 2014, 14:99 Page 10 of 10