HAL Id: hal-01731148
https://hal.archives-ouvertes.fr/hal-01731148
Submitted on 18 Dec 2018HAL is a multi-disciplinary open access
archive for the deposit and dissemination of sci-entific research documents, whether they are pub-lished or not. The documents may come from teaching and research institutions in France or abroad, or from public or private research centers.
L’archive ouverte pluridisciplinaire HAL, est destinée au dépôt et à la diffusion de documents scientifiques de niveau recherche, publiés ou non, émanant des établissements d’enseignement et de recherche français ou étrangers, des laboratoires publics ou privés.
Reconstruction of the 3D crack profile in wood based
structures by x-ray computed microtomography
Hamdi Seif Eddine, Rostand Moutou Pitti, Eric Badel, Joseph Gril
To cite this version:
Hamdi Seif Eddine, Rostand Moutou Pitti, Eric Badel, Joseph Gril. Reconstruction of the 3D crack profile in wood based structures by x-ray computed microtomography. 10 ème édition JET 2018, AF3M et SMSM., May 2018, Marrakech, Morocco. 6 p. �hal-01731148�
"
RECONSTRUCTION OF THE 3D CRACK PROFILE IN WOOD
BASED STRUCTURES BY X-RAY COMPUTED
MICROTOMOGRAPHY"
"Hamdi Seif Eddine"1,
"Rostand Moutou Pitti"1,2,
"Eric Badel"3,
"Joseph Gril"1
1 "Université Clermont Auvergne, CNRS, Institut Pascal, F-63000 Clermont-Ferrand, France, [email protected]" 2 "CNAREST, IRT, BP 14070, Libreville, Gabon, [email protected]" 3 "Université Clermont Auvergne, INRA, PIAF, F-63000 Clermont–Ferrand, France, [email protected]"
Résumé :
" L’estimation de la durée de vie des structures à base de bois est affectée par plusieurs sources d'incertitude liées aux variations climatiques et aux propriétés du matériau. La visualisation non destructive par microtomographie à rayons X (µCT), permet de caractériser les micros-endommagements qui surviennent lorsque les capacités de résistance locales du matériau sont dépassées. Le but de cette étude consiste à déterminer avec précision la position du front de la fissure et à mesurer des valeurs des taux de restitution d'énergie le long du front issu de la corrélation numérique d’images 3D. Un traitement statistique des cartes de micros-fissurations basé sur la densité spatiale d’endommagement est proposé dans le but de reconstruire le profil de fissuration du bois."
Xèmes Journées d’Etudes Techniques – JET’2018 Les 02 03 04 mai 2018
1. Introduction
In the last decades, wood-based structures have shown a regain of interest in civil engineering applications [1]. Wood materials are of lower density, renewable, widely available, with high specific strength properties [2]. However, wood fibres present a large variability of types and a complex structure, and behavior [3] (flexibility, mode of rupture, resistance to temperature), which makes the mastering of wood mechanical properties rather complicated. This behavior can be explained by the fact that the morphological characteristics of wood fibres depend on wood type, growth conditions and exploitation methods, resulting in different wood properties [4]. As a consequence, a large variability in the biochemical composition (amount of cellulose, lignin, hemicelluloses, etc.) and in the supramolecular structure (microfibril angle, cellulose crystallinity, size of cells) of wood fibres [8], strongly influences their overall properties (tensile strength, flexibility) and thus the properties of the wood-based structure [4, 5].
One of the key parameters controlling the morphological properties and the mechanical performances of wood-based materials is pore size and density distributions [6]. Understanding and predicting fibre damage mechanisms and crack tip advance, as well as shape deterioration under climatic changes are thus of great interest. During the life cycle, wood fibers are submitted to intensive thermal and mechanical stresses, leading to their rupture [13], two breakage mechanisms are then competing, decohesion (separation of individual fibers leading to a diameter decrease of the initial bundle) and fragmentation [6, 7].
X-ray computed microtomography (X-ray µCT), is a non-invasive technique used to image three-dimensional (3D) bulk objects. The X-ray µCT has appeared recently to be a very powerful tool allowing to characterize the microstructure of structural materials [8]. Damage monitoring, dimensional inspection and local characterization are possible in the interior of a material. 3D volumes with a voxel size of a few micrometers can be acquired and reconstructed in about 3 min on a lab-scale apparatus thanks to recent developments in microtomography. Measurement times also range from several hours to a few seconds, depending on the source, detector, material and specimen dimensions. Over the past five to ten years, X-ray µCT has become an increasingly accepted technique for qualitative and quantitative characterization of the 3D internal structures of materials [8].
The present study focuses on the non-destructive monitoring of wood crack growth. A 3D quantitative volume analysis is investigated using X-ray microtomography. The purpose of this study is to accurately determine the crack position and to estimate the energy release rate values along the front resulting from the numerical correlation of 3D images. A statistical analysis of micro-crack maps based on the spatial density of damage is proposed in order to reconstruct the cracking profile of the wood.
2. Materials and methods
1. MMCG wood specimen
This section presents the experimental setup considered in this study. The tests were carried out on a tropical specie known as Padouk. Figure.1 (a) shows the dimensions of wood specimen, with an overall size 210 x 140 x 25 mm3. The side of the specimen has inclinations with angles of 5° and 10° from the edge and the inferior hill, respectively, as shown in Figure. 1 (b). On both hills, four holes were perforated in order to fix the steel Arcans. The distance between the hole’s centers is 110 mm. The steel Arcans, were performed to allow for mixed-mode configurations. An initial crack of 20 mm is machined in the wood specimen in the direction of the fibers.
The MMCG specimen, shown in Figure 1 (b), is defined by the combination of a modified DCB specimen, and CTS specimen, on the one hand, and the observation of stability range of energy release rate versus crack length computed numerically with Mθ [8], on the other hand. The main objective of this specimen is to allow for the decrease in the energy release rate during the tests. The wood specimen presented in Figure. 3 (a), is fixed in a framed structure with Arc-formed handles containing symmetrical holes for load application according to various crack mode ratios β. The application of symmetric loads FI with angle β = 0° is equivalent to the opening mode, and the application of FII, with angle β = 90° corresponds to the shear mode as shown in Figure 1 (b).
The force F is separated into two forces Fx and Fy corresponding to the axis orientations (x, y) and the mixed-mode ratio in plane configuration. In this work, the mixed-mixed-mode fracture tests are obtained by applying the loads FI and FII with angles β = 45°.
Figure 1. MMCG Padouk wood sample (a), Experimental ARCAN setup (b).
2. X-ray computed microtomography
A Skyscan 1174 X-ray microtomograph was used for microtomographic acquisitions. The instrument was a high-resolution X-ray tomograph scanner with a closed X-ray micro-focus source for non-destructive three-dimensional (3D) microscopy. The maximum peak voltage of the Skyscan 1174 X-ray source was 50 kV with a maximum power of 40 W; it had a tungsten reflection target and a focal spot of 5 lm.
The detection system consists of a 14-bit cooled CCD camera coupled to a scintillator by lenses with 1:6 zoom ranges. Multiple 2D X-ray projections are stored while the sample is rotated. The internal structures are reconstructed as three-dimensional images, which are then used to analyze the morphological and topological parameters of the object [26]. The process is non-destructive and requires no special preparation of the specimen. The Skyscan 1174 microtomograph can acquire images with a minimum pixel size of 6 µm.
The investigated wood samples were placed between the X-ray source and the detector. To obtain high-resolution images using X-ray µCT, the magnification of the system was set in a way such that the container remained within the field of view of the detector for the full rotation cycle. Projection images were taken every 0.3° rotation step over 360°.
After reconstruction, a 3D volume was obtained in consecutive slices from the 2D cross-sectional images of the investigated sample, as shown in Figure 2(a-c). The entire acquisition process took approximately 120-160 min, with an exposure time of 3 500 ms per projection. Once the region of interest (ROI) of the Padouk sample was chosen (Figure 2 (a)), the fibre elements were then segmented and binary images were obtained (Figure 2 (b)). Three-dimensional rendering of the wood sample, as shown in Figure 2 (c), was used to obtain information regarding the crack orientation, wood porosity, density and size distribution. All the 3D volume-rendered images of the Padouk, carried out along this study, had a fixed size of 900 x 800 x 750 voxels for a specimen with a volume of 33 mm3 and a voxel size of 6.9 µm3.
Figure 2. Internal evolution of the crack growth (a), Extraction of porosities by image analysis (b), 3D volume of the cracked Padouk sample (c).
3. Results and discussion
1. Crack growth in mixed mode configuration
In this section, mechanical testing was conducted on two MMCG Padouk (P1 and P2) specimen. Figure .3 (a) present the applied force versus crack opening evolution. Figure .3 (b) illustrate the viscoelastic energy release rate evolution versus crack growth process for mixed mode configuration. The crack growth process can be interpreted as brittle or ductile. If for all cases, the crack growth or damage evolutions in the process zone induce a rigidity decrease, we can note an energy release rate increase during the crack growth advance. With these considerations, for mixed mode configurations, Figure .3 (b) shows a progressive growing of the process zone (phase of energy release rate increasing) and, in the other hand, Figure .3 (a) a stationary phase with a stabilization of its evolution. More precisely, we can observe, for the second Padouk (P2) specimen, a greater energy release rate then the first Padouk (P1) specimen, which correspond on brittle crack tip advance with an approximately peaks values around 120 J/m-2 for P1 and 157 J/m-2 for P22. Energy steady state evolution after these peaks illustrate crack growth stabilities for mixed mode.
Figure 3. Force versus crack opening evolution (a), Energy release rate evolution according to crack tip advance (b)
2. Reconstruction of the 3D crack growth path
In this section, the overall quality of the crack growth profile assessment is discussed to highlight the strengths and weaknesses of the X-ray CT analysis method. The use of weighted dimensions eliminates the effect of small-scale elements on average. This strategy may be relevant for assessment of the crack opening and direction estimation within the 3D volume rendering.
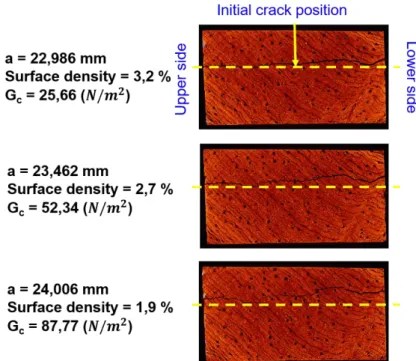
Although crack length comparison performed by the experimental method and 3D image analysis cannot be directly related to the specific features of the applied methods with regard to the analyzed crack length distribution, it provides some useful information. In fact, the mean length of the crack evolution is a good indicator of the damage level on MMCG wood samples, which is suitable for comparing the values obtained using different methods. Comparison of individual crack-based measurements is possible by relying on segmented images correlated by the surface density of the analyzed samples, as shown in Figure 4.
The volume-weighted crack length distribution of the analyzed tropical wood samples is calculated from 2D cross images (see Fig. 4). The results showed that crack progress continues inside the MMCG wood samples most likely after this progress ends in the surface of the specimens. In addition, we notice in first hand, that the surface density distribution inside a specific Padouk sample is not homogenous, wich tends to accelerate the crack growth speed. In the other hand, X-ray CT showed that Padouk wood presents a higth surface density. This can be explained by, the fact that Padouk wood fibers and particles diameters, estimated using the X-ray CT method (Figure 2b), showed a dispersion smaller than 60 µm and larger than 800 µm. Indeed, the conditions of fiber repartition inside the wood material affects the crack growth speed and direction as depicted in Figure. 4. The observation using the 3D scanning method showed that the crack tip progress tends to move towards larger fibers porosity all along crack path.
Figure 4. Crack growth path according to surface density of Padouk sample: 2D Cross sectional images extracted from 3D volume of Padouk P1 sample.
4. Conclusion
This study uses the X-ray CT, as a recently developed non-destructive technique, and experimental mixed mode analysis for crack growth monitoring in a tropical wood specie. Surface tracking of crack growth in mechanical and civil engineering structures does not entirely describe the damage behavior inside the structure. This study confirmed that damage progress estimation of heterogeneous material such as wood is difficult. The results revealed that wood porosity and fiber density distribution only available from 3D images may affect the crack tip orientation and the fracture toughness. Volume-weighted analysis based on the X-ray CT can provide a large range of different parameters that may be useful for crack advance monitoring, and then need to be interpreted. Additionally, it appears necessary to use an adaptive and complimentary analysis strategy to take advantage of the strengths of both X-ray micro tomography and other 2D scanning methods.
5. Bibliographie
[1] Ranjith S, Setunge S. Deterioration Prediction of Timber Bridge Elements Using the Markov Chain. Journal of Performance of Constructed Facilities 2011;27:319–25.
[2] Yu, Y.; Li, J.; Yan, N.; Dackermann, U.; Samali, B. Load capacity prediction of in-service timber utility poles considering wind load. J. Civil Struct. Hlth. Monit. 2016, 6, 385-394.
[3] Nassr, A.A.; El-Dakhakhni, W.W.; Ahmed, W.H. Biodegradation and debonding detection of composite-wrapped wood structures. J. Reinf. Plast. Comp. 2010, 29, 2296-2305.
[4] Riggio, M.; Macchioni, N.; Riminesi, C. Structural health assessment of historical timber structures combining non-destructive techniques: The roof of Giotto's bell tower in Florence. Struct. Control Hlth. 2017, 24, e1935.
[5] Riggio, M.; Sandak, J.; Franke, S. Application of imaging techniques for detection of defects, damage and decay in timber structures on-site. Constr. Build. Mater. 2015, 1241-1252.
[6] Faggiano, B.; Marzo, A. A method for the determination of the timber density through the statistical assessment of ND transverse measurements aimed at in situ mechanical identification of existing timber structures. Constr. Build. Mater. 2015, 101, 1235-1240.
[7] Lanata, F. Monitoring the long-term behaviour of timber structures. J. Civil Struct. Hlth. Monit. 2015, 5, 167-182.
[8] Mayo S., Evans R., Fiona C., Lagerstrom R. X-ray phase-contrast micro-tomography and image analysis of wood microstructure. Journal of Physics, 2009, 186.