HAL Id: hal-01021034
https://hal.inria.fr/hal-01021034
Submitted on 9 Jul 2014HAL is a multi-disciplinary open access
archive for the deposit and dissemination of sci-entific research documents, whether they are pub-lished or not. The documents may come from teaching and research institutions in France or abroad, or from public or private research centers.
L’archive ouverte pluridisciplinaire HAL, est destinée au dépôt et à la diffusion de documents scientifiques de niveau recherche, publiés ou non, émanant des établissements d’enseignement et de recherche français ou étrangers, des laboratoires publics ou privés.
Monitoring of a Large Cracked Concrete Sample with
Non-Linear Mixing of Ultrasonic Coda Waves
Odile Abraham, Yuxiang Zhang, Xavier Chapeleau, Olivier Durand, Vincent
Tournat
To cite this version:
Odile Abraham, Yuxiang Zhang, Xavier Chapeleau, Olivier Durand, Vincent Tournat. Monitoring of a Large Cracked Concrete Sample with Non-Linear Mixing of Ultrasonic Coda Waves. EWSHM - 7th European Workshop on Structural Health Monitoring, IFFSTTAR, Inria, Université de Nantes, Jul 2014, Nantes, France. �hal-01021034�
M
ONITORING
OF
A
LARGE
CRACKED
CONCRETE
SAMPLE
WITH
NON
-LINEAR
MIXING
OF
ULTRASONIC
CODA
WAVES
Odile Abraham1, Yuxiang Zhang1,2,3, Xavier Chapeleau1, Olivier Durand1, Vincent Tournat2
1 LUNAM Université, IFSTTAR, CS4, 44344 Bouguenais Cedex, France
2 LUNAM Université, LAUM, CNRS UMR 6613, Université du Maine, Av. O. Messiaen, 72085 Le
Mans Cedex 9, France
3 ISTerre, Université J. Fourier, 1381 rue de la Piscine, 38400 Grenoble, France
odile.abraham@ifsttar.fr
ABSTRACT
A high precision can be achieved with ultrasonic coda waves to monitor the mechanical properties of concrete material (~10-5 in relative). This high sensitivity can
be used to detect damage initiation and to closely follow concrete mechanical properties evolution with time. This advantage is counterbalance by the influence of environmental conditions making reproducibility of any experiment in concrete a challenging issue especially when in situ measurements are performed. Indeed thermal and water gradients present in the thickness of the structures (several decimetres) cannot be controlled and must be compensated. In this paper a protocol to remove environmental bias is proposed. Furthermore, to follow the apparition of a tensile crack in a metric size structure, non-linear mixing of coda wave via frequency-swept pump waves is tested. It is shown that, when the crack is closed (by pre-stressing cables), it is still possible to detect its presence. The non-linearity of the cracked zone remains at a high level, comparable to the case when the crack was open.
KEYWORDS : Ultrasonic, Coda Wave Interferometry, Non linear acoustics, crack,
concrete
INTRODUCTION
The ultrasonic non destructive testing of concrete structures is often performed with sources having a frequency content well below 150 kHz. This is due to the fact that wavelengths are chosen larger than the aggregate sizes, which are currently as large as 2 cm, in order to avoid rapid attenuation of signal amplitude. In the contrary monitoring methods using coda waves aim to take advantage of the heterogeneity of the material to reach a high precision . The general idea is to take advantage of the long travel paths of the incoherent waves resulting from multiple reflections at the aggregates' interfaces. A small change in the propagation medium is more easily detectable by travel time comparison if the travel path is long [Snieder, 2002, 2006]. Coda Wave Interferometry (CWI) can monitor changes in propagation velocities with a high precision (10-3 % in relative). Several
promising experiments have been carried out in the laboratory [Larose & Hall, 2009, Payan et al., 2009, Schurr et al., 2011, Zhang et al., 2012], but few in situ [Larose et al., 2006, Zhang et al., 2011, Stahler et al., 2011]. This is due to the fact that many biases can impinge on the reproducibility of the measurements such as ambient temperature [Zhang et al., 2011, Zhang et al., 2013] which is common to all application fields [Mazzeranghi & Vangi, 1999, Lu & Micheals, 2006]. Compensation of biases coming from fluctuations of the ambient temperature can be achieved in the laboratory with a reference sample that duplicates the sample under test [Zhang et al., 2013]. Unfortunately it is often not possible to duplicate the structure under study especially for large in
situ concrete structures. Here, we use reference signals, recorded in an area of the structure free of
load, to compensate the environmental bias.
In order to increase the sensitivity of the CWI to the presence of cracks, and to design a new non destructive methods to detect the presence of cracks, non-linear mixing of the coda wave via frequency-swept pump waves (NLMCODA) measurements were carried out as depicted in Zhang (2013) in glass. In Donskoy, 2001, Zaitsev, 2009, Van Den Abeele, 2001 it is shown that probing a medium with a low-amplitude ultrasonic wave (called the probe wave), at the same time that a large-amplitude wave at lower frequency is exciting the medium, leads to modulation of the probe wave in the presence of faults such as cracks. To apply non-linear acoustics to detect cracks in concrete several challenges have to be tackled among which: 1/ the non linearity when the material is damaged shall be distinguishable from that of the sound material 2/ the detection of a crack should be possible even when closed by pre-stressing.
1 PRESENTATIONOFTHECONCRETESTRUCTUREANDLOADING
A concrete specimen (Fig.1) has been designed in order to create tensile cracks in a pre-stressed section while, approximately one meter away, a zone remains free of stress (surface C). Thermocouples, fibre optics and strain gauges are located in the pre-stressed section to compare and discuss results. The specimen has a complex structure; three surfaces are coloured for explanation in Figure 1. The surface A (50 cm x 160 cm) has a 3 cm thick slot in view of creating a crack in the structure at mid-height. The crack is initiated by tightening a screw that crosses the specimen at its top, perpendicularly to surface B. The top of the slot is put into compression and a crack is created in the zone where traction is the highest (initiation of the crack on face B at the height of the slot bottom end).
The screw is tighten step by step to reach 100 % of the roughly estimated traction strength (3 Mpa): 50 %, 85 %, 90 %, 95 %, 100 %, 110 %, 130 %. The concrete rupture occurred at 130 % of the estimated traction strength. The specimen was monitored by CWI during the whole experiment that lasted 3 days. The increase of the load from 0 % to 130 % was done in 8 hours. After the largest load corresponding to the apparition of a crack (loading step 130 %), the screw was loosen to close the crack thanks to the pre-stressing cables.
© Vigouroux Pays de la Loire
Figure 1 : concrete specimen dimensions Figure 2 : coda wave set-up
EWSHM 2014 - Nantes, France
2 CODAWAVEMETHODOLOGYUSED
2.1 Coda wave interferometry
The principle of CWI is to compare two signals (ui(t) and up(t)) recorded before and after a
perturbation of the propagation medium to determine the variation of the propagation velocity (Snieder, 2002, 2006). In this paper the stretching method is used (Hadziioannou, 2009). The reference signal ui(t) is stretched/compressed by a factor αi and compared to the perturbed signal
up(t) by computing the correlation coefficient CC(αi) :
(1)
Among all the value of αi, the one that maximizes CC is noted α and is equal to the relative
modification of the velocity v: α = ∆v/v. The associated decorrelation coefficient Kd = 1-CC(α) (from 0 % to 100 %) gives an indication about the decorrelation between the two signals ui(t) and up(t).
2.2 Non-linear mixing via frequency-swept pump waves
At each loading steps (0 %, 50 %, 85 %, 90 %, 95 %, 100 %, 110 %, 130 % and 0 % of estimated traction strength) NLMCODA measurements are performed. It consists in measuring by Coda Wave Interferometry the variation of α as a function of pump wave amplitude. The pump wave excitation voltage, that governs the pump wave amplitude, varies from 0 mV to 1300 mV back to 0 mV in twelve voltage steps (0 mV 100 mV 400 mV 700 mV 1000 mV 1300 mV 1300 mV 1300 mV 0 mV 0 mV 0 mV 0 mV 0 mV).
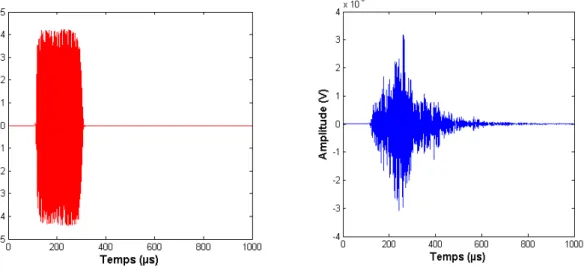
Figure 3 : probe signal source example: a chirp of 200 µs with frequency between 200 kHz and
800 kHz.
Figure 4 : Modulus of the Fourier transform of a signal recorded near the vibrating
loaw-frequency vibrator.
2.3 Experimental set-up
The probe wave generated is a chirp from 200 kHz to 800 kHz with a duration of 200 µs (Fig.3). Two pairs of CWI source and receiver are located in the crack zone area (surface B) and in a reference zone (fare from loading) in surface C top right corner (Figure 1).
The pump wave is another chirp from 20Hz to 2kHz with a duration of 1 s generated by a vibration equipment located on surface B (Fig.2). More than 15 structure resonances frequencies are excited.
Both chirp signals are asynchronous. Signals of both pairs of coda wave receivers are recorded simultaneously. Figure 4 shows one probe signal.
Fiber optic measurements where carried out before and after NLCODA measurements to control the apparition of the crack.
3 RESULTS
3.1 Bias compensation
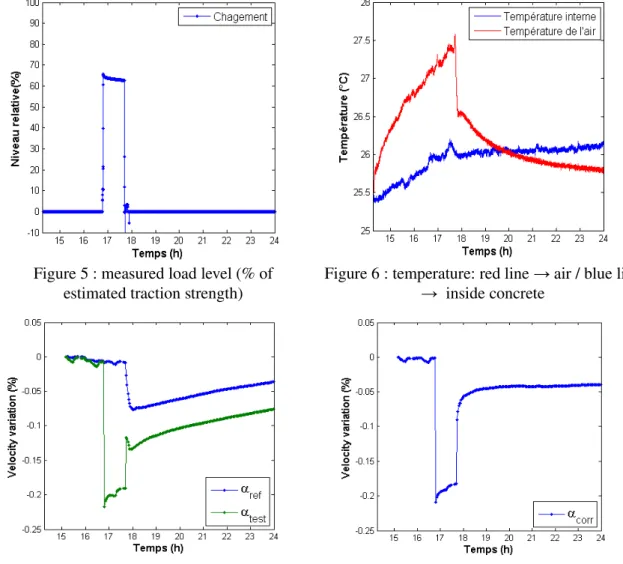
To illustrate the methodology to compensate temperature effect on coda wave signal, we focus on one loading step (fig.5) during which the air temperature varies as depicted in red in figure 6 and in blue inside the concrete. The variation of α as a function of time during one loading step is given in figure 7 for both coda receivers (respectively αref in the reference zone and αtest in the load zone). In
the reference zone, the influence of temperature is clearly visible on αref, the same trend is observed
in the load zone αtest somehow masking the load effect.
Figure 5 : measured load level (% of estimated traction strength)
Figure 6 : temperature: red line → air / blue line inside concrete
→
Figure 8 : ατest in green and αref in blue Figure 9 : αcorr = αtest - αref. The temperature effect
is removed.
To remove the thermal bias on the CWI measurements, the difference between the two signals is carried out to give αcorr = αtest - αref. The variation of velocity during loading is more easily
explainable. The acousto-elastic effect is clearly visible (diminution of velocity with traction), the
EWSHM 2014 - Nantes, France
permanent decrease of velocity after traction can be explained by the kaiser effect and finally the stabilisation to the new velocity that takes several minutes can be explained by slow dynamics [TenCate 2000, Larose 2009]. In the following the correction of temperature will be applied to all the coda wave signals.
3.2 Crack detection
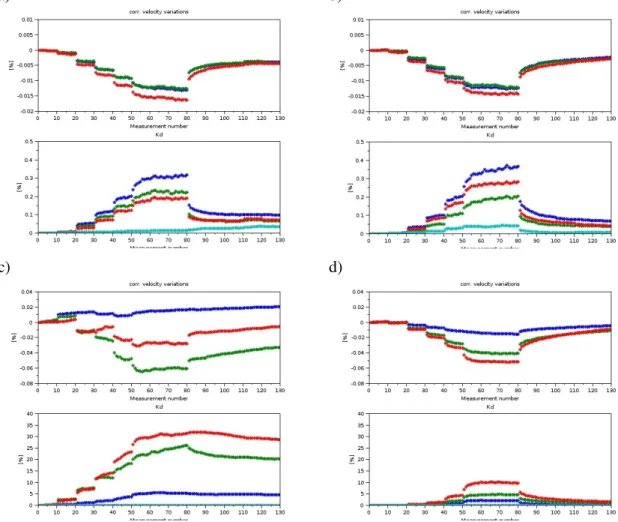
Figure 7 presents preliminary results obtained with NLMCODA. αcorr and Kd are presented as a
function of pump amplitude levels (10 measurements per level are performed leading to 130 values) for 4 load levels: 0 %, 95 %, 130 %, 0 %. After the load level 130 %, the structure is cracked. Before loading (first load level at 0 %) we can see that concrete shows a non-linear behaviour (Fig.7a): the velocity is sensitive to the level of the pump. Before cracking of the structure (for instance at load level 95 %, fig. 7b) the non-linear behaviour remains very similar. At the load level 130 % (Fig. 7c) a crack is present (the crack is open because the load is kept constant); the influence of the pump wave amplitude on αcorr and Kd is clearly increased from previous state, especially for
Kd. The fact that αcorr and Kd do not come back to zero when the pump amplitude is shut down is
due to the fact that the temperature effect has been compensated but not the relaxation of the concrete.
a) b)
c) d)
Figure 7: α and Kd as a function of pump amplitude for 4 load levels (a- 0 %, b- 95 %, c- 130 %, d- 0 %)
Very interestingly, once the load level is cancelled (equal to 0 %) the sensitivity of αcorr and Kd
stays of the same order of grandeur. This means that NLMCODA can detect a closed crack under compression.
CONCLUSION
In this first experiment carried out on a metric size concrete specimen we have shown that we can compensate the temperature bias by using a reference signal recorded in a zone that undergoes only environmental perturbations. This is very promising result for the use of coda wave interferometry on in situ concrete structures. In addition by using non-linear mixing of the coda wave via frequency-swept pump waves we have shown that a cracked zone has a signature that is clearly different from sound concrete (even if the material is non-linear when sound) and that this detection is possible when the crack is closed by a pre-stressing.
ACKNOWLEDGEMENT
This research has been supported by the ECND-PdL (Loire Valley cluster for Non-Destructive Evaluation and Control), which is financed by the Loire Valley Regional government (France). Our thanks extend to Ivan Gueguen, Alain Grosseau and Jean-philippe Gourdon from Ifsttar (France) and to Jean-Paul Balayssac from LMDC (France) for their assistances during the tests and its preparation.
REFERENCES
[1] C Maierhofer, H-W Reinhardt, G Dobmann, Non-destructive evaluation of reinforced concrete
structures, Vol.2, Woodhead Publising Limited, CRC Press N10267, ISBN 978-1-84569-950-5, 624p., 2010,
[2] E. Larose and S. Hall, “Monitoring stress related velocity variation in concrete with a 2 x 10 5 relative resolution using diffuse ultrasound,” The Journal of the Acoustical Society of− America, vol. 125, no. 4, pp. 1853–1856, 2009.
[3] E. Larose, J. de Rosny, L. Margerin, D. Anache, P. Gouedard, M. Campillo, and B. van Tiggelen, “Observation of multiple scattering of khz vibrations in a concrete structure and application to monitoring weak changes,” Physical Review E, vol. 73, p. 016609, 2006.
[4] Y. Lu and J. E. Michaels, “A methodology for structural health monitoring with diffuse ultrasonic waves in the presence of temperature variations,” Ultrasonics, vol. 43, no. 9, pp. 717 – 731, 2005.
[5] A. Mazzeranghi and D. Vangi, “Methodology for minimizing effects of temperature in monitoring with the acousto-ultrasonic technique,” Experimental Mechanics, vol. 39, pp. 86– 91, 1999.
[6] C. Payan, V. Garnier, J. Moysan, P.A. Johnson, Determination of third order elastic constants in a complex solid applying coda wave interferometry, Appl., Phys. Lett. 94 (2009)
[7] R. Snieder. “Coda wave interferometry and the equilibration of energy in elastic media”. Physical review, 66(4) : 046615, 2002
[8] R. Snieder. “The theory of coda wave interferometry”. Pure and Applied Geophysics,163(2-3) :455–473, 2006.
[9] D.P. Schurr, J.-Y. Kim, K.G. Sabra, L.J. Jacobs, “Damage detection in concrete using coda
wave interferometry”, NDT&E International, 44(2011): 728–735
[10] S. C. Stähler, C. Sens-Schönfelder, E. Niederleithinger, “Monitoring stress changes in a
concrete bridge with coda wave interferometry”, The Journal of the Acoustical Society of America 04/2011; 129(4): 1945-52.
[11] Y. Zhang, O. Abraham, E. Larose, T. Planes, A. Le Duff, B. Lascoup, V. Tournat, R. El Guerjouma, L.-M. Cottineau, and O. Durand, “Following stress level modification of real size
EWSHM 2014 - Nantes, France
concrete structure with coda wave interferometry (cwi),” AIP Conference Proceedings, vol. 1335, no. 1, pp. 1291–1298, 2011.
[12] Y. Zhang, O. Abraham, V. Tournat, A. Le Duff, B. Lascoup, A. Loukili, F. Grondin, and O. Durand. Validation of a thermal bias control technique for coda wave interferometry (cwi). Ultrasonics, 53(3): 658 – 664, 2013.
[13] Y. Zhang, O. Abraham, F. Grondin, A. Loukili, V. Tournat, A. Le Duff, B. Lascoup, O. Durand Study of stress-induced velocity variation in concrete under direct tensile force and monitoring of the damage level by using thermally-compensated Coda Wave Interferometry, Ultrasonics 52 (2012): 1038–1045
[14]Y. Zhang, V. Tournat, O. Abraham, O. Durand, S. Letourneur, A. Le Duff, B. Lascoup, “Monlinear mixing of ultrasonic coda waves with lower frequency-swept pump waves for a global detection of defects in multiples scattering media, Journal of Applied Physics 113, 064905 , 2013.
[15]D. Donskoy, A. Sutin, A. Ekimov, Nonlinear acoustic interaction on contact interfaces and its use for nondestructive testing, NDT & E International 34 (4) (2001) 231 – 238.
[16]K. E.-A. Van Den Abeele, A. Sutin, J. Carmeliet, P. A. Johnson, Micro-damage diagnostics using nonlinear elastic wave spectroscopy (news), NDT & E International 34 (4) (2001) 239 – 248.
[17]V. Zaitsev, L. Matveev, A. Matveyev, On the ultimate sensitivity of nonlinear-modulation method of crack detection, NDT & E International 42 (7) (2009) 622 – 629.
[18]C. Hadziioannou, E. Larose, O. Coutant, P. Roux, M. Campillo, Stability of monitoring weak changes in multiply scattering media with ambient noise correlation: Laboratory experiments, The Journal of the Acoustical Society of America 125 (2009) 3688–3695.
[19]J. A. TenCate, E. Smith, and R. A. Guyer, “Universal slow dynamics in granular solids,” Physical Review Letters, vol. 85, pp. 1020–1023, Jul 2000.