HAL Id: hal-00296444
https://hal.archives-ouvertes.fr/hal-00296444
Submitted on 13 Feb 2008
HAL is a multi-disciplinary open access
archive for the deposit and dissemination of
sci-entific research documents, whether they are
pub-lished or not. The documents may come from
teaching and research institutions in France or
abroad, or from public or private research centers.
L’archive ouverte pluridisciplinaire HAL, est
destinée au dépôt et à la diffusion de documents
scientifiques de niveau recherche, publiés ou non,
émanant des établissements d’enseignement et de
recherche français ou étrangers, des laboratoires
publics ou privés.
The wintertime two-day wave in the polar stratosphere,
mesosphere and lower thermosphere
D. J. Sandford, M. J. Schwartz, N. J. Mitchell
To cite this version:
D. J. Sandford, M. J. Schwartz, N. J. Mitchell. The wintertime two-day wave in the polar stratosphere,
mesosphere and lower thermosphere. Atmospheric Chemistry and Physics, European Geosciences
Union, 2008, 8 (3), pp.749-755. �hal-00296444�
www.atmos-chem-phys.net/8/749/2008/
© Author(s) 2008. This work is distributed under the Creative Commons Attribution 3.0 License.
Chemistry
and Physics
The wintertime two-day wave in the polar stratosphere, mesosphere
and lower thermosphere
D. J. Sandford1, M. J. Schwartz2, and N. J. Mitchell1
1Centre for Space, Atmospheric & Oceanic Science, Department of Electronic and Electrical Engineering, University of Bath,
Bath, BA2 7AY, UK
2Microwave Atmospheric Science Group, Jet Propulsion Laboratory, 4800 Oak Grove Dr, Pasadena, CA 91109-8099, USA
Received: 6 September 2007 – Published in Atmos. Chem. Phys. Discuss.: 16 October 2007 Revised: 3 January 2008 – Accepted: 16 January 2008 – Published: 13 February 2008
Abstract. Recent observations of the polar mesosphere have
revealed that waves with periods near two days reach sig-nificant amplitudes in both summer and winter. This is in striking contrast to mid-latitude observations where two-day waves maximise in summer only. Here, we use data from a meteor radar at Esrange (68◦N, 21◦E) in the Arctic and data from the MLS instrument aboard the EOS Aura satellite to investigate the wintertime polar two-day wave in the strato-sphere, mesosphere and lower thermosphere. The radar data reveal that mesospheric two-day wave activity measured by horizontal-wind variance has a semi-annual cycle with max-ima in winter and summer and equinoctial minmax-ima. The MLS data reveal that the summertime wave in the mesosphere is dominated by a westward-travelling zonal wavenumber three wave with significant westward wavenumber four present. It reaches largest amplitudes at mid-latitudes in the southern hemisphere. In the winter polar mesosphere, however, the wave appears to be an eastward-travelling zonal wavenum-ber two, which is not seen during the summer. At the latitude of Esrange, the eastward-two wave reaches maxi-mum amplitudes near the stratopause and appears related to similar waves previously observed in the polar strato-sphere. We conclude that the wintertime polar two-day wave is the mesospheric manifestation of an eastward-propagating, zonal-wavenumber-two wave originating in the stratosphere, maximising at the stratopause and likely to be generated by instabilities in the polar night jet.
Correspondence to: D. J. Sandford
(d.j.sandford@bath.ac.uk)
1 Introduction
The quasi-two-day wave (Q2DW) is one of the most con-spicuous features of the mesosphere and lower thermosphere (MLT) region. At middle and low latitudes the Q2DW reaches maximum amplitudes of several tens of ms−1 in late summer, where it can be the largest-amplitude feature present, but it is largely absent at other times (e.g., Muller et al., 1978). The Q2DW is know to interact with and modulate the tides of the mesosphere (e.g. Teitelbaum and Vial, 1991 and Mitchell et al., 1996) and may also impact the photo-chemistry of this region (e.g. Kulikov, 2007).
The summertime Q2DW is believed to be primarily a westward propagating, zonal wavenumber 3 (i.e. three cy-cles of the wave around the latitude circle, hereafter W3 etc.) wave. This has been identified with the (3, 0) Rossby nor-mal mode (Salby, 1981) and baroclinic instabilities, if there is sufficient eastward shear above the summertime westward jets (Plumb, 1983). Significant W4 components and some-what smaller W2 components have also been reported in both observations and in modelling studies (e.g., Meek et al., 1996; Norton and Thuburn, 1996; Pancheva et al., 2004).
In contrast to these mid-latitude observations, recent stud-ies have revealed significant wave activity with a period near two days in the winter Arctic MLT region (Nozawa et al., 2003a, b; Manson et al., 2004). These studies used ground-based meteor and MF radars to reveal significant wave am-plitudes in winter, but were unable to determine the zonal wavenumber and direction of propagation of the wintertime polar two-day wave because they had insufficient longitudi-nal coverage in the radars used.
In the polar winter stratosphere, a two-day wave has been observed and identified as an eastward propagating, zonal wavenumber 2 (E2) planetary wave. This wave is believed to be one of a series of waves generated by barotropic insta-bilities in the polar night jet (e.g., Venne and Stanford, 1982;
750 D. J. Sandford et al.: The wintertime two-day wave
!
(a)
(b)
(c)
Fig. 1. Band-passed horizontal winds from the Esrange meteor
radar from heights of 89 to 92 km. The data have been band passed between periods of 1.5 and 2.6 days. (a) Zonal component for 10 days in December 2004 showing five cycles of a wave in 10 days.
(b) and (c) Monthly variances of the band-passed horizontal winds
for (b) zonal winds and (c) meridional winds. The dashed vertical lines indicate the boundary between each year.
Hartmann, 1983; Prata, 1984; Lait and Stanford, 1988 and Manney et al., 1988). Nozawa et al. (2003b) suggested that the polar MLT-region wintertime two-day wave may be an E2 wave connected to these stratospheric oscillations – but this could not confirmed in the absence of longitudinal mea-surements.
Palo et al. (2007) reported an E2 wave in the mid-latitude, summer, southern-hemisphere MLT region occurring simul-taneously with a W3 wave. They attributed the E2 wave to a non-linear coupling between the W3 Q2DW and the migrat-ing diurnal tide.
Here, we investigate the nature of the wintertime polar two-day wave observed in the MLT region by an Arctic meteor radar and in data from the MLS (Microwave Limb Sounding) instrument aboard the NASA Aura satellite. In particular, the longitudinal coverage provided by the satel-lite observations allows us to determine zonal wavenum-bers and the height coverage allows us to reveal the rela-tion of this MLT-region wave to two-day waves in the strato-sphere. Finally, we address the mechanisms whereby this wave might be excited (e.g., non-linear coupling or excita-tion by barotropic instability).
2 Data analysis
Data from two independent sources are used in this study. The first source is measurements of horizontal winds at mesopause heights recorded by a meteor radar at Esrange (68◦N 21◦E). This radar measures the winds with typical height and time resolutions of about 3 km and 1 h, respec-tively (see Mitchell et al., 2002 for details of the Esrange meteor radar and Hocking et al., 2001 for a description of the technique). The Esrange radar has operated continually from October 1999. Here, data from the interval October 1999 to November 2007 are considered and were analysed to yield hourly estimates of zonal and meridional winds in six height gates between 80 and 100 km.
The second source of data is the MLS instrument aboard the NASA Aura satellite – part of the A-train constellation of satellites (Waters et al., 2006). Data from Aura over the interval August 2004 to November 2007 are considered here. MLS yields geopotential height as one of its level-2 data products covering the height range of ∼10–97 km. The Aura satellite is in a Sun-synchronous orbit and so passes through only two local times at any given latitude. At the 68◦N
lat-itude of Esrange these local times are about 3.1 and 12.3 h. The highest latitude accessible to the satellite is just over 80◦.
Here, we have applied the data analysis method of Wu et al. (1995a), to the geopotential height data. In this method, the geopotential height data is divided into latitude bands of 10 degrees width (e.g. 60◦–70◦N). A data set is then
assem-bled consisting of geopotential height values for successive passes of the satellite through each band. Because of the path of the satellite, the universal times and longitudes of the crossings through any given latitude band are not indepen-dent and, in fact, form a regular matrix. Sinusoidal functions of zonal wavenumber 4 to −4 and periods of 42 to 56 h were then least-squares fitted to this matrix. This yields geopoten-tial amplitudes and phases for waves with any combination of these wavenumbers and periods within a particular lati-tude band. Note that positive wavenumbers correspond to westward propagating waves and negative to eastward prop-agating waves. Note that because there are only two local times within any latitude band, this analysis is unable to re-solve tides without complications caused by aliasing.
The radar data were analysed to produce a climatology of waves with period near two days. For a particular height gate, the horizontal winds were band-pass filtered to reveal oscilla-tions with periods between 1.5 and 2.6 days using an ellipti-cal filter. This filter type offers a steeper “roll-off” character-istic than Butterworth filters; however there is more ripple on the elliptical filter than a similar Butterworth filter, this has however been kept to a minimum. The transfer points are at 1.49 and 2.61 days for the 99% and 1.41 and 2.76 days for the 1%. We assume that all of the variance in this band is as-sociated with the Q2DW. For each month of data a variance value was calculated for each height gate. These variance
! " # $ % & '( ) * + , -&#$ $
-Fig. 2. A composite-year analysis of the data of -Fig. 1b and c. The
solid line indicates results for the zonal winds and the dashed line meridional winds. Error bars indicate the standard deviation and are marked only on the zonal component.
values then provide a simple proxy of wave activity within this period band.
3 Results
As an example of the wintertime 2-day wave, Fig. 1a presents band-passed zonal winds over Esrange recorded at heights of 89–92 km during 10 days in December 2004. In the figure it can be seen that there are approximately five complete cycles of the wave occurring in a 10 day segment; therefore during this time the wave has a period of about 48 h.
Figure 1b and c presents monthly variance values for zonal and meridional winds, respectively, measured over Esrange from a height gate spanning 89 to 92 km from October 1999 to November 2007. The figure clearly shows that variance tends to maximises in winter and summer and has equinoctial minima, i.e. there is a semi-annual cycle. There is also con-siderable inter-annual variability. For instance, the summer-time maximum varies from values as small as about 30 m2s2 in 2003 (zonal component) and 2004 to values as large as about 100 m2s2in 2002 (meridional component).
This semi-annual behaviour is in marked contrast to that observed at middle and low latitudes where wave activity with a period near two days maximises in the summer and is significantly weaker in the winter.
To reveal a representative seasonal cycle, a composite-year analysis was carried out using the data of Fig. 1. Fig-ure 2 presents this composite year analysis for the zonal and meridional components. The semi-annual cycle of variance is very apparent. In the case of the winter maximum, the zonal and meridional variances are about the same size and
Fig. 3. Geopotential height amplitudes as a function of time and
latitude for Aura MLS data at a height of ∼90 km, for oscillations with periods between 42 and 56 h and different zonal wavenumbers.
(a) westward 4, (b) westward 3, (c) westward 2 and (d) eastward 2.
Amplitudes below 40 m are not plotted. The vertical dashed black lines indicate the boundaries between years.
are ∼40 m2s2. However, in the case of the summer maxi-mum the meridional variance is significantly larger than the zonal, some ∼68 m2s2c.f. some ∼35 m2s2. In both zonal and meridional cases the equinoctial minimum have values of about ∼15 m2s2.
These results suggest that there is considerable wave activ-ity with a period near two days present in the Arctic winter and summer. This reinforces the conclusions of Nozawa et al. (2003a, b) and Manson et al. (2004).
The MLS data provide an opportunity to investigate the zonal wavenumber(s) and global context of these wave fea-tures evident in the summer and winter Arctic mesosphere. For each 10 degree latitude band from 80◦N to 80◦S, the av-erage geopotential height amplitude was calculated over the period range 42–56 h. These averages were calculated using a time window of 15 days incremented through the data set in steps of 5 days. The calculation was performed for zonal wavenumbers W4 to E4.
The result of this analysis is an estimate of wave amplitude against latitude and time for each of the wavenumbers W4 to E4 over the interval August 2004 to November 2007. Fig-ure 3a–d presents these results for zonal wavenumbers W4, W3, W2 and E2 at a height of about 90 km (selected to match the radar observations). Results for wavenumbers W1, 0, E1, E3 and E4 are not shown because these yielded negligible amplitudes (generally less than 40 m). In each Figure, the contours are plotted only for amplitudes larger than 40 m.
We will now consider each figure in turn. The W4 results of Fig. 3a reveal amplitudes that maximise in each hemi-sphere at mid-latitudes during the summer. Wave amplitudes are strongest during the months of June to August in the
752 D. J. Sandford et al.: The wintertime two-day wave
Fig. 4. (a) Horizontal wind variances from the Esrange meteor radar
for a height of 89–92 km as per Fig. 1, the data are and have been band passed between periods of 1.5 and 2.6 days. (b) Geopotential height amplitudes at a height of ∼91 km, between 60◦and 70◦N, over the period range 42 to 56 h for W3 and E2. (c) as (b) but for W4 and W2.
northern hemisphere and December to February in the south-ern hemisphere. Amplitudes reached values of ∼140 m in each summer, except in summer 2006 in the northern hemi-sphere which reached >200 m. Note that there are no sig-nificant amplitudes (>40 m) in winter in either hemisphere. Further, note that the amplitudes are small at latitudes pole-ward of ±60◦in each hemisphere.
The W3 results of Fig. 3b reveal amplitudes which also maximise in each hemisphere at mid-latitudes during the summer. In this case, however, the summertime southern-hemisphere amplitudes are significantly larger than in the northern hemisphere. Wave amplitudes are strongest during the months of June to August in the northern hemisphere and January and February in the southern hemisphere. In the northern hemisphere, amplitudes reach values of ∼140 m. However, in the southern hemisphere, peak amplitudes ex-ceed 250 m in each of the three summers observed. Note again that there are no amplitudes >40 m in winter in the southern hemisphere. There are, however, bursts of activity in the northern hemisphere at mid-latitudes during each win-ter. These bursts reach amplitudes as large as 90 m, but are in all cases smaller than the summertime amplitudes. Again, note that the amplitudes are small at latitudes northwards of 60◦. However, in the southern hemisphere, significant ampli-tudes are present to latiampli-tudes as far south as −75◦.
The W2 results of Fig. 3c reveal a rather similar picture to that of the W3. Again, although there are amplitude maxima in each hemisphere during the summer, there is also activity
of equivalent amplitude in the Northern Hemisphere winter. In the southern hemisphere, wave amplitudes are strongest during the months of December to February. The ampli-tudes reach values of ∼100 m in both the northern and south-ern hemisphere. The oscillations extend as far polewards as
±70◦.
The E2 results of Fig. 3d reveal a rather different picture. In contract to the other wavenumbers, the amplitude of E2 maximises in both hemispheres during the winter. There is also significant activity in the southern hemisphere sum-mer, which may be an effect of aliasing from the W3 since these maxima occur at the same time as those of the W3 (see Sect. 4). The E2 activity generally occurs poleward of ±50◦. Wave amplitudes are strongest during the months of Novem-ber to February for the northern hemisphere and June to Au-gust plus January for the southern hemisphere. Amplitudes reach values of ∼100 m in both hemispheres.
To see if these observations can explain the behaviour ob-served over Esrange (Fig. 1), the data were reanalysed to ex-amine the latitudes from 63◦to 73◦N at a height of ∼91 km. The monthly variances of two-day wave activity as observed by the radar are shown in Fig. 4a for the August 2004 to November 2007 interval for which Aura MLS data are con-sidered. Figure 4b, c presents the corresponding time series of geopotential heights over this latitude range. The W3 and E2 results are shown in Fig. 4b and the W4 and W2 results in Fig. 4c.
During winter, the greatest activity (geopotential ampli-tude) is present in the E2 component and there is some ac-tivity in the W3. However, because of the effect of aliasing we do not believe this wintertime W3 activity is significant (see Sect. 4). The summertime activity seems to be a com-bination of the W3 and W2, with only small contributions from the W4 and E2. These results show that the summer time and winter time polar two-day wave have very different wavenumbers, i.e., largely W3 and E2, respectively.
Prata (1983) showed that there is a wintertime E2 polar two-day wave in the stratosphere. To determine if this wave is connected to that observed here in the mesosphere, we examined the MLS results from 10 to 100 km and 63◦ to 73◦N. Figure 5a presents time-height contours of the geopo-tential amplitude of the E2 two-day wave calculated as 15-day means. The figure clearly shows that the wave observed in the mesosphere is also present to heights below 30 km and reaches maximum amplitudes at heights of about 60 km, i.e., near the stratopause. This means that the MLT-region and stratospheric observations are almost certainly observations of a single E2 planetary wave that is present at heights from below 30 km to above 100 km.
The wintertime occurrence of this E2 wave can be ex-plained in terms of the Charney and Drazin theorem (1961). The zonal phase speed, cx, of the E2 two-day wave at the
68◦N latitude of Esrange is ∼52 ms−1. Charney-Drazin the-orem states that a planetary wave can only propagate for cx
values such that 0< ¯u−cx<Uc, where ¯u is the zonal mean
(a)
(b)
(c)
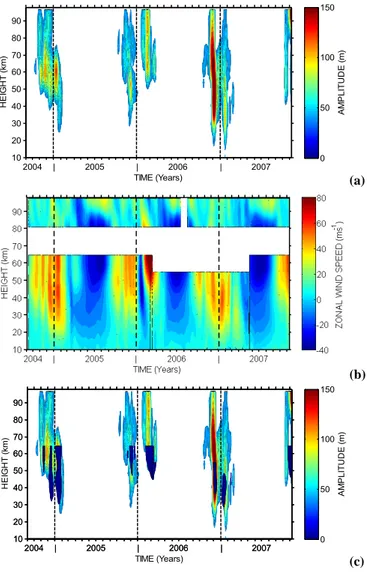
Fig. 5. Time-height contours of (a) geopotential-height amplitudes
for an E2 wave of periods between 42 and 56 h, (b) Zonal mean zonal winds from the UKMO stratospheric assimilated data in the lower part and zonal mean winds from the Esrange meteor radar in the upper part. (c) Same as Fig. 5a but with shaded regions which indicate where the zonal mean zonal winds from Fig. 5b satisfy the Charney-Drazin theorem for the E2 two-day wave. These regions predicted where this wave would be able to propagate. The latitude range is 63◦and 73◦N.
wind and Ucis the critical speed, which is 28.6 ms−1(for this
latitude and assuming an E2 wave of meridional wavenumber 2) e.g., Forbes (1995). This means that the E2 two-day wave should only be able to propagate in regions where the zonal wind speed lies between ∼52 and 81 ms−1. To see if this is actually the case in our observations, we calculated the zonal mean zonal winds from the UKMO stratospheric assimilated data for the August 2004 to November 2007 interval corre-sponding to the Aura MLS data. To match these to the MLS observations they were calculated as 15-day means within the 63◦–73◦N latitude range. Figure 5b shows the zonal
Fig. 6. Time-latitude contours of zonal mean zonal winds from the
UKMO stratospheric assimilated data at a height of about 54 km. Arrows at the top of the plot indicate times of major stratospheric warmings.
mean zonal winds from this analysis and also zonal mean winds from the Esrange meteor radar in the upper part of the figure. Note that the two datasets are not strictly compara-ble as the UKMO stratospheric assimilated winds are zonal means and the Esrange winds represent a single location.
From Fig. 5a and b, it can be seen that there is a strong correspondence between the strength of the zonal winds and the occurrence of the E2 wave. In particular the wave only reaches large amplitudes when the zonal winds are above about 50 ms−1. To investigate this further, Fig. 5c presents
the amplitude data of Fig. 5a, with regions marked where the UKMO stratospheric assimilated winds have values in the range 52 to 81 ms−1. It can clearly be seen that the E2 wave has larges amplitudes at heights and times that correspond to zonal winds falling within this range. This relation to the mean wind provides compelling support for the interpreta-tion of the E2 two-day wave as a planetary wave. Note that the shaded regions of Fig. 5c do not extend above ∼65 km because this is the upper limit of the UKMO stratospheric assimilated analyses (∼55 km between March 2006 and May 2007).
Further, the occurrence of major sudden stratospheric warmings has the effect of reversing the zonal mean winds at high latitudes. Therefore, when a major stratospheric warm-ing is present the E2 two-day wave should not be able to propagate as the wind regime will not satisfy the Charney-Drazin criterion. A major warming involves a reversal of the winds from the pole to 60◦North in the northern hemi-sphere (at the 10 hPa level). Figure 6 shows latitude-time contours of the UKMO stratospheric assimilated zonal mean zonal winds at about 54 km, where the wave would other-wise have large amplitude. Two wind reversals associated with warmings are apparent in Fig. 6 during March 2005 and January 2006 (indicated on the figure). At the corresponding times in Fig. 5a, the E2 two-day wave is either not present or has small amplitudes (However, see Sect. 4 for comments on the effect of stratospheric warmings on the excitation of the wave).
754 D. J. Sandford et al.: The wintertime two-day wave Finally, the vertical gradients of phase in the MLS
obser-vations were used to calculate the vertical wavelength of the polar wintertime E2 two-day wave. Typical vertical wave-lengths were found to be 123±9 km.
From the above analyses, we conclude that the polar win-tertime mesospheric two-day wave is dominated by an E2 two-day planetary wave, which extends through the strato-sphere and mesostrato-sphere.
4 Discussion
Satellite studies of planetary waves can be complicated by aliasing because the longitude and time of observation are not independent (e.g., Wu et al., 1995a). The data can there-fore have the same pattern present for multiple wavenumber-period combinations. In particular, a W3 two-day wave, could alias to an E2 two-day wave. The magnitude of the signal produced by aliasing depends on the difference in lon-gitude between the ascending and descending nodes of the satellite’s orbit. It can be shown using the method described by Wu et al. (1995a) that in our observations up to about 36% of the amplitude of the E2 two-day wave would be aliased into the W3 two-day wave at 68◦N, and visa-versa. This means that during the winter, when the E2 amplitude is actu-ally more than 200% that of the W3 (Fig. 4b), it is not likely that the E2 signal contains a significant aliased component of the W3. Further, the observation that the E2 obeys Charney-Drazin theorem is also indicative that it is a real wave and not a result of aliasing. We therefore conclude for these two reasons that the observed E2 two-day wave does not contain a significant aliased component – at least in winter.
However, we note that in winter 2004/05 and 2006/07 the W3 amplitudes are about one-third those of the E2 and so we cannot be confident that the W3 signal is not entirely caused by aliasing from the E2.
Prata (1984) reported observations of an E2 two-day wave in the polar winter stratosphere. Prata’s observations were only made at a height of ∼45 km. Our radar and satellite observations reveal that this wave extends to at least 100 km and that maximum amplitude occur at ∼60 km.
Two mechanisms have been proposed for the excitation of the E2 two-day wave in the stratosphere and/or mesosphere. Firstly, Hartmann (1983), used model studies to examine barotropically unstable flows in the wintertime stratosphere similar to those of the polar night jet. The analysis produced normal wave modes, associated with regions of negative po-tential vorticity gradient on the poleward side of the polar night jet. This instability was strongest for wavenumbers 1 and 2. The wave number 1 instability was found to have a 4-day period. Hartmann extended an argument of Fred-erikson (1982) to suggest that the four-day, wavenumber 1, instability will favour the growth of other instabilities of sim-ilar zonal phase speeds. Hartmann noted that an E2 two-day wave will have the same zonal phase speed as an E1
four-day wave and so will promote the growth of the E2 wave. Prata (1984) and Lait and Stanford (1988) presented obser-vational evidence of these four- and two-day waves in the winter stratosphere.
Secondly, Palo et al. (2007) reported observations of an E2 two-day wave in the summer mesosphere, which they attributed to a nonlinear coupling between the W3 two-day wave and a migrating (W1) diurnal tide. In this mechanism a non-linear coupling produces secondary waves, including waves which have frequencies and wavenumbers that are the sum and difference of those of the primary wave and tide. This mechanism can therefore generate as a “differ-ence” wave a wave that has E2 wavenumber and two-day period. However, the E2 polar two-day wave observed here is unlikely to have been generated by the non-linear mixing of a W3 and a diurnal tide because the W3 amplitudes that we observe can be explained entirely as a result of aliasing.
Our observations suggest that the polar E2 wave is strongly suppressed during major stratospheric warmings (see Figs. 5a and 6). This suppression probably has two explanations. The first is that the winds in the stratosphere do not favour its propagation as discussed in section 3. The second is that an excitation of the wave itself by regions of negative potential vorticity on the poleward side of the strato-spheric polar vortex is no longer possible as the polar vortex breaks up.
We therefore suggest that the wintertime polar two-day wave is an E2 wave which has propagated upwards from the stratosphere. The amplitudes maximise around the stratopause suggesting that the wave may be evanescent above this height.
5 Conclusions
Observations of mesospheric winds over Esrange (68◦N)
re-veal planetary waves with a period near 2 days in summer and in winter. The wintertime two-day wave is much stronger than that observed at mid-latitudes in winter and we have in-vestigated its structure and origin. Observations made with the Aura MLS instrument reveal the winter two-day wave to be an eastward-propagating zonal wavenumber two plane-tary wave. Although there is a W3 wave present in the winter, aliasing considerations suggest this is likely to be a product of aliasing from the E2 wave rather than a genuine oscilla-tion. The E2 appears to be small in the summertime, which instead is dominated by the classical W3 structure.
Because the wintertime W3 wave has negligible ampli-tude, this suggests that the wintertime polar E2 wave is not generated by non-linear interaction between the W3 and the migrating diurnal tide at mesospheric heights, but rather has been generated in the stratosphere and has ascended to the mesosphere. This interpretation is reinforced by the ob-servation of large E2 amplitudes around the polar winter stratopause. This E2 wave appears to be the mesospheric
manifestation of the E2 wave observed in the stratosphere by Venne and Stanford (1982), Hartmann (1983), Prata (1984), Lait and Stanford (1988) and Manney et al. (1988), the gen-eration of which is attributed to instabilities in the polar night jet.
We therefore suggest that although “two–day” wave activ-ity is observed at polar latitudes in both summer and winter, the explanation for the summer and winter waves is quite different. The summer two-day wave appears to have the ex-pected W3 (plus W2 and W4) wave structure, whereas the polar winter two-day wave is largely or entirely an E2 wave originating in the stratosphere.
Acknowledgements. Work at the Jet Propulsion Laboratory, California Institute of Technology, was done under contract with the National Aeronautics and Space Administration.
Edited by: P. Hartogh
References
Charney, J. G. and Drazin, P. G.: Propagation of Planetary-Scale Disturbances from the Lower into the Upper Atmosphere, J. Geo-phys. Res., 66, 83–109, 1961.
Forbes, J. M.: Tidal and Planetary Waves, in: The Upper Meso-sphere aand Lower ThermoMeso-sphere: A Review of Experiment and Theory, Geophys. Monogr., Vol. 87, edited by: Johnson, R. M. and Killeen, T. L., AGU, Washington, D.C., 67–87, 1995. Frederiksen, J. S.: Instability of the three-dimensional distorted
po-lar vortex at the onset of the sudden stratospheric warming, J. Atmos. Sci., 39, 2313–2329, 1982.
Hartmann, D. L.: Barotropic Instabilities of the Polar Night Jet-Stream, J. Atmos. Sci., 40(4), 817–835, 1983.
Lait, L. R. and Stanford, J. L.: Fast, Long-Lived Features in the Polar Stratosphere, J. Atmos. Sci., 45(24), 3800–3809, 1988. Manson, A. H., Meek, C. E., Hall, C. M., Nozawa, S., Mitchell,
N. J., Pancheva, D., Singer, W., and Hoffmann, P.: Mesopause dynamics from the Scandinavian triangle of radars within the PSMOS-DATAR Project, Ann. Geophys., 22, 367–386, 2004, http://www.ann-geophys.net/22/367/2004/.
Meek, C. E., Manson, A. H., Franke, S. J., Singer, W., Hoffmann, P., Clark, R. R., Tsuda, T., Nakamura, T., Tsutsumi, M., Hahan, M., Fritts, D. C., Isler, I., and Portnyagin, Yu, I.: Global study of northern hemisphere quasi-2-day wave events in recient summers near 90 km altitude, J. Atmos. Sol. Terr. Phys., 58, 1401–1411, 1996.
Mitchell, N. J., Williams, P. J. S., Beard, A. G., Buesnel, G. R., and Muller, H. G.: Non-linear planetary tidal wave interactions in the lower thermosphere observed by meteor radar, Ann. Geophys., 14, 364–366, 1996,
http://www.ann-geophys.net/14/364/1996/.
Mitchell, N. J., Pancheva, D., Middleton, H. R., and Hagan, M. E.: Mean winds and tides in the Arctic mesosphere and lower thermosphere, J. Geophys. Res., 107(A1), 1004, doi:10.1029/2001JA900127, 2002.
Muller, H. G. and Nelson, L.: A travelling quasi 2-day wavbe in the meteor region, J. Atmos. Terr. Phys., 40, 761–766, 1978. Norton, W. A. and Thuburn, J.: The two-day wave in a middle
at-mosphere GCM, Geophys. Res. Lett., 23(16), 2113–2116, 1996. Nozawa, S., Imaida, S., Brekke, A., Hall, C. M., Manson, A., Meek, C., Oyama, S., Dobashi, K. and Fujii, R.: The quasi 2-day wave observed in the polar mesosphere, J. Geophys. Res., 108(D2), 4039, doi:10.1029/2002JD002440, 2003a.
Nozawa, S., Iwahashi, H., Brekke, A., Hall, C. M., Meek, C., Man-son, A., Oyama, S., Murayama, Y., and Fujii, R.: The quasi 2-day wave observed in the polar mesosphere: Comparison of the char-acteristics observed at Tromsø and Poker Flat, J. Geophys. Res., 108(D24), 4748, doi:10.1029/2002JD003221, 2003b.
Palo, S. E., Forbes, J. M., Zhang, X., Russell III, J. M., and Mlynczak, M. G.: An eastward propagating two-day wave: Ev-idence for nonlinear planetary wave and tidal coupling in the mesosphere and lower thermosphere, Geophys. Res. Lett., 34, L07807, doi:10.1029/2006GL027728, 2007.
Pancheva, D., Mitchell, N. J., Manson, A. H., Meek, C. E., Jacobi, Ch., Protinyargin, Yu., Merzlyakov, E., Hocking, W. K., Mac-Dougall, J., Singer, W., Igarashi, K., Clark, R. R., Riggin, D. M., Franke, S. J., Kurschner, D., Fahrutdinova, A. N, Kashcheyev, B. L., Oleynikov, A. N., and Muller, H. G.: Variability of the quasi-2-day wave observed in the MLT region during the PSMOS cam-paign of June-August 1999, J. Atmos. Sol. Terr. Phys., 66, 539– 565, 2004.
Plumb, R. A.: Baroclinic Instability of the Summer Mesosphere: A Mechanism for the Quasi-Two-Day Wave?, J. Atmos. Sci., 40, 262–270, 1983.
Prata, A. J.: The 4-Day Wave, J. Atmos. Sci., 41, 150–155, 1984. Salby, M. L.: The 2-Day Wave in the Middle Atmosphere:
Ob-servations and Theory, J. Geophys. Res., 86(C10), 9654–9660, 1981.
Teitelbaum, H. and Vial, F.: On Tidal Variability Induced by Non-linear Interaction With Planetary Waves, J. Geophys. Res.-Space Phys., 96, 14 169–14 178, 1991.
Venne, D. E. and Stanford, J. L.: An Observational Study of High-Latitude Stratospheric Planetary-waves in Winter, J. Atmos. Sci., 39(5), 1026–1034, 1982.
Waters, J. W., Froidevaux, L., Harwood, R. S., et al.: The Earth Observing System Microwave Limb Sounder (EOS MLS) on the Aura Satellite, IEEE T. Geosci. Remote, 44(5), 1075–1092, 2006.
Wu, D. L., Hays, P. B., and Skinner, W. R.: A Least Squares Method for Spectral Analysis of Space-Time Series, J. Atmos. Sci., 52(20), 3501–3511, 1995a.
Wu, D. L., Fishbein, W. G., and Waters, J. W.: Excitation and Evo-lution of the Quasi-2-Day Wave Observed in UARS/MLS Tem-perature Measurements, J. Atmos. Sci., 53(5), 728–738, 1995b.