HAL Id: hal-00295605
https://hal.archives-ouvertes.fr/hal-00295605
Submitted on 10 Feb 2005
HAL is a multi-disciplinary open access
archive for the deposit and dissemination of
sci-entific research documents, whether they are
pub-lished or not. The documents may come from
teaching and research institutions in France or
abroad, or from public or private research centers.
L’archive ouverte pluridisciplinaire HAL, est
destinée au dépôt et à la diffusion de documents
scientifiques de niveau recherche, publiés ou non,
émanant des établissements d’enseignement et de
recherche français ou étrangers, des laboratoires
publics ou privés.
satellite measurements at different solar zenith angles
A. Bracher, M. Sinnhuber, A. Rozanov, J. P. Burrows
To cite this version:
A. Bracher, M. Sinnhuber, A. Rozanov, J. P. Burrows. Using a photochemical model for the validation
of NO2 satellite measurements at different solar zenith angles. Atmospheric Chemistry and Physics,
European Geosciences Union, 2005, 5 (2), pp.393-408. �hal-00295605�
www.atmos-chem-phys.org/acp/5/393/ SRef-ID: 1680-7324/acp/2005-5-393 European Geosciences Union
Chemistry
and Physics
Using a photochemical model for the validation of NO
2
satellite
measurements at different solar zenith angles
A. Bracher, M. Sinnhuber, A. Rozanov, and J. P. Burrows
Institute of Environmental Physics and Remote Sensing (IUP/IFE), University of Bremen, Otto-Hahn-Allee 1, 28334 Bremen, Germany
Received: 2 April 2004 – Published in Atmos. Chem. Phys. Discuss.: 21 September 2004 Revised: 17 December 2004 – Accepted: 3 February 2005 – Published: 10 February 2005
Abstract. SCIAMACHY (Scanning Imaging Spectrometer for Atmospheric Chartography) aboard the recently launched Environmental Satellite (ENVISAT) of ESA is measuring so-lar radiance upwelling from the atmosphere and the extrater-restrial irradiance. Appropriate inversion of the ultraviolet and visible radiance measurements, observed from the at-mospheric limb, yields profiles of nitrogen dioxide, NO2, in the stratosphere (SCIAMACHY-IUP NO2 profiles V1). In order to assess their accuracy, the resulting NO2 pro-files have been compared with those retrieved from the space borne occultation instruments Halogen Occultation Experi-ment (HALOE, data version v19) and Stratospheric Aerosol and Gas Experiment II (SAGE II, data version 6.2). As the HALOE and SAGE II measurements are performed during local sunrise or sunset and because NO2 has a significant diurnal variability, the NO2 profiles derived from HALOE and SAGE II have been transformed to those predicted for the solar zenith angles of the SCIAMACHY measurement by using a 1-dimensional photochemical model. The model used to facilitate the comparison of the NO2 profiles from the different satellite sensors is described and a sensitivity ananlysis provided. Comparisons between NO2profiles from SCIAMACHY and those from HALOE NO2but transformed to the SCIAMACHY solar zenith angle, for collocations from July to October 2002, show good agreement (within +/−12%) between the altitude range from 22 to 33 km. The results from the comparison of all collocated NO2 profiles from SCIAMACHY and those from SAGE II transformed to the SCIAMACHY solar zenith angle show a systematic neg-ative bias of 10 to 35% between 20 km to 38 km with a small standard deviation between 5 to 14%. These results agree with those of Newchurch and Ayoub (2004), implying that above 20 km NO2profiles from SAGE II sunset are probably somewhat high.
Correspondence to: A. Bracher
(bracher@uni-bremen.de)
1 Introduction
Nitrogen dioxide, NO2, plays a number of important roles in the chemistry of the stratosphere. It is not only involved in catalytic cycles leading to ozone, O3, destruction, but also in processes, buffering chlorine activation and oxides of hydro-gen through the formation of the temporary reservoir, such as chlorine nitrate, ClONO2, (Brasseur and Solomon, 1986), Reservoir species like HO2NO2and N2O5have the property to remove reactive species like NO2for a certain time from fast reactions.
Gaseous peroxynitric acid (HO2NO2)is produced by the reaction:
NO2+HO2+M → HO2NO2+M (R1)
While it is destroyed by photolysis and reaction with OH:
HO2NO2+hv →NO2+HO2 (R2)
HO2NO2+OH → H2O + O2+NO2, (R3) as well as by collisional decomposition which is the reverse reaction of (R1). Thus the molecule HO2NO2is important in both nitrogen and hydrogen chemistry.
Dinitrogen pentoxide (N2O5)is formed during the night by the following reactions of NO2and NO3:
NO2+O3→NO3+O2 (R4)
NO3+NO2+M → N2O5+M (R5)
After sunrise, N2O5photolyzes back into NO2and NO3:
N2O5+hv →NO2+NO3 (R6)
It can also be destroyed by collisional decomposition which is the reverse reaction of (R5).
NO2photolyzes to form NO,
and NO reacts with O3to reform NO2
O3+NO → NO2+O2. (R8)
The behaviour of NO2in the stratosphere is largely con-troled by the above reactions, which result in a significant diurnal variation in NO2amount, with a minimum after sun-rise and a maximum shortly after sunset (when NO is rapidly converted to NO2). The partitioning of N2O5 also leads to a seasonal variation in NO2 densities. During polar sum-mer, the near-constant sunlight prevents buildup of NO3and hence precludes formation of N2O5. Thus, NO2densities are higher in the polar summer than in the winter, at which time more NOx is sequestered in the N2O5 reservoir (Solomon and Keys, 1992)
The short-lived radical NO2has been observed in the at-mosphere since the 1970s by means of passive remote sens-ing in the ultraviolet and visible spectral regions from instru-mentation either at the ground, or flown on aircraft, balloons, and spacecraft. Similarly, instruments aboard satellite plat-forms, aimed at retrieving NO2profiles, have also employed solar occultation: examples are the family of instruments known as the Stratospheric Aerosol and Gas Experiment (SAGE I, II, III; Chu and McCormick, 1979; Mauldin et al., 1985; NASA LaRC, 2004), the two instruments called Po-lar Ozone and Aerosol Measurements (POAM II, III; Glac-cum et al., 1996; Lucke et al., 1999), the two Improved Limb Atmospheric Spectrometers (ILAS I, II; Sasano et al., 1999; Nakajima et al., 2004) and the Halogen Occultation Experiment (HALOE; Russell III et al., 1993). The sun-synchronous orbits of the satellites on which POAM, ILAS and SAGE III instruments are flown, result in solar occul-tation measurements only being possible at high latitudes. HALOE, SAGE I and SAGE II fly on platforms in asyn-chronous orbits and thereby achieve global coverage of solar occultation measurements within a year.
As explained above, the concentration of NO2 in the stratosphere exhibits a significant diurnal cycle, measure-ments at a variety of solar zenith angles (SZA) are there-fore required to improve our understanding of the chemistry and dynamics of NO2in the stratosphere. As early as 1980, NO and NO2 were measured simultaneously in the strato-sphere with a balloon-borne instrument, and the measured diurnal variability was shown to agree qualitatively well with model results (Roscoe et al., 1981). In the study by Payan et al. (1999) the balloon-borne instruments Limb Profile Mon-itor of the Atmosphere (LPMA) and the Absorption par Mi-noritaires Ozone et NOx(AMON) have been used to measure NO2, during sunset and also 5 h later during night. In addi-tion, since 1994 balloon flights of the Michelson Interfer-ometer for Passive Atmospheric Sounding (MIPAS-B) have been undertaken for different geophysical conditions of the stratosphere. Vertical profiles of NO2are measured among the other major components of the nitrogen family at night, at sunrise and a few hours after sunrise (Stowasser et al., 2003). In addition to its solar occultation measurements, the SAGE
III instrument measures in lunar occulation mode, which en-ables to retrieve NO2profiles in the SZA range of between 95◦and 115◦(NASA LaRC, 2004).
SCIAMACHY (Scanning Imaging Absorption Spectrom-eter for Atmospheric Chartography, see e.g. Bovensmann et al., 1999), MIPAS (Michelson Interferometer for Passive At-mospheric Sounding, see e.g. Stiller et al., 2001) and GO-MOS (Global Ozone Monitoring by Occultation of Stars, see e.g. Bertraux et al., 1991) are space-based atmospheric instruments launched on board ENVISAT (Environmental Satellite) in March 2002. These three atmospheric EN-VISAT instruments provide information about a variety of trace gases, including NO2 profiles. ENVISAT orbits the Earth 14 times per day in a polar sun-synchronous orbit with an inclination of 98.7◦in a descending node and having an equator crossing time of 10:00 local solar time. This results in measurements being made at a range of SZAs, during day (MIPAS and solar occultation and limb measurements of SCIAMACHY), and night (MIPAS, GOMOS and during the time around local full moon SCIAMACHY lunar occul-tation). Global coverage of the limb sounding measurements is reached within less than six days.
In order to exploit fully the retrievals of NO2 from the measurements made aboard ENVISAT, the relevant data products have to be validated. In addition to validation by comparison with balloon measurements, a validation with a collocated data set of a larger seasonal and global coverage is needed. The use of independent satellite measurements to validate trace gas products of the ENVISAT instruments has the great advantage that pole-to-pole coverage for all seasons is available and that validation activities are not restricted to a limited set of dates and locations. As a result, this study at-tempts to validate the NO2products V1 retrieved at the Insti-tute of Environmental Physics from SCIAMACHY Level-0 limb data by comparisons with the established and well val-idated data products from satellite instruments HALOE (de-scribed in Russell III et al., 1993), and SAGE II (de(de-scribed in Mauldin et al., 1985).
As the NO2 measurements from SAGE II and HALOE are performed during local sunrise or sunset, measurements made in space and time close to the ENVISAT measure-ments have to take into account appropriately the difference in the SZAs of the SCIAMACHY and the occultation instru-ment. Photochemical model studies of varying complexity have been used extensively in the past to investigate different aspects of trace gas measurements, and also to make mea-surements taken by different instruments, in different air-masses or at different SZAs comparable. Harder et al. (2003) compared modeled BrO profiles; in this case, the model was not constrained, but only measurements, where NO2, O3 and N2O measured simultaneously to the BrO agreed well with model results, were chosen for the comparison. Stowasser et al. (2003) investigated the change of several NOyspecies at different SZAs by comparing measurements from the MIPAS-B to model results. In this case, also the
model was not constrained, and large differences between the modelled and measured individual NOyspecies were ob-served, but the HNO3/NOy, N2O5/NOy, and NO2/NOy ra-tios were found to be in good agreement over a large alti-tude range. Sinnhuber et al. (2002) use a combination of a global three-dimensional model with a one-dimensional model to intercompare ground-based measurements of BrO slant columns at different stations ranging from the Northern high latitudes over mid-latitudes and the tropics to Southern high latitudes. Vogel et al. (2003) compared measurements from a balloon-borne in-situ ClO/BrO instrument to model results; in this case, the model was initialised with measure-ments obtained several weeks earlier with another balloon-borne instrument. Marchand et al. (2003) have assimilated measurements of NO2and O3made during sunrise and sun-set by a SAOZ instrument onboard a long-duration balloon into a photochemical model to intercompare measurements taken with the same instrument at different times. They gen-erally find a good agreement and conclude that the night-time chemistry of NOyis generally well understood. To our knowledge, photochemistry models have not been used so far to validate NO2satellite measurements made at different SZAs. However, there is a study by Marchand et al. (2004) that assimilates NO2 and O3 measured by GOMOS into a model to investigate the self-consistency of GOMOS night-time NO2, O3and NO3measurements.
In this study a 1-dimensional photochemical model was used in order to transform the NO2measurement from solar occultation to the SZA during the SCIAMACHY NO2 mea-surement. We provide a detailed description on the method used for transforming the solar occultation measurements to the selected SZA of the limb measurements of SCIA-MACHY. A sensitivity study is presented and used in as-sessing the comparison of the NO2 profiles retrieved from the different satellite sensors. The first results of the com-parisons between SCIAMACHY and HALOE, and SCIA-MACHY and SAGE II from summer/fall 2002 are shown.
2 Satellite NO2data sets and collocation criteria
2.1 SCIAMACHY-IUP stratospheric NO2profiles V1 SCIAMACHY on the recently launched satellite ENVISAT is a passive remote sensing instruments, which measures the back scattered reflected and transmitted electromagnetic ra-diation up welling from the atmosphere in different view-ing geometries. SCIAMACHY comprises eight spectral channels between 240 and 2380 nm with a channel depen-dent spectral resolution of between 0.2 and 1.5 nm. SCIA-MACHY is the first satellite instrument, which makes spec-troscopic observation of the upwelling radiation at the top of the Earth’s atmosphere in nadir viewing and limb viewing geometries, as well as the solar and lunar occultation modes. For this study only data from SCIAMACHY limb
observa-tions have been used. These yield NO2 profiles having al-most global coverage (within six days) and a reasonably high vertical resolution. In the novel limb scattering method, the line of sight follows a tangential path through the atmosphere and solar radiation is detected that is scattered along the line of sight into SCIAMACHY’s field of view, and transmitted from the scattering point to the instrument. SCIAMACHY scans the tangent height (TH) range between about −3 and 100 km with TH steps of about 3.3 km. SCIAMACHY limb measurements are performed during the day and cover the SZAs between around 20◦and 92◦. Further information on the SCIAMACHY instrument and its mission objectives are provided in Bovensmann et al. (1999).
For this study, the NO2profiles have been retrieved from the SCIAMACHY level 0 data, which are radiometrically and spectrally uncalibrated signals. The signal counts have been integrated over the entire azimuth scan of 960 km, which yields the optimal signal-to-noise ratio. At a later date retrievals at the four different azimuth angles, measured at each tangent height by SCIAMACHY are planned. The data are divided by the integration times and a dark cur-rent correction is performed by substracting the spectrum at 150 km tangent height. SCIAMACHY NO2profiles, called SCIAMACHY-IUP NO2profiles V1, are derived from the re-trieval method described in detail in Eichmann et al. (2004) and von Savigny et al. (2004). The retrieval is performed in the spectral range 420–455 nm using ratios of limb spectra in a selected tangent height region to a limb measurement at a reference tangent height of around 40 km.
The measurements of the scattered solar radiation in limb viewing geometry as performed by the SCIAMACHY instru-ment are simulated using the CDI radiative transfer model (Rozanov et al., 2001). This model calculates the limb radi-ance by accounting for the single scattered radiradi-ance properly and using an adequate approximation to determine the mul-tiple scattering. The optimal estimation method is used for the retrieval of the Stratospheric NO2 profiles for the alti-tude range from about 15 up to 35–40 km. The accuracy in retrieved number densities is estimated to be about 15–20% between 15 and 30 km. Outside this altitude range, and for meteorological situations with little or no stratospheric NO2 larger errors are expected.
2.2 Satellite occultation data used for comparisons of satel-lite NO2profiles
Both instruments used to validate SCIAMACHY NO2data, HALOE and SAGE II, measure trace gas profiles during fif-teen spacecraft sunrises and sunsets daily, normally in oppo-site hemispheres, although at certain times of the year these measurements occur on the same day and almost overlap in space. Both solar occultation modes correspond to a good approximation to a SZA of 90◦. The latitudes of the NO2 profiles, observed by HALOE and SAGE II, change from one
day to the next such that sampling of the global atmosphere between about 70◦S and 70◦N results over a 1-year-period.
2.2.1 HALOE NO2measurements
The HALOE instrument was launched in September 1991 on board the Upper Atmosphere Research Satellite (UARS) and routine observations by HALOE started in October 1991. In this study we made comparisons to Version19 (v19) of the HALOE NO2 data product. After an extensive validation of v17 by Gordley et al. (1996), the quality of Version 18, v18, HALOE NO2data is characterized on the HALOE web page (http://haloedata.larc.nasa.gov). V18 data agree with correlative observations from 25 to 45 km within the ±10 to ±15% level, with no obvious bias. The NO2 data are de-scribed as excellent from the tropopause to 25 km in clear air conditions, but exhibit a low bias in the presence of aerosols. The aerosol correction in the lower stratosphere below about 20 km is large being more than 100%. However, the data from the last 5 years should be more accurate because the aerosol loading is at its lowest since 1978, because of the lack of volcanic intrusions into the stratosphere. Randall et al. (2002) compared HALOE v19 NO2data to data from Atmospheric Trace Molecule Spectroscopy Experiment (AT-MOS). Results show that between 25 and 42 km the measure-ments from the two instrumeasure-ments agree within 10%. ATMOS NO2data have an estimated accuracy of about 6% in the 20 to 45 km range (Abrams et al., 1996). The vertical resolu-tion of HALOE NO2data is given with 2 km (Gordley et al., 1996).
2.2.2 SAGE II NO2measurements
The longest record of satellite high-resolution NO2 profile measurements have been made by the solar occultation in-strument SAGE II which was launched on the Earth Radi-ation Budget Satellite (ERBS) in October 1984 and is still operational. The instrument field of view in the direction normal to the line of sight is 0.5 km vertically by 2.5 km hor-izontally. The NO2measurements are derived from the dif-ference between the absorptions in narrow bandwidth chan-nels centered at 448 and 453 nm. The vertical resolution of SAGE II NO2data is around 2 km. In the extensive SAGE II NO2validation study on a much older data version by Cun-nold et al. (1991), the precision of the profiles is about 5% and the absolute accuracy of the measurements is estimated for sunset measurements to be 15%, based on uncertainties in the absorption cross-section and their temperature depen-dence. Agreement of approximately 10% was seen in com-parisons to balloon-measured profiles over Southern France between 23 and 32 km altitude (the highest altitude of the balloon observations) and to ATMOS profiles obtained four days later between 23 and 37 km altitude. The SAGE II data version 6.1, the forerunner of the version used in this study, is characterized to have achieved a significant improvement in
the NO2retrievals through a minor modification to the spec-troscopy, which cause a concomitant improvement to short wavelength aerosol extinction particularly in the lower strato-sphere and during low aerosol loading periods (SAGE II website: http://www-sage2.larc.nasa.gov/data/v6 data/). As stated by Larry Thomason (PI of SAGE II project, pers. com., 2004), SAGE II NO2data version 6.1 and 6.2 are con-siderably better than version 6.0, but still biased by about 10% compared to HALOE.
2.3 Data sets
All available SCIAMACHY-IUP NO2profiles V1, HALOE v19, and SAGE II v6.2 data sets from 24 July 2002, and for the period from 12 September 2002 to 14 October 2002 were searched for near coincident measurements. The time period for the comparison was chosen because for the time around the split of the Antarctic ozone hole at 27 September 2002 more SCIAMACHY level-0 data were available than during other times.
2.4 Spatial and time distance criteria for coincident mea-surements
SCIAMACHY NO2 profiles have been compared with HALOE and SAGE II measurements for the coincidence cri-teria that measurements took place on the same day and that the tangent point of HALOE or SAGE II is within 500 km of the centre of the nearest SCIAMACHY ground pixel. This ensures that the HALOE or SAGE II tangent point is within or near the SCIAMACHY ground scene which is rather large for SCIAMACHY being about 960 km×400 km.
2.5 Criteria for coincidences within the same air mass Validation at the edge of different air masses is more diffi-cult, because gradients in the horizontal distribution result from transport processes, e.g. at the polar vortex or at the upper troposphere lower stratosphere region (UTLS). There-fore, besides to identifying collocated measurements by lim-iting time difference and distance between two observation points, additional criteria were selected to ensure that collo-cations were made in the same air masses according to the method described in Bracher et al. (2004). The tropopause height and the position of the polar vortex were determined by analysis of the potential vorticity (PV) distribution. PV values measured at the same geolocation and day of each collocated measurement were taken from the United King-dom Meteorological Office (UKMO) assimilated meteoro-logical dataset available in a 3.75◦×2.5◦(longitude-latitude) grid resolution (Swinbank and O’Neill, 1994) and spatially interpolated to the observation point. As a result of the relatively large ground scene of a SCIAMACHY profile, the corner coordinates of the ground scene for each SCIA-MACHY profile were checked for their homogeneity of PV. For samples outside the tropics, the tropopause was assumed
to be the 3.5 PVU level, which was shown by Hoerling et al. (1991) to be a good estimate for the dynamical tropopause height. Inside the tropics where the dynamical tropopause is not defined, the 380 K isentropic level was a proxy for the tropopause. To separate collocations, where the four corners of a SCIAMACHY ground pixel and the collocated HALOE or SAGE II tangent point were inside the polar vortex or out-side the vortex, matches where the PV of both measurements at the isentropic level of 475 K were selected having either greater than 40 or less than −40 PVU (i.e. inside the vortex) or between −30 and 30 PVU (i.e. outside the vortex), respec-tively. For the tropopause height, deviations within 1 km for collocations were tolerated.
This applied method is fast in screening a larger number of collocations for their coincidence regarding air masses. Bracher et al. (2004) showed that including these atmo-spheric dynamics criteria concerning tropopause height and polar vortex for the selection of collocated measurements improves significantly individual comparisons. Opposed to that, for comparisons of multi-platform measurements where only a small amount of matches have been found within a chosen spatial-temporal vicinity the methods developed by Bacmeister et al. (1999), Lu et al. (2000), and Danilin et al. (2002) to enlarge the number of matching by using a tra-jectory hunting technique is more appropriate. The results of these studies showed that in this case with the trajectory hunting technique comparisons were statistically more robust than just limiting the comparisons to the traditional correla-tive analysis.
3 Model used for scaling NO2measurements
As pointed out above, NO2 in the stratosphere is relatively short-lived, and has a significant diurnal variability. The live-cycle of NO2is determined by a fast exchange between NO and NO2(R7 and R8), and the slow formation of N2O5(R4 and R5). During the night, N2O5 is in thermal equilibrium with NO2and NO3, and also reacts on liquid surfaces to form HNO3. During the day, the partitioning between NO, NO2 and N2O5depends strongly on SZA due to the rapid photol-ysis of NO2and the slower photolysis of N2O5. This depen-dency on SZA makes validation of NO2measurements diffi-cult, as measurements seldom coincide both in location and local time. In order to compare collocated solar occultation NO2measurements at 90◦SZA to NO2measurements from SCIAMACHY at various SZAs, a one-dimensional chemical and photolysis model of the stratosphere that extends from the tropopause up to the stratopause has been used.
The model chemistry is similar to the SLIMCAT chem-istry scheme. Reaction rates and absorption cross sections are taken from the JPL 2000 recommendation (Sander et al., 2000). The height of the model boxes can be adapted to fit the altitude resolution and tangent altitudes of either the occul-tation or SCIAMACHY measurement. The model includes
135 chemical reactions including gas-phase as well as het-erogeneous reactions, and 44 photolysis reactions of the 52 species most important for stratospheric chemistry, and runs with a chemical time-step of 5 min. Model output is every 15 min.
The one-dimensional model has been used to compare satellite measurements of NO2at different SZAs in the fol-lowing way. The model is initialised with the output of a global 2-D chemistry, transport and photochemistry model for the geolocation and day of the measurement. The 2-D model is a composite of the SLIMCAT chemistry scheme (Chipperfield, 1999) and the THIN AIR dynamics code (Kin-nersley, 1996), and is described in more detail in (Sinnhuber et al., 2003). The chemistry scheme of the one-dimensional model is derived from the chemistry scheme of the 2-D model, and considers exactly the same photochemical re-actions and species. The only difference is that the one-dimensional model does not use simplifications of the be-haviour of very short-lived species assuming photochemical equilibrium. O3is initialised based on measurements when-ever available. The model is run over a period of 3 days to allow for spin-up, and on the third day, NO2at sunset or sun-rise from the model is compared to the occultation measure-ment. Then, the NOxspecies – NO, NO2and N2O5– from the model are scaled to fit the validation measurement’s NO2 at sunset or sunrise. The model is run again for three days with the modified NOx.
The model result and SCIAMACHY measurement are compared at the SZA of the SCIAMACHY measurement. In the ideal case of two perfect instruments and a perfect pho-tochemical model, model and measurement would agree. In reality, not only do the measurements suffer from instrument noise and systematic measurement errors, but also the model is imperfect and has its own additional errors. The uncer-tainty on the ability of the model to account for the variation of NO2as a function of SZA needs to be assessed.
3.1 Sensitivity Study with the photochemical model O3plays a major role in the NOx partitioning, because O3 reacts with NO and NO2, and also impacts photolysis as a re-sult of its strong UV absorption. Other parameters that influ-ence the outcome of the comparison are temperature, which is important because of the temperature dependency of the reaction and photolysis rates, and also for the thermal de-composition of N2O5; the aerosol loading of the atmosphere, represented by the amount of H2SO4, is important for the hydrolysis of N2O5. Another factor that influences the out-come of the comparison is the variation of the SZA of the validation measurement along the instruments line-of-sight. By definition, the SZA of the occultation measurement is 90◦ at the tangent point, however, before the tangent point, the SZA is larger, after the tangent point, it is smaller than 90◦. As the variability of NO2is largest during sunset and sunrise, this affects the initialisation of NOxin the model.
The most obvious source of model uncertainities are inac-curacies in the knowledge of the photolysis frequencies for the photochemical reactions and the reaction rate coefficients used in the model. All reactions that are known to play a major role for stratospheric chemistry are included. The re-action rates, taken from the JPL 2000 recommendation, are based on measurements that themselves have measurement errors. The profiles of NO2 and O3 for the model are ini-tialised using the occultation measurement as described.
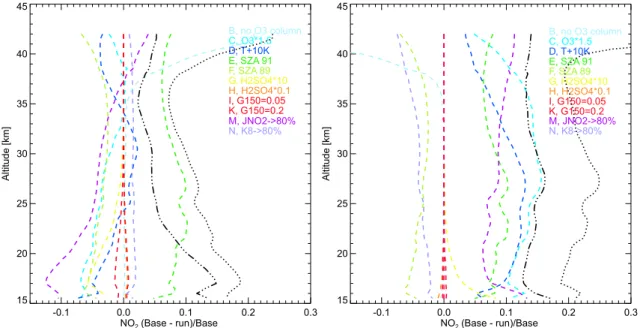
Sensitivity studies were carried out to investigate the im-pact of the model uncertainity on the measurement compar-ison exemplarily for one SCIAMACHY measurement of 23 August 2003 at 54.2◦S. This is compared to a SAGE II sun-set measurement of the same day at approximately the same location. For the sensitivity studies, model runs were car-ried out varying the parameters in question over a reasonable range, and comparing the model result to the model “base” run where all parameters have their “default” setting. Model altitudes are scaled to the SAGE NO2measurement, and ex-tend from 15.5 km to 42 km for this model run. The com-parison with the base run is carried out for the SZA of the SCIAMACHY measurement, 76.12◦, as well as for 120◦for
a night-time scenario. This later case is also of interest for example for the validation of MIPAS and GOMOS, which measure during nighttime. As the dominating processes dur-ing the night are not the same as durdur-ing daytime, results could be very different. The relative differences between “base” and each test model run are plotted in Fig. 1 for the day and night scenario, respectively.
3.1.1 Ozone
The default model run is initialised with an O3measurement of the SAGE instrument that was taken simultaneously with NO2. To take into account O3absorption above the altitude range of the model, an O3density of 7e16 cm−2is initialised above the model range, derived from the SAGE O3 measure-ment between 42 and 58 km. In one set of model runs, the O3 is scaled by a factor of 1.5. This is a rather conservative esti-mate for dynamic O3variability. It leads to about 5% larger NO2values below 30 km during daytime, and to about 13% smaller NO2values during night-time (Fig. 1). In another set of model runs, the O3column above the model altitudes is set to zero. This affects the NO2 amount mainly above 35 km; there, differences to the “base” run including the O3column are rather large: being up to 20%. During the day, reducing the O3column above the model altitudes leads to a decrease of NO2, whereas during the night, modelled NO2increases. 3.1.2 Temperature
In the default setting, temperature is initialised by the 2-D model output which calculates temperature itself. Temper-ature measurements would be preferable of course, but are not always available. For the sensitivity studies, temperature
was varied by 10 K compared to the “base” run. This appears a reasonable estimate for the deviations from a temperature climatology – the 2-D model output – to the true temper-ature, which is unknown. A 10 K increase in temperature decreases NO2slightly between about 35 and 25 km, and in-creases NO2 above and below (see Fig. 1). Again, during night-time, the differences to the “base” run are much larger than during day, reaching a 12% decrease between 20 and 25 km. During day-time, differences are much smaller, with maximal differences of about 5% reached at about 40 km alti-tude. This is due to the fact that during the night, the thermal equilibrium between N2O5and NO2plays a larger role. 3.1.3 Aerosol loading
The aerosol loading of the atmosphere determines the parti-tioning between NOx – NO, NO2, and N2O5 – and HNO3 through the hydrolysis of N2O5. As NOx is fixed in the model run, the aerosol loading should not play a large role in determining NO2. Two factors were varied to test this hypothesis: the amount of H2SO4, and the reaction rate of N2O5hydrolysis on liquid aerosols. The amount of H2SO4 was decreased and increased by a factor of 10. Decreas-ing H2SO4has no significant impact on NO2, while increas-ing H2SO4increases NO2slightly below 25 km during day-time; during nighttime, NO2is hardly affected (see Fig. 1). The gamma coefficient of N2O5uptake on liquid aerosols is varied by the maximum and minimum values, given in the JPL recommendations, 0.05 and 0.2 (the default value in the model is 0.1). Again, decreasing gamma does not change NO2significantly, while increasing gamma leads to slightly higher values below 25 km during daytime (Fig. 1). The fact that NO2seems rather insensitive to the aerosol reactions is probably due to the fact that the aerosol loading of the 2-D model is low, initialised by SAGE measurements from the year 1995. This is realistic for the current post-Pinatubo area, but the situation would be different in situations with higher aerosol loading, i.e. shortly after a large volcanic eruption depositing significant amounts of aerosol in the stratosphere. 3.1.4 Reactions important for NOxpartitioning
The impact of uncertainities in the reaction rates of the two reactions most important for the partitioning between NO and NO2, photolysis of NO2, (R7) and reaction of NO with O3, (R8) were investigated within the sensitivity study. For the NO2absorption cross section, an error of 5–10% is given in the JPL recommendation, while it is stated that “the agree-ment is poor below room temperature”, i.e. at stratospheric temperatures (DeMore et al., 1997). To reflect this, the NO2 photolysis rate was decreased by 20%. This leads to an in-crease in NO2of less than 5% between 35 and 25 km increas-ing to 12% below 20 km durincreas-ing the day. NO2levels during the night are strongly affected as well, decreasing by about 10% over the whole altitude range (Fig. 1). For reaction (R8),
-0.1 0.0 0.1 0.2 0.3 NO2(Base - run)/Base 15 20 25 30 35 40 45 Altitude [km] B, no O3 column C, O3*1.5 D, T+10K E, SZA 91 F, SZA 89 G, H2SO4*10 H, H2SO4*0.1 I, G150=0.05 K, G150=0.2 M, JNO2->80% N, K8->80% -0.1 0.0 0.1 0.2 0.3 NO2(Base - run)/Base 15 20 25 30 35 40 45 Altitude [km] B, no O3 column C, O3*1.5 D, T+10K E, SZA 91 F, SZA 89 G, H2SO4*10 H, H2SO4*0.1 I, G150=0.05 K, G150=0.2 M, JNO2->80% N, K8->80%
Fig. 1. Relative difference of “base” model run to the test model runs for a solar zenith angle (SZA) of 76,1◦corresponding to the SCIA-MACHY measurement (left), and for a SZA of 120◦(right). Black dashed line: total statistical uncertainity, black dash-dotted line: total uncertainity without the contribution of O3(B and C) and sza (E and F). The calculation of the individual uncertainity contributions and the
total uncertainity are described in Sect. 3.1.
no errors are given; for the sensitivity study, again an uncer-tainity of 20% is assumed, and the reaction rate of (R8) was decreased by 20%. This decreased NO2 by about 2% dur-ing the day, and increased NO2by 2 to 8% during the night (Fig. 1).
3.1.5 Solar zenith angle variations along line-of-sight The SZA of an occultation measurement is 90◦ at the tan-gent altitude. However, the SZA varies along the line-of-sight (LOS) of the instrument thus that it is larger before and smaller behind the tangent altitude. This means that the mea-surement of an occultation instrument is a superposition of different SZAs near 90◦. As NO2is highly variable during sunset and sunrise, even a small uncertainty in the SZA of the occultation measurement can lead to large errors in the initialisation of the model NOx. A simple geometric con-sideration shows that along the LOS, already one kilometer away from the tangent point the SZA has changed by nearly 1◦, positive before, and negative after the tangent point. If NO2 changed linearly with the SZA, these changes would cancel each other out. However, this is not the case, and the variation of the SZA along the LOS of an occultation instru-ment does influence the retrieved density especially below 20 km (Newchurch et al., 1996). It is possible to correct for this variation during the NO2retrieval as it is done for the HALOE retrieval (see Gordley et al., 1996), but this carries its own sources of additional errors, and is not done for all oc-cultation measurements (Randall et al., 2002). For the sensi-tivity study, the SZA of the validation measurement is varied
by 1◦. This leads to differences in modelled NO2of up to 10% (Fig. 1). This is probably a rather conservative estimate of the possible model uncertainity arising from the variation of the solar zenith angle along the line-of-sight of the occul-tation measurement, but still this is one of the largest source of model uncertainities. Variations along the LOS of the EN-VISAT limb measurement do not play a similar large role, as the variability of NO2is by far larger during sunrise and sunset.
3.1.6 Model drift
Every model drifts, meaning that trace gas concentrations differ slightly from day to day even if all other parameters – temperature, pressure, SZA variations – are completely the same. One reason for this is numerical drift, but the more im-portant fact is that the atmosphere itself is not an equilibrium system. Model drift can not be avoided, but has to be con-sidered for the overall model uncertainity. Here, model drift for NO2is determined by comparing to the occultation mea-surement: NO2in the model is initialised to agree with the occultation measurement during sunrise or sunset. If there was no model drift, after three days of model run, model NO2 during sunrise or sunset would therefore agree perfectly with the occultation measurement. In fact, between 25 and 40 km, they agree within 2%, but above and below, the model drift of NO2can reach up to 10% (Fig. 2).
-0.20 -0.10 0.00 0.10 0.20 20 25 30 35 40 45 Altitude [km]
(SAGE - SCIAMACHY) / SAGE
Fig. 2. Relative difference of model at 90◦to the SAGE measure-ment, as an indicator of the model drift.
3.1.7 Total model uncertainity
From the different uncertainity sources considered in the sensitivity studies, a total uncertainity of the model calcu-lation is estimated. As the different uncertainities are not correlated, the uncertainity is calculated statistically, as the root mean square of the individual uncertainity contributions. The total uncertainity is also shown in Fig. 1 (black dotted line). During the day, it reaches maximum values of 19% be-low 20 km, decreasing to about 8% between 35 and 40 km. Above 40 km, it rises sharply to values larger than 20%. The largest contributions to the overall uncertainity during the day are the SZA variations of the occultation measurement, the NO2photolysis rate, and the O3profile; above 40 km, the O3column density above the model top altitude dominates, while below 20 km, H2SO4plays a role as well. During the night, the overall uncertainity is about 20% between 15 and 40 km, rising sharply to over 30% above 40 km. During the night, the uncertainity again is dominated by the O3profile, and the SZA variation of the occultation measurement and NO2photolysis play a large role as well. NO2photolysis is probably important as it defines NO2 during sunset, at the beginning of the night. But the second largest uncertainity source during the night is temperature, and the reaction of NO and O3plays a role as well. The overall uncertainity is nearly double as large than during the day in the 20 to 40 km range, mainly because the contributions of O3and tempera-ture are so much larger. It concludes that, as the additional model uncertainity is so much larger, validation of night-time measurements with occultation measurements are more
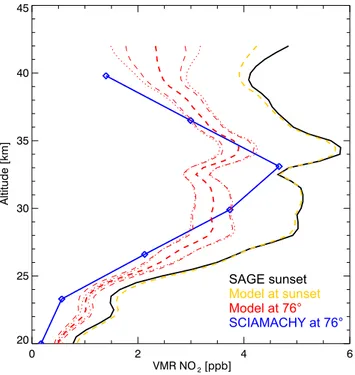
dif-Fig. 3. Comparison of SAGE (black) and SCIAMACHY (blue)
measurements of 23 August 2003 at 54.2◦S, and model results for the same day and at SAGE and SCIAMACHY solar zenith angles (red and yellow). Red dotted line describes the total uncertainity of the model, red dashed line the total uncertainity including model drift.
ficult than validation of day-time measurements. However, two of the larger uncertainity sources, due to O3and due to temperature, can be avoided by using measurements for the initialisation of the model. Variations in O3 result in sim-ilarly large uncertainities, but those were easily avoided in our validation as simultaneous retrievals of O3were readily available from HALOE and SAGE II, but are also available for SCIAMACHY and the two other atmospheric ENVISAT instruments, MIPAS and GOMOS. Taking O3from the oc-cultation measurement and correcting for the variability of the SZA along the LOS of the occultation measurement as it has been done for the validation of SCIAMACHY profiles with HALOE decreases the model uncertainity to less than 5% between 20 and 40 km during the day, and to about 14% during the night (see Fig. 1, dash-dotted black line).
Finally, the comparison of the SAGE and SCIAMACHY measurements of 23 August 2002 is shown in Fig. 3. Also shown are the model results for sunset and the SZA of the SCIAMACHY measurement, as well as the total model un-certainity. The model uncertainity due to model drift is shown separately; it appears that it plays a role only above 40 km. While the agreement between the SCIAMACHY measurement and the model result at the SCIAMACHY SZA is much better than the agreement between SCIAMACHY and SAGE, the overall agreement is still not very good in
0 1•1014 2•1014 3•1014 4•1014 5•1014 NO2 [km−1*cm−2] 10 20 30 40 50 Altitude [km] HALOE at SS Model at 37.9o Model at 90 o SCIAMACHY at 37.9o 16/09/2002
16/09/2002 SCIA(−16.7/ 20.1) and HALOE(−17.5/ 22.7)
0 1•1014 2•1014 3•1014 4•1014 5•1014 NO2 [km−1*cm−2] 10 20 30 40 50 Altitude [km] HALOE at SR Model at 49.5o Model at 90 o SCIAMACHY at 49.5o 22/09/2002
22/09/2002 SCIA( 46.4/−115.4) and HALOE( 48.6/−115.0)
0 1•1014 2•1014 3•1014 4•1014 5•1014 NO2 [km−1*cm−2] 10 20 30 40 50 Altitude [km] HALOE at SS Model at 50.2o Model at 90 o SCIAMACHY at 50.2o 24/07/2002
24/07/2002 SCIA( 69.4/ 33.0) and HALOE( 68.7/ 24.4)
0 1•1014 2•1014 3•1014 4•1014 5•1014 NO2 [km−1*cm−2] 10 20 30 40 50 Altitude [km] HALOE at SR Model at 62.5o Model at 90 o SCIAMACHY at 62.5o 14/10/2002
14/10/2002 SCIA(−60.7/ −28.5) and HALOE(−63.2/ −29.7)
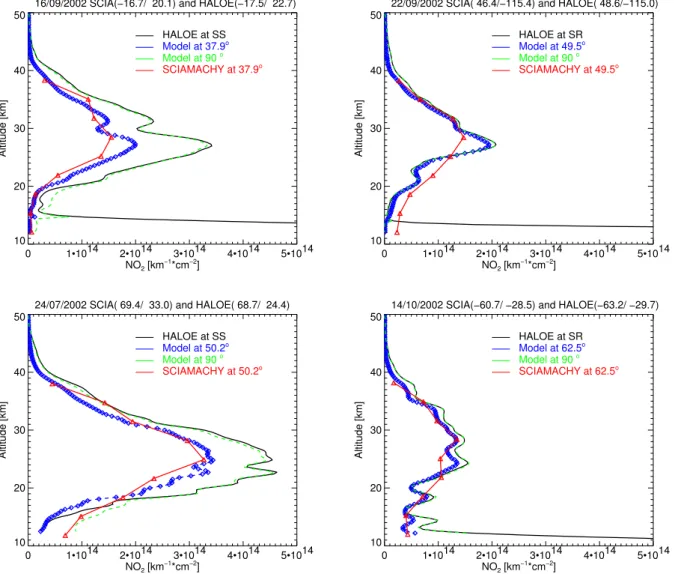
Fig. 4. Comparisons of NO2 profiles from collocated HALOE (black) and SCIAMACHY (red) measurements with results from model
runs described in Sect. 3: the model at 90◦(green) signifies where the model was scaled in such a way that NO2values correspond to the
HALOE NO2measurement at the HALOE SZA of 90◦in dependence when the measurement was taken (during sunrise or sunset). Taking the model at 90◦NO2values and running them to the certain solar zenith of the SCIAMACHY measurement, gives the modelled NO2
profile at SCIAMACHY solar zenith angle (model at SCIAMACHY SZA in blue). Examples from: the tropics at ∼38◦SCIAMACHY SZA and HALOE sunset (SS) measurement at 16 September 2002 (top left), from the mid latitudes at ∼50◦SCIAMACHY SZA and HALOE sunrise (SR) measurement at 22 September 2002 (top right), from the high northern latitudes at ∼50◦SCIAMACHY SZA and HALOE SS measurement at 24 September 2002 (bottom left), and from the high southern latitudes at 62.5◦SCIAMACHY SZA and HALOE SR measurement at 14 September 2002 (bottom right).
this case: below 28 km and above 37 km, SCIAMACHY is significantly lower than the modified SAGE measurement, while at 33 km, SCIAMACHY is significantly higher than the modified SAGE.
4 Validation of SCIAMACHY NO2profiles
Overall, 52 collocated SCIAMACHY-IUP and HALOE, and 60 collocated SCIAMACHY-IUP and SAGE II NO2 mea-surements have been identified. These collocated
measure-ments were investigated in two sets, determined by the SCIA-MACHY level 0 data availability:
i) 24 July 2002, and,
ii) from 12 September 2002 to 14 October 2002.
While the matches between SCIAMACHY and HALOE were distributed globally, the majority of collocations were at high and mid latitudes between 45◦to 69◦: 31 in the north-ern and 9 in the southnorth-ern hemisphere. The matches between SCIAMACHY and SAGE II were all in high latitudes above
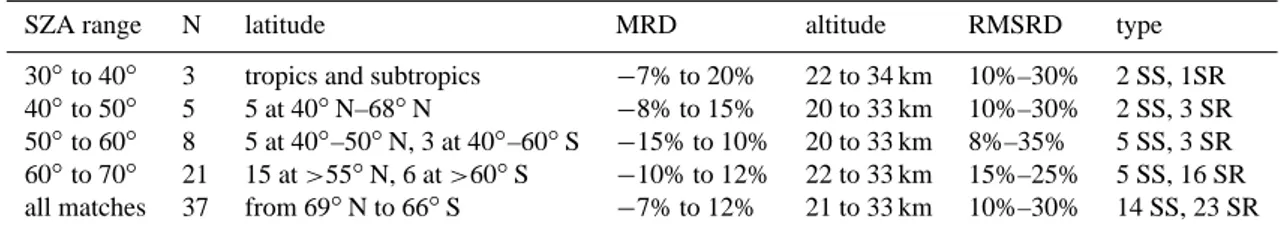
Table 1. Statistical results of the comparison of SCIAMACHY NO2profiles at a certain solar zenith angle (SZA) to HALOE NO2profiles
measured during sunset (SS) or sunrise (SR) and scaled with the in Sect. 3 described model to the SCIAMACHY SZA. Statistical results are given for different SCIAMACHY SZA ranges and only matches within the same air mass are included: number of collocations within the SZA range (N), latitudinal range (latitude), HALOE occultation type (type), mean relative deviation (MRD), the altitude range for which MRD is given (altitude) and the root mean square of the MRD at these altitudes (RMSRD).
SZA range N latitude MRD altitude RMSRD type
30◦to 40◦ 3 tropics and subtropics −7% to 20% 22 to 34 km 10%–30% 2 SS, 1SR 40◦to 50◦ 5 5 at 40◦N–68◦N −8% to 15% 20 to 33 km 10%–30% 2 SS, 3 SR 50◦to 60◦ 8 5 at 40◦–50◦N, 3 at 40◦–60◦S −15% to 10% 20 to 33 km 8%–35% 5 SS, 3 SR 60◦to 70◦ 21 15 at >55◦N, 6 at >60◦S −10% to 12% 22 to 33 km 15%–25% 5 SS, 16 SR all matches 37 from 69◦N to 66◦S −7% to 12% 21 to 33 km 10%–30% 14 SS, 23 SR
60◦: 36 in the northern and 24 in the southern hemisphere. The NO2satellite validation was chosen to lie within the time of the ozone hole. In this particular year, a major warming event occurred over the Antarctic region, probably the first ever recorded in the southern hemisphere (e.g. Weber et al., 2003). It was therefore essential for the validation to identify homogeneous air masses.
For the SCIAMACHY and HALOE comparison and after applying the criteria of homogeneity explained in Sect. 2.5, 37 data sets remained. For the excluded matches, for twelve cases, the tropopause height varied strongly within the SCIA-MACHY scene, compared to that of the HALOE measure-ment. In three cases matches from high southern latitudes were excluded because the measurements were taken across the edge of the polar vortex. Only one match was found where both measurements were completely within the polar vortex (see Fig. 4 bottom right). Table 1 shows the distri-butions of the SCIAMACHY and HALOE collocations in different latitudinal zones, ranges of SCIAMACHY SZAs and type of HALOE measurement. The majority of matches are in the high northern latitudes and at SCIAMACHY SZA above 60◦, and HALOE NO2values above 60◦latitude were determined from sunrise solar occultations. For the SCIA-MACHY and SAGE II comparison, only 25 collocation pairs of measurements were identified as being from the same air mass. All matches from the high southern latitudes lie in ar-eas of highly variable PV across the edge of the polar vortex. From the Northern hemisphere, 11 matches were excluded because of large differences in the tropopause height. The 25 matches included in the NO2comparison were all measured between the 12 September 2002 and the 9 October, 2002. 4.1 Examples of NO2 profile comparisons from satellite
data
Figure 4 presents four examples of the comparison of HALOE and SCIAMACHY NO2profiles from different lati-tudes (tropics, mid and high latilati-tudes) and at different SCIA-MACHY SZA (around 40◦, 50◦, 60◦). Also shown are re-sults of model calculations, which account for the difference
in SZA of the two instruments and therefore the NO2profile. This is achieved by converting the HALOE profiles to that expected for of the SCIAMACHY SZAs. The method uses a photochemical model initiated with the HALOE profile, as described in Sect. 3. Two types of modelled NO2profiles are shown. The “model at 90◦” indicates where the model NOx was scaled in such a way that NO2values correspond to the HALOE NO2measurement, during sunset or sunrise. Com-paring the model results at 90◦to the HALOE (or SAGE II) measurement illustrates the potential of the model to be ap-plied for scaling NOxto make measurements taken at differ-ent SZAs, comparable.
In all comparisons, the NO2 value from the model at 90◦ and the HALOE (seen in Fig. 4) or SAGE II (results not shown) measurement corresponded well above 20 km. Overall, above 20 km the SCIAMACHY NO2values agree well with the HALOE measurement scaled to the SCIA-MACHY SZA. Below 20 km the SCIASCIA-MACHY NO2 val-ues are much larger than the HALOE measurement scaled to SCIAMACHY SZA for two examples shown (Fig. 4, top right and bottom left), while at the comparison within the po-lar vortex (Fig. 4, bottom right) and the tropics (Fig. 4, top left) the SCIAMACHY and the scaled HALOE measurement agree well even down to 12 km. Due to the coarser vertical resolution of SCIAMACHY, detailed structures like the dou-ble peak in the example in the tropics (Fig. 4, top left) are not resolved, and in the example from the mid-latitudes at around 50◦SZA (Fig. 4, top right) this leads to an underestimation of the NO2maximum.
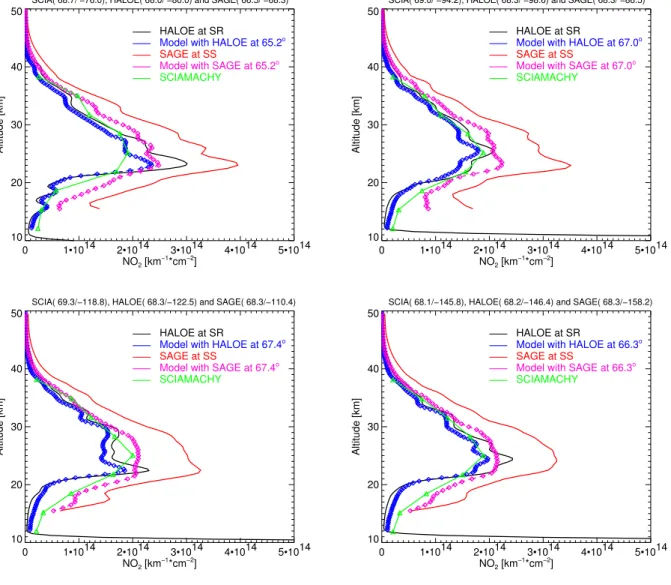
Figure 5 shows four examples of the comparison of SAGE II and SCIAMACHY NO2profiles in the high northern lat-itudes at mid September where also collocations of SCIA-MACHY with HALOE had been identified. Model values for the SCIAMACHY SZA with the input of the HALOE or SAGE NO2 values are given in addition to the SCIA-MACHY, SAGE and HALOE NO2 measurements. The SCIAMACHY SZA of the example shown here varies from 65◦to 67.5◦. Since HALOE measurements were taken dur-ing sunrise and SAGE II measurements durdur-ing sunset, these
0 1•1014 2•1014 3•1014 4•1014 5•1014 NO2 [km−1*cm−2] 10 20 30 40 50 Altitude [km] HALOE at SR
Model with HALOE at 65.2o SAGE at SS
Model with SAGE at 65.2o
SCIAMACHY
20020912
SCIA( 68.7/ −76.0), HALOE( 68.0/ −80.0) and SAGE( 66.5/ −68.3)
0 1•1014 2•1014 3•1014 4•1014 5•1014 NO2 [km−1*cm−2] 10 20 30 40 50 Altitude [km] HALOE at SR
Model with HALOE at 67.0o SAGE at SS
Model with SAGE at 67.0o
SCIAMACHY
20020916
SCIA( 69.0/ −94.2), HALOE( 68.3/ −98.6) and SAGE( 68.3/ −86.5)
0 1•1014 2•1014 3•1014 4•1014 5•1014 NO2 [km−1*cm−2] 10 20 30 40 50 Altitude [km] HALOE at SR
Model with HALOE at 67.4o SAGE at SS
Model with SAGE at 67.4o
SCIAMACHY
20020916
SCIA( 69.3/−118.8), HALOE( 68.3/−122.5) and SAGE( 68.3/−110.4)
0 1•1014 2•1014 3•1014 4•1014 5•1014 NO2 [km−1*cm−2] 10 20 30 40 50 Altitude [km] HALOE at SR
Model with HALOE at 66.3o SAGE at SS
Model with SAGE at 66.3o
SCIAMACHY
20020916
SCIA( 68.1/−145.8), HALOE( 68.2/−146.4) and SAGE( 68.3/−158.2)
Fig. 5. Comparisons of NO2profiles from collocated HALOE (black), SAGE (red) and SCIAMACHY (green) measurements with results
from model runs described in Sect. 3. All HALOE measurements were taken during sunrise (SR) and all SAGE measurements during sunset (SS). The model with HALOE at SCIAMACHY SZA (blue) signifies where the model was scaled in such a way that NO2values correspond
to the HALOE measurement at the HALOE SZA of 90◦during sunrise and then scaled to the SZA of the SCIAMACHY measurement by using a 1-dim model. In accordance to that, the model with SAGE at SCIAMACHY SZA (pink) was detemined using the SAGE NO2
measurement as an input for the model value at SAGE SZA of 90◦during sunset and scaling this model value by using a 1-dim model scaled to the SZA of the SCIAMACHY measurement. Examples are either from 12 (top left) or from 16 September 2002 (other three examples).
measurements cannot be directly compared, but rather the scaled values determined by combining the data products with the photochemical model are compared. In all ex-amples, SAGE II NO2 values scaled to the SCIAMACHY SZA are significantly higher than NO2 profiles of SCIA-MACHY, and also higher than HALOE measurements scaled to SCIAMACHY SZA. SCIAMACHY NO2 profiles show good agreement with the scaled HALOE profiles above 20 km. Despite the coarser vertical resolution of SCIA-MACHY in two comparisons (Fig. 5, top and bottom left), the SCIAMACHY retrieval resolves the profile structure,
which is comparable to that in the scaled HALOE profile. However, the SCIAMACHY NO2maximum in one compar-ison is lower than that of the scaled HALOE profile (Fig. 5, top left). In Fig. 5 (bottom left) SCIAMACHY measured higher values at the peak than HALOE data, being closer to the scaled SAGE II values and reflecting the SAGE II scaled profile structure. Below 20 km, SCIAMACHY NO2 values are close to scaled HALOE values in one comparison (Fig. 5, top left), and close to the scaled SAGE II NO2values in two comparisons (Fig. 5, bottom left and right), and in between the two in one comparison (Fig. 5, top right).
4.2 Statistical analysis of collocated measurements The NO2 profiles retrieved from the SCIAMACHY surement and those from the HALOE and SAGE II mea-surements scaled to the SCIAMACHY SZA (Model occul) were interpolated from the ground to an altitude of 50 km at an 1 km-interval. This facilitates the statistical analysis of the collocated data products, having different vertical reso-lutions. The dataset of all coincident measurements was di-vided into subsets of SZA ranges: <40◦, 40◦to 50◦, 50◦to 60◦, >60◦. For each collocation pair the relative deviation, RD, between SCIAMACHY and the HALOE or SAGE mea-surement scaled to the SCIAMACHY SZA (Model occul) NO2concentration was determined at each altitude level (h) using Eq. (1):
RD(h) =SCI AMACH Y [NO2]h−Model occul[NO2]h Model occul[NO2]h
(1) For each subset at each altitude level the mean relative devi-ation (MRD) and root mean square (RMSRD) of the relative deviations between all SCIAMACHY and HALOE measure-ments scaled to the SCIAMACHY SZA, and SCIAMACHY and SAGE II measurements scaled to the SCIAMACHY SZA were determined. In addition, mean profiles and stan-dard deviations of the profiles for both instruments were cal-culated for each subset.
Statistical results of the NO2 comparisons from SCIA-MACHY with scaled HALOE measurements for the differ-ent subsets in dependence to the SCIAMACHY SZA show a MRD between 22 km and 33 km varying from −10 to +12% at SZAs larger than 60◦and from −7 to +20% at the SZA
range 50◦to 60◦(Table 1). The RMSRD ranges from 8% to
35% at the SZA between 50◦to 60◦and from 15% to 25% at SZAs larger than 60◦. For the subsets of SCIAMACHY SZA from 40◦to 50◦ and 50◦ to 60◦, good agreement be-tween the HALOE and SCIAMACHY data products extends down to 20 km. Lowest values of MRD of SCIAMACHY to the scaled HALOE measurements are found around 22 km. From this altitude MRDs continuously increase with increas-ing altitude. Agreement is best at SZA >60◦where probably also the largest number of collocations yields a more con-sistent and meaningful statistical result. For all collocations SCIAMACHY’s MRD to the scaled HALOE NO2 measure-ments varies from −7% to +12% with a RMSRD of 10% to 30% between 21 and 33 km.
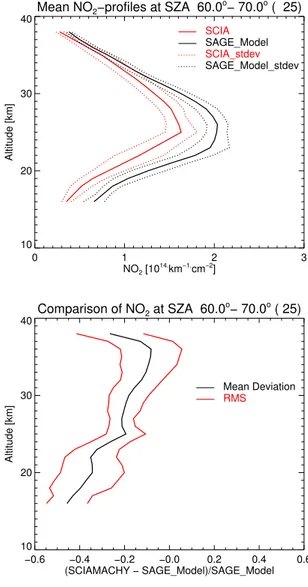
Figure 6 shows the statistical results of the NO2 com-parisons of data products from SCIAMACHY, HALOE and SAGE II in the high northern latitudes at SZA above 60◦.
The SCIAMACHY mean profiles are lower at the peak but higher at the upper and lower end of the profile in compar-ison to scaled HALOE NO2mean values (Fig. 6, top left); between 18 km and 33 km differences between the two are within the standard deviation of the mean profiles. The MRDs vary between 21 km and 34 km between ±13% with a standard deviation of 15 to 30% (Fig. 6, bottom left). In
contrast, as seen before in the single comparisons, the SCIA-MACHY mean profile is systematically lower between 15 and 32 km than the mean of the scaled SAGE II profiles (Fig. 6, top right); between 20 km and 38 km SCIAMACHY shows a negative bias of 10 to 35% with a rather low RM-SRD of 5 to 14% in comparison to the scaled SAGE II val-ues (Fig. 6, bottom right). The negative bias increases sys-tematically from 35 km with decreasing altitude. The low RMSRD of SCIAMACHY NO2values compared to scaled SAGE values may result from the homogenous sample of matches. These were all from a two weeks time period in September, from high northern latitudes, at SCIAMACHY SZA between 60◦ and 70◦, and the SAGE NO2 measure-ments taken during sunset.
5 Conclusions
The objective of this study is to validate the NO2 profiles retrieved from SCIAMACHY (SCIAMACHY-IUP NO2 pro-files V1) by comparison with those retrieved from the mea-surement of the occultation instruments HALOE and SAGE II. As the measurements are taken at different SZA, and NO2 has a significant diurnal variation, comparison of the collo-cated measurements, without accounting for the diurnal vari-ation of NO2, is of limited value. We take the following ap-proach:
1. the identification of collocation measurements,
2. the calculation of the amount of NO2 expected at the SZA of SCIAMACHY, based on that determined from the occultation measurement,
3. comparison of the profiles at the same SZA.
The calculation used a photochemical model, initialised with the occultation NO2and O3data products and accounting for the photolysis and chemistry of NO2.
A sensitivity analysis of the 1D-photochemcial model, used in the study, indicates that the approach taken in this study appears to be an effective and reliable way to com-pare collocated NO2measurements at different SZA between 20 km and 40 km altitude and for day-time measurements. The largest contributions to the overall uncertainity of the model are the O3 profile, knowledge and variation of the SZA along the LOS of the occultation measurement, and the NO2 photolysis rate. Initialising the model with the O3 profile from the occultation measurement rather than using climatological values, not surprisingly, minimises the un-certainty on the knowledge of the calculated NO2 profile at the SCIAMACHY SZA. This was done in our valida-tion of SCIAMACHY NO2profiles with HALOE and SAGE II measurements and for the comparisons with HALOE the retrieval of NO2 profiles was corrected for SZA variations
Mean NO2−profiles at SZA 60.0o− 70.0o ( 16) 0 1 2 3 NO2 [1014.km−1.cm−2] 10 20 30 40 Altitude [km] SCIA HALOE_Model SCIA_stdev HALOE_Model_stdev
Mean NO2−profiles at SZA 60.0o− 70.0o ( 25)
0 1 2 3 NO2 [1014.km−1.cm−2] 10 20 30 40 Altitude [km] SCIA SAGE_Model SCIA_stdev SAGE_Model_stdev Comparison of NO2 at SZA 60.0o− 70.0o ( 16) −0.6 −0.4 −0.2 −0.0 0.2 0.4 0.6 (SCIAMACHY − HALOE_Model)/HALOE_Model 10 20 30 40 Altitude [km] Mean Deviation RMS Comparison of NO2 at SZA 60.0o− 70.0o ( 25) −0.6 −0.4 −0.2 −0.0 0.2 0.4 0.6 (SCIAMACHY − SAGE_Model)/SAGE_Model 10 20 30 40 Altitude [km] Mean Deviation RMS
Fig. 6. Statistical results of the comparisons of NO2profiles from collocated HALOE and SCIAMACHY (top and bottom left) and SAGE
and SCIAMACHY (top and bottom right) at the high northern latitudes (55◦N to 69◦N) at SCIAMACHY SZA between 60◦and 70◦. All SAGE measurements were taken during sunset. Five HALOE measurements were taken during sunset and eleven during sunrise. At the top the mean NO2profiles (straight line) and their standard deviation (dotted line) of all SCIAMACHY measurements (red) and the HALOE
measurement scaled by the model described in Sect. 3 to the SCIAMACHY SZA (HALOE Model, black) is shown on the left side, the same for the SCIAMACHY (black) and SAGE (SAGE Model, red) comparison on the right. The bottom graphs show the mean relative deviation (Mean Deviation, black) and the root mean square of the mean relative deviation (RMS) of all comparisons of NO2values from SCIAMACHY to HALOE Model (left) and to SAGE Model (right) at the respective altitude.
along the LOS. Applying both criteria, the model uncertain-ity decreases at 20 to 40 km from between 8 and 14% to a value of less than 5%.
The analysis of the model further showed that during the night, besides the O3profile and the SZA along the LOS of the occultation measurement, the temperature plays a large role in determining the NO2profile. The overall uncertainity is much larger with about 20% between 15 km and 40 km, rising sharply to over 30% above 40 km, but can be reduced to less than 14% when the O3profiles are taken from the oc-cultation measurements and retrieval of NO2profiles is
cor-rected for SZA variations along the LOS. Thus the valida-tion of night-time measurements, from GOMOS stellar oc-cultation, MIPAS limb and SCIAMACHY lunar occultation measurements, with occultation measurements has an intrin-sically lower accuracy than that for day-time measurements, unless measurements are made simultaneously.
The validation results presented in this study show a good agreement (within ±12%) between SCIAMACHY and HALOE NO2profiles from July to October 2002 in the al-titude range between 22 and 33 km. The rather large RM-SRD up to 30% of SCIAMACHY to HALOE are attributed
to the heterogeneous sample of collocations, covering the latitudes from 69◦N to 65◦S and SCIAMACHY SZA from
35◦to 69◦. The comparison of all SCIAMACHY and SAGE
II collocated NO2profiles show a systematic negative offset between 20 km and 38 km between 10% and 35%, decreas-ing with increasdecreas-ing altitude. As a result of the homogenous sample for the statistical analysis where all collocations are from the same region at the same SCIAMACHY SZA, the RMSRD of this offset is quite small (<15%). This negative offset is attributed to the SAGE II v6.2 NO2 values being too high, because in the comparison of collocated SCIA-MACHY, HALOE, and SAGE II NO2 measurements, the scaled SAGE II measurement are high and larger than for the scaled HALOE measurement at all altitudes. This conclusion is supported by the study of Newchurch and Ayoub (2004), where SAGE II sunset NO2data product from data version 6.0 showed higher values compared to the former versions of SAGE II, v5.931 and v5.96, ATMOS v3.1 and HALOE v19. In summary, this study has provided a validation of the SCIAMACHY IUP NO2 profiles V1 by comparison with SAGE II and HALOE measurements. This retrieval uses the SCIAMACHY limb measurements of radiation scattered by the atmosphere in the spectral range 420–455 nm. Overall it indicates that SCIAMACHY limb measurements yield sig-nificant valuable information during the day about NO2in the stratosphere. The accuracy is already such that the data are useful for scientific studies. As the knowledge of the instru-mental effects and biases improves, and/or by using a larger spectral window, it is expected that the accuracy of the data will somewhat improve.
Acknowledgements. We would like to thank ESA/ESRIN for
providing SCIAMACHY level-0 spectral data. We thank the HALOE group (at Hampton University, especially J. M. Russell III, and at NASA LaRC, especially E. Thompson), and the SAGE II group (at NASA LaRC, especially L. Thomason, and the NASA Langley Radiation and Aerosols Branch) for providing us with data from these instruments and information about data and instruments. The SCIAMACHY data shown here were calculated on the HLRN (High-Performance Computer Center North). Services and support are gratefully acknowledged. This work is funded in part by the DLR-Bonn (contract No. 50 EE0025) and the BMBF (FKZ 01 SF9994).
Edited by: U. Platt
References
Abrams, M. C., Chang, A. Y., Gunson, M. R., Abbas, M. M., Gold-man, A., Irion, F. W., Michelsen, H. A., Newchurch, M. J., Rins-land, C. P., Stiller, G. P., and Zander, R.: On the assessment and uncertainty of atmospheric trace gas burden measurements with high resolution infrared solar occultation spectra from space by the ATMOS experiment, Geophys. Res. Lett., 23, 2337–2340, 1996.
Bacmeister, J. T., Kuell, V., Offermann, D., Riese, M., and Elkins, J. W.: Intercomparison of satellite and aircraft observations of
ozone, CFC-11, and NOyusing trajectory mapping, J. Geophys.
Res., 104, D13, 16 379–16 390, 1999.
Bovensmann, H., Burrows, J. P., Buchwitz, M., Frerick, J., No¨el, S., Rozanov, V. V., Chance, K. V., and Goede, A. H. P.: SCIA-MACHY – Mission Objectives and Measurement Modes, J. At-mos Sci., 56, 125–150, 1999.
Bertaux, J. L., Megie, G., Widemann, T., Chassefiere, E., Pelli-nen, R., Korylla, E., Korpela, S., and Simon, P.: Monitoring of Ozone Trend by Stellar Occultations: The Gomos Instrument, Adv. Space Res., 11, 237–242, 1991.
Bracher, A., Weber, M., Bramstedt, K., and Burrows, J. P.: Long-term global measurements of ozone profiles by GOME validated with SAGE II considering atmospheric dynamics, J. Geophys. Res., 109, D20308, doi:10.1029/2004JD004677, 2004.
Brasseur, G. and Solomon, S.: Aeronomy of the Middle Atmo-sphere, Atmos. Sci. Lib., D. Reidel, Norwell, Mass., 1986. Chipperfield, M.: Multiannual Simulations with a
three-dimensional Chemical Transport Model, J. Geophys. Res., 104, 1781–2805, 1999.
Chu, W. P. and McCormick M. P.: SAGE Observations of Strato-spheric Nitrogen Dioxide, J. Geophys. Res., 91, 5465–5476, 1986.
Cunnold, D. M., Zawodny, J. M., Chu, W. P., Pommereau, J. P., Goutail, F., Lenoble, J., McCormick, M. P., Veiga, R. E., Mur-cray, D., Iwagami, N., Shibasaki, K., Simon, P. C., and Peeter-mans, W.: Validation Of SAGE II NO2Measurements, J. Geo-phys. Res., 96, 12 913–12 925, 1991.
Danilin, M. Y., Ko, M. K. W., Bevilacqua, R. M., Lyjak, L. V., Froidevaux L., Santee, M. L., Zawodny, J. M., Hoppel, K. W., Richard, E. C., Spackman, J. R., Weinstock, E. M., Herman, R. L., McKinney, K. A., Wennberg, P. O., Eisele, F. L., Stimpfle, R. M., Scott, C. J., Elkins, J. W., and Bui, T. V.: Comparison of ER-2 Aircraft and POAM-III, MLS, and SAGE-II satellite mea-surements during SOLVE using traditional correlative analysis and trajectory hunting technique, J. Geophys. Res., 107, 8315, doi:101029/2002JD000781, 2002.
DeMoore, W. B., Sander, S. P., Golden, D. M., Hampson, R. F., Kurylo, M. J., Howard, C. J., Ravishankara, A. R., Kolb, C. E., and Molina, M. J.: Chemical kinetics and photochemical data for use in stratospheric modelling, Evaluation Number 12, JPL Publication 97-4, Jet Propulsion Laboratory, California Institute of Technology, Pasadena, CA, 1997.
Eichmann, K.-U., Kaiser, J. W., von Savigny, C., Rozanov, A., Rozanov, V. V., Bovensmann, H., Sinnhuber, M., and Burrows, J. P.: The SCIAMACHY limb measurements in the UV/VIS spec-tral region: first results, Adv. Space Res., 34, 775–779, 2004. Glaccum, W., Lucke, R., Bevilacqua, R. M., Shettle, E. P., et al.:
The Second Polar Ozone and Aerosol Measurement (POAM II) Instrument, J. Geophys. Res., 101, 14 479–14 487, 1996. Gordley, L. L., Russell III, J. M., Mickley, L. J., Frederick, J. E.,
Park, J. H., Stone, K. A., Beaver, G. M., McInerney, J. M., Deaver, L. E., Toon, G. C., Murcray, F. J., Blatherwick, R. D., Gunson, M. R., Abbatt, J. P. D., Mauldin III, R. L., Mount, G. H., Sen, B., and Blavier, J. F.: Validation of nitric oxide and ni-trogen dioxide measurements made by the Halogen Occultation Experiment for UARS plaform, J. Geophys. Res., 101, 10 241– 10 266, 1996.
Harder, H., B¨osch, H., Camy-Peyret, C., Chipperfield, M. P., Fitzen-berger, R., Payan, S., Perner, D., Platt, U., Sinnhuber, B.-M., and
Pfeilsticker, K.: Comparison of measured and modeled strato-spheric BrO: Implications for the total amount of bromine, Geo-phys. Res. Lett., 27, 3695–3698, 2000.
Hoerling, M. P., Schaak, T. K., and Lenzen, A. J.: Global objective tropopause analyses, Mon. Weather Rev., 119, 1816–1831, 1991. Kinnersley, J. S.: The meteorology of the stratospheric “THIN AIR”
model, Q. J. R. Meteorol. Soc., 122, 219–252, 1996.
Lu, C.-H., Yue, G. K., Manney, G. L., J¨ager, H., and Mohen, V. A.: Langrangian approach for Stratospheric Aerosol and Gas Experi-ment (SAGE) II profile intercomparisons, J. Geophys. Res., 105, 4563–4572, 2000.
Lucke, R. L., Korwan, D., Bevilacqua, R. M., Hornstein, J. S., Shet-tle, E. P., Chen, D. T. Daehler, M., Lumpe, J. D., Fromm, M. D., Debrestian, D., Neff, B., Squire, M., K¨onig-Langlo, G., and Davies, J.: The Polar Ozone and Aerosol Measurement (POAM III) Instrument and Early Validation Results, J. Geophys. Res., 104, 18 785–18 799, 1999.
Marchand, M., Bekki, S., Denis, L., Pommereau, J.-P., and Khattatov, B. V.: Test of the night-time polar strato-spheric NO2decay using wintertime SAOZ measurements and
chemical data assimilation, Geophys. Res. Lett., 30, 1920, doi:10.1029/2003GL017582, 2003.
Marchand, M., Bekki, S., Hauchecorne, A., and Bertaux, J.-L.: Val-idation of the self-consistency of GOMOS NO3, NO2 and O3 data using chemical data assimilation, Geophys. Res. Lett., 31, L10107, doi:10.1029/2004GL019631, 2004.
Mauldin, L. E., Zaun, N. H., McCormick, M. P., Guy, J. J., and Vaughn, W. R.: Stratospheric Aerosol and Gas Experiment II Instrument: A Functional Description, Opt. Eng., 24, 307–312, 1985.
Nasa Langley Research Center: SAGE III – The Stratospheric Aerosol and Gas Experiment III, SAGE III instrument, http: //www-sage3.larc.nasa.gov/instrument/, 2004.
Nakajima, H., Sugita, T., Yokota, T., and Sasano, Y.: Current status and early result of the ILAS-II onboard the ADEOS-II satellite, Proceedings of SPIE, Vol. 5234, edited by: Meynart, R., Neeck, S. P., Shimoda, H., Lurie, J. B., and Aten, M. L., pp. 36–45, 2004.
Newchurch, M. J., Allen, M., Gunson, M. R., Salawitch, R. J., Collins, G. B., Huston, K. H., Abbas, M. M., Abrams, M. C., Chang, A. Y., Fahey, D. W., Gao, R. S., Irion, F. W., Lowen-stein, M., Manney, G. L., Michelsen, H. A., Podolske, J. R., Rinsland, C. P., and Zander, R.: Stratospheric NO and NO2
abun-dances from ATMOS solar-occultation measurements, Geophys. Res. Lett., 23, 2372–2376, 1996.
Newchurch, M. and Ayoub, M.: Comparison of the SAGE II version 6.0 measuremetns of NO2with ATMOS 3.1 and HALOE v19,
http://vortex.nsstc.uah.edu/atmchem/strat no2/main.html, 2004. Payan, S., Camy-Peyret, C., Jeseck, P., Hawat, T., Pirre, M.,
Re-nard, J.-B., Robert, C., Levevre F., Kanzawa, H., and Sasano, Y. S.: Diurnal and nocturnal distribution of stratospheric NO2 from solar and stellar occultation measurements in th Arctic vor-tex: comparison with models and ILAS satellite measurements, J. Geophys. Res., 104, 21 585–21 593, 1999.
Randall, C. E., Lumpe, J. D., Bevilacqua, R. M., Hoppel, K. W., Shettle, E. P., Rusch, D. W., Gordley, L. L., Kreher, K., Pfeil-sticker, K., Boesch, H., Toon, G., Goutail F., and Pommereau, J.-P.: Validation of POAM III NO2measurements, J. Geophys. Res., 107, 4432, doi:10.1029/2001JD001520, 2002.
Roscoe, H. K., Drummond, J. R., and Jarnot, R. F.: Infrared measurements of stratospheric composition. III. The daytime changes of NO and NO2. Proc. R. Soc. Lond., A375, 507–528, 1981.
Rozanov, A., Rozanov, V., and Burrows, J. P.: A numerical radiative transfer model for a spherical planetary atmosphere: Combined differential – integral approach involving the Picard iterative ap-proximation, J. Quant. Spectrosc. Rad. Transfer, 69, 451–512, 2001.
Russell III, J. M., Gordley, L. L., Gordley, J. H., Park, J. H., Drayson, S. R., Hesketh, W. D., Cicerone, R. J., Tuck, A. F., Frederick, J. E., Harries, J. E., and Crutzen, P. J.: The Halogen Occultation Experiment, J. Geophys. Res., 98, 10 777–10 797, 1993.
Sander, S. P., Friedl, R. R., DeMore, W. B., Golden, D. M., Kurylo, M. J., Hampson, R. F., Huie, R. E., Moortgat, G. K., Ravis-hankara, A. R., Kolb, C. E., and Molina, M. J.: Chemical kinetics and photochemical data for use in stratospheric modeling, Eval-uation Number 13, JPL Publication 00-3, Jet Propulsion Labora-tory, California Institute of Technology, Pasadena, CA, 2000. Sasano, Y., Suzuki, M., and Yokota, T.: Improved Limb
Atmo-spheric Spectrometer (ILAS) for stratoAtmo-spheric ozone layer mea-surements by solar occultation technique, Geophys. Res. Lett., 26, 197–200, 1999.
von Savigny, C., Rozanov, A., Bovensmann, H., Eichmann, K.-U., Kaiser, J. W., No¨el, S., Rozanov, V. V., Sinnhuber, B.-M., Weber, M., and Burrows, J. P.: The Ozone hole break-up in September 2002 as seen by SCIAMACHY on ENVISAT. J. Atmosph. Sci., accepted, 2004.
Sinnhuber, B.-M., Arlander, D. W.. Bovensmann, H. , Burrows, J. P., Chipperfield, M. P. , Enell, C.-F., Frieß, U., Hendrick, F., Johnston, P. V., Jones, R. L., Kreher, K., Mohamed-Tahrin, N., M¨uller, R., Pfeilsticker, K., Platt, U., Pommereau, J.-P., Pundt, I., Richter, A., South, A. M., Tørnkvist, K. K., Van Roozendael, M., Wagner, T., and Wittrock, F.: Comparison of measurements and model calculations of stratospheric bromine monoxide, J. Geo-phys. Res., 107, doi:10.1029/2001JD000940, 2002.
Sinnhuber M., Burrows, J. P., Chipperfield, M. P., Jackman, C. H., Kallenrode, M.-B., K¨unzi, K., and Quack, M.: A model study of the impact of magnetic field structure on atmospheric composition during solar proton events, Geophys. Res. Lett., 2003GL017265, 2003.
Solomon, S. and Keys, J. G.: Seasonal variations in Antarctic NOx
chemistry, J. Geophys. Res., 88, 5229–5239, 1992.
Stiller, G. P., Glatthor, N., Kellmann, S., Kimmich, E., Linden, A., Milz, M., and Fischer, H.: MIPAS on ENVISAT as an UT/LS Sounder, in: IRS 2000, edited by: Smith, W. L. and Timofeyev, Yu M., Current Problems in Atmospheric Radiation, A. Deepak Publishing, Hampton, Virginia, 839–842, 2001.
Stowasser, M., Oelhaf, H., Ruhnke, R., Kleinert, A., Wetzel, G., Friedl-Vallon, F., Kouker, W., Lengel, A., Maucher, G., Nord-meyer, H., Reddmann, T., and Fischer, H.: The variation of short-lived NOyspecies around sunrise at mid-latitudes as measured
by MIPAS-B and calculated by KASIMA, Geophys. Res. Lett., 30, 1432, doi:10.1029/2002GL016272, 2003.
Swinbank, R. and O’Neill, A.: A Stratosphere-Troposhere Data As-similation System, Mon. Weather Rev., 122, 686–702, 1994. Vogel, B., M¨uller, R., Deshler, T., Grooß, J.-U., Karhu, J.,
Stroh, F.: Vertical profiles of activated ClO and ozone loss in the Arctic vortex in January and March 2000: In situ obser-vations and model simulations, J. Geophys. Res., 108, 8334, doi:10.1029/2002JD002564, 2003.
Weber, M., Dhomse, S., Wittrock, F., Richter, A., Sinnhuber, B.-M., and Burrows, J. P.: Dynamical control of NH and SH win-ter/spring total ozone from GOME observations in 1995–2002, Geophys. Res. Lett., 30, 1853, doi:10.1029/2002GL016799, 2003.