HAL Id: inserm-02367141
https://www.hal.inserm.fr/inserm-02367141
Submitted on 17 Nov 2019
HAL is a multi-disciplinary open access
archive for the deposit and dissemination of
sci-entific research documents, whether they are
pub-lished or not. The documents may come from
teaching and research institutions in France or
abroad, or from public or private research centers.
L’archive ouverte pluridisciplinaire HAL, est
destinée au dépôt et à la diffusion de documents
scientifiques de niveau recherche, publiés ou non,
émanant des établissements d’enseignement et de
recherche français ou étrangers, des laboratoires
publics ou privés.
Elodie Guillaume, Carole Pornet, Olivier Dejardin, Ludivine Launay, Roberto
Lillini, Marina Vercelli, Marc Marí-Dell'olmo, Amanda Fontelo, Carme
Borrell, Ana Ribeiro, et al.
To cite this version:
Elodie Guillaume, Carole Pornet, Olivier Dejardin, Ludivine Launay, Roberto Lillini, et al..
Devel-opment of a cross-cultural deprivation index in five European countries. Journal of Epidemiology
and Community Health, BMJ Publishing Group, 2016, 70 (5), pp.493-9. �10.1136/jech-2015-205729�.
�inserm-02367141�
Development of a cross-cultural deprivation index
in
five European countries
Elodie Guillaume,
1Carole Pornet,
1,2Olivier Dejardin,
1,2Ludivine Launay,
1,3Roberto Lillini,
4,5Marina Vercelli,
5Marc Marí-Dell
’Olmo,
6,7,8Amanda Fernández Fontelo,
7Carme Borrell,
6,7,8,9Ana Isabel Ribeiro,
10Maria Fatima de Pina,
10Alexandra Mayer,
11Cyrille Delpierre,
12,13Bernard Rachet,
14Guy Launoy
1,2▸ Additional material is published online only. To view please visit the journal online (http://dx.doi.org/10.1136/jech-2015-205729)
For numbered affiliations see end of article.
Correspondence to Elodie Guillaume,“Cancers & Préventions,” U1086 INSERM-UCBN, Pôle Recherche CHU CAEN, Centre François Baclesse, Avenue du Général Harris, BP 5026, Caen Cedex 05 14076, France; elodie.guillaume@unicaen.fr Received 13 March 2015 Revised 25 October 2015 Accepted 13 November 2015 Published Online First 12 December 2015
To cite: Guillaume E, Pornet C, Dejardin O, et al. J Epidemiol Community Health 2016;70:493–499.
ABSTRACT
Background Despite a concerted policy effort in Europe, social inequalities in health are a persistent problem. Developing a standardised measure of socioeconomic level across Europe will improve the understanding of the underlying mechanisms and causes of inequalities. This will facilitate developing,
implementing and assessing new and more effective policies, and will improve the comparability and reproducibility of health inequality studies among countries. This paper presents the extension of the European Deprivation Index (EDI), a standardised measurefirst developed in France, to four other European countries—Italy, Portugal, Spain and England, using available 2001 and 1999 national census data. Methods and results The method previously tested and validated to construct the French EDI was used: first, an individual indicator for relative deprivation was constructed, defined by the minimal number of unmet fundamental needs associated with both objective (income) poverty and subjective poverty. Second, variables available at both individual (European survey) and aggregate (census) levels were identified. Third, an ecological deprivation index was constructed by selecting the set of weighted variables from the second step that best correlated with the individual deprivation indicator. Conclusions For each country, the EDI is a weighted combination of aggregated variables from the national census that are most highly correlated with a country-specific individual deprivation indicator. This tool will improve both the historical and international comparability of studies, our understanding of the mechanisms underlying social inequalities in health and implementation of intervention to tackle social inequalities in health.
INTRODUCTION
Tackling social inequalities in health is a persisting priority for international health authorities and for many national governments in Europe.1The level and nature of inequalities vary between countries according to the distribution of determinants of health inequalities. Along with increasing or decreasing trends in social inequalities, economic crises often quickly worsen inequalities. Measuring and comparing social inequalities in health between countries with different economies, social struc-tures and healthcare systems, will facilitate develop-ing more efficient policies to tackle social inequalities in health, and will increase our under-standing of the underlying mechanisms and causes
of social inequalities. Evidence-based health pol-icies require reliable and accurate measures of a population’s socioeconomic environment. From a European perspective, it is important that these measurements can be comparable or at least trans-ferable between different European countries, despite their sociocultural differences, in order to improve the comparability and reproducibility of health inequality studies across countries.
Townsend’s pioneering work conceptualised poverty in terms of relative deprivation and has shaped subsequent research on the topic. It is the conceptual bedrock of what is now both a signi fi-cant subdisciplinary field and a focus of social policy across the developed world.2 Deprivation refers to unmet need, which is caused by a lack of all kinds of resources, rather than financial needs alone; needs varying between societies and periods. A distinction has to be made between material and social deprivation. Material deprivation is easily measured using indicators relating to diet, health, clothing, housing, household facilities, environment and work.3Social deprivation is more difficult to measure. It has been described as providing a useful means of generalising the condition of those who do not or cannot enter into ordinary forms of family or other relationships.4 By distinguishing between social and material deprivation, Townsend anticipated aspects of what might now be called ‘social exclusion’, and developed the theory of mul-tiple deprivations as an accumulation of several types of deprivation.
Deprivation can also be categorised as objective or subjective. Objective deprivation relates to con-ditions, relationships and behaviours, whereas sub-jective deprivation relates to attitudes or beliefs. Objective deprivation is perceived collectively or socially and is registered in the census; subjective deprivation is individually perceived and is assessed by questionnaire in specific surveys.3 4
Since individual socioeconomic data are often absent or poorly collected in routine health data-bases, individual socioeconomic position can be assessed using socioeconomic characteristics of the place of residence. The ecological bias induced by this type of assessment is inevitable but it can be limited by the use of the smallest possible geo-graphical scale.5–7 Studies are therefore usually conducted with area-based measures developed from census data that are commonly known as eco-logical deprivation indices. These studies assess the impact of socioeconomic characteristic of place of
Open Access Scan to access more
residence on health inequalities integrating composition and contextual effect.8 9
Ecological deprivation indices were first developed in the early 1980s in the UK,3 10 11then in numerous countries across the world, including the USA,12 Canada,13 14 New Zealand15 and, more recently, in Italy,16–18 France,19–22 Spain,23 24 Sweden,25 the Czech Republic26 and Denmark.27 Since 2000, an index measuring multiple deprivation (IMD) at the small-area level became the official area deprivation index in the whole of the UK.28–30 The approach used conceptualised mul-tiple deprivation as a composite of different dimensions or domains of deprivation as anticipated by Townsend. IMDs was also developed and used in Germany.31 32 According to data availability at individual or aggregated level, the type of poverty measured by theses indices and the approaches used to build them, vary widely, making European and international compari-sons difficult.
In a previous paper, we developed a method for constructing a small area-level ecological deprivation index that is replicable in all European Union members, based on a European survey on deprivation (European Union Statistics on Income and Living Conditions EU-SILC) and national census data.33The previous paper provided the French version of this EDI, which has since been used in several studies on social inequalities in cancer inci-dence34and screening uptake.35
An informal European network of English, French, Italian, Portuguese and Spanish experts was created in 2012, to develop a comparable index measuring socioeconomic deprivation status across participant countries. In this paper, we present the EDI version developed for thesefive countries: Italy, Portugal, Spain, England and France.
MATERIALS AND METHODS Data sources
Individual data: the EU-SILC common questionnaire framework
We used the EU-SILC (http://www.eui.eu/Research/Library/ ResearchGuides/Economics/Statistics/DataPortal/EU-SILC.aspx) survey to obtain individual data to construct the indices. EU-SILC is a cross-sectional and longitudinal sample survey providing data on income, poverty, social exclusion and living conditions in the European Union. The common EU-SILC framework provides a recommended design for implementing EU-SILC, with common requirements (for imputation, weight-ing, sampling errors and calculation), common concepts (house-hold and income) and common classifications (ISCO: International Standard Classification of Occupations, NACE: Statistical Classification of Economic Activities and ISCED: International Standard Classification of Education) aimed at maximising the comparability of the information produced. From these data, the statistical office of the European Union (Eurostat—http://ec.europa.eu/eurostat/web/main) produces a European standardised questionnaire that is specifically designed to study deprivation. It consists of nine questions, common to European Union members, evaluating needs that directly or indirectly inducefinancial inability. Only these individual pieces of data from the survey conducted in 2006, common to all European Union members, were used in this work.
For each European Union member, the sum of weights for the sample design and the response rate to a national question-naire were tailored on the basis of the national population size. All analyses were weighted for non-response and adjusted for sample design, to ensure the representativeness of the results for each member.
Ecological data: national population censuses
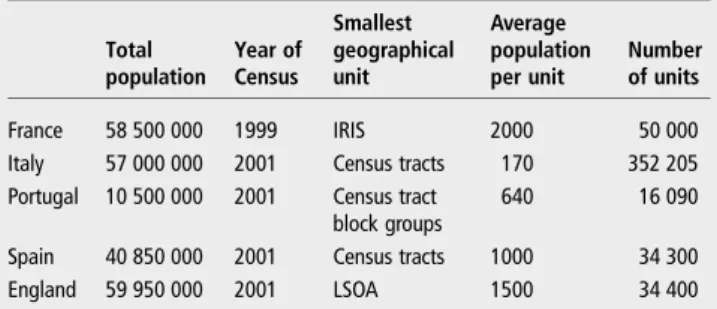
Ecological data came from the last exhaustive national population censuses, which were conducted in 2001 for Italy (Italian National Institute of Statistics: ISTAT—http://www.istat.it/en/censuses), Portugal (National Institute of Statistics: INE—https://www.ine.pt/ xportal/xmain?xpgid=ine_main&xpid=INE&xlang=en), Spain (National Institute of Statistics: INE—http://www.ine.es/en/ welcome.shtml) and England (Office for National Statistics: ONS —http://www.ons.gov.uk/ons/index.html), and, in 1999, for France (National Institute for Statistics and Economic Studies: INSEE— http://www.insee.fr/fr/). To minimise the unavoidable ecological bias as much as possible,36–38the smallest area for which census data were available was identified for each country (table 1).
EDI construction
EDI is based on methodologyfirst developed by sociologists in England,3 39which uses the concept of relative deprivation mea-sured by fundamental needs associated with both objective (income) and subjective poverty. The full methodological and theoretical concepts have been reported previously.33 The method of index construction was identical for each country, based on three steps and using first, EU-SILC individual data, and second, data from each country census.
Step 1: Construction of an individual deprivation indicator
The first step was constructing an individual indicator for deprivation that was exclusively based on EU-SILC data for fun-damental needs identification.
Selection of fundamental needs at the individual level
Needs directly inducing financial inability were assessed in the survey by questions formulated with the phrasing‘ability to’ or ‘capacity to’, followed by fixed answer choices of ‘yes’ or ‘no’. Needs not directly inducing a financial inability were assessed with the formulation,‘Do you have…’. At least 50% of house-holds had to possess something for it to be considered a poten-tial fundamental need. Among these preselected needs, the goods/services that less than 50% of households did not have because they could not afford them were considered as funda-mental needs.
Selection of fundamental needs associated with both objective (income) and subjective poverty
Income poverty was directly available in the EU-SILC survey and subjective poverty was assessed by the‘Ability to make ends meet’ question in EU-SILC. This variable, with six modalities of response (from ‘With great difficulty’ to ‘Very easily’), was dichotomised. The threshold at which a person felt‘poor’ was
Table 1 Census population and smallest geographical units for the five European countries
Total population Year of Census Smallest geographical unit Average population per unit Number of units France 58 500 000 1999 IRIS 2000 50 000
Italy 57 000 000 2001 Census tracts 170 352 205 Portugal 10 500 000 2001 Census tract
block groups
640 16 090
Spain 40 850 000 2001 Census tracts 1000 34 300 England 59 950 000 2001 LSOA 1500 34 400
determined by the bestfit (highest Wald tests) of the relationship between income poverty and subjective poverty by univariable logistic regressions. Among the preselected fundamental needs, those associated with both objective (income) poverty and sub-jective poverty were selected by multivariable logistic regressions. Selected fundamental needs are those for which the p value was significant at the 5% level for both models.
Definition of an individual deprivation indicator
Then the individual deprivation indicator was defined by the minimal number of fundamental needs lacking by financial incapacity. The threshold of the number of lacking fundamental needs explaining both income poverty and subjective poverty was determined statistically by the best fit of the relationship between income poverty and subjective poverty, and the minimal lacking fundamental needs. This defined the individual deprivation indicator.
Step 2: Identification and dichotomisation of variables available both at aggregate (census) level and individual (EU-SILC) level
The second step was identifying the domains of variables avail-able both at individual (EU-SILC survey) and aggregate levels (census) in each country. These variables were then dichoto-mised based on the results of logistic regression.
Step 3: Construction of an ecological deprivation index, the EDI
The third andfinal step was constructing an ecological depriv-ation index.
First, the univariable logistic regression model selected the variables of step 2, which explained the individual indicator ( p<0.05; step 1.3). These variables were then grouped together in a new model. The multivariable logistic regression facilitated the selection of the individual variables that were available in the EU-SILC and National Census data sets, when they were associated with the EU-SILC individual deprivation indicator. As these selected variables were also available in the census data at the smallest level, we were able to build the ecological depriv-ation index for each country by using these variables. The regression coefficients associated with these selected variables in thefinal model became the weights of these variables measured at the aggregated level in the ecological index. Thefinal index is the sum of these weighted variables.
RESULTS
Step 1: Construction of an individual deprivation indicator Selection of fundamental needs at the individual level
In accordance with the concept of relative deprivation, we inves-tigated how individuals define deprivation based on what they can or cannot afford in a specific societal and cultural context. Using EU-SILC household databases, a list of potential funda-mental needs involving‘possession’ was constructed. Their lack reflects deprivation in a specific cultural context (table 2).
Table 2 shows that the identified fundamental needs were similar across the countries, except‘taking a week’s annual holiday away from home’ in Portugal and ‘having a computer’ in Portugal and Italy, which were lacking in >50% of the population in these countries and thus were not treated as fundamental needs there.
Selection of fundamental needs associated with both objective (income) and subjective poverty
Objective poverty represents low income. An individual was considered poor when their household had a standard of living below 60% of the median national standard of living, following the official Eurostat definition. The standard of living is equal to the net income of the household divided by the number of units of consumption.
In 2006, the poverty threshold per one consumption unit, independent of the size and structure of the household, was €800 in France, €728 in Italy, €341 in Portugal, €525 in Spain and€876 in England. By this definition, the percentage of low income households as identified in EU-SILC was 14% in France, 20.3% in Italy, 20.7% in Portugal, 21.3% in Spain and 20.5% in England-Wales.
Since the concept of deprivation cannot be determined solely by income, subjective poverty was evaluated using the variable ‘Ability to make ends meet’ (six modalities of response: (1) With great difficulty (2) With difficulty (3) With some difficulty (4) Fairly easily (5) Easily (6) Very easily) in the EU-SILC survey. The cut-off point for each country was 1 for Portugal, 2 for Italy, England-Wales and France and 3 for Spain. These results show that the feeling of poverty varied between Latin countries, even for neighbouring countries such as Spain and Portugal, reflecting intercountry cultural differences.
Table 3 shows the percentage of people reporting difficulty ‘making ends meet’ according to country.
The most important intercountry difference in index con-struction was the much higher percentage of subjectively poor Table 2 Identification of fundamental needs (proportion of households that indicated that specific goods and services were not within their means, EU-SILC survey 2006)
Type of needs France (%) Italy (%) Portugal (%) Spain (%) England-Wales* (%)
Eating a meal containing meat, fish or the vegetarian equivalent once every 2 days 6.7 6.2 4.4 4 5
Taking a week’s annual holiday away from home 32.5 38.7 60.5† 38.3 22.7
Using your own means to cover a necessary yet unplanned expense 34.1 28.4 18.2 31.2 28.8
Keeping your house adequately warm 6.7 10.4 41.6 9.3 4.9
Having a phone (including mobile phone) 0.9 1.5 5.4 0.5 0.2
Having a colour TV 0.4 0.5 1.1 0.1 0.1
Having a computer 8.3 ‡ ‡ 9 5.7
Having a washing machine 1.4 0.8 4.8 0.4 0.8
Having a personal car 4.6 3.8 11.6 4.8 5.3
*England and Wales could not be distinguished for these data.
†Since >50% of Portugal’s population cannot afford ‘to take a week’s annual holiday away from home’, this item is not considered a fundamental need. ‡Since <50% of the households have a computer, this item is not considered a fundamental need.
households in Spain. Among the previously identified funda-mental needs (step 1.1), those associated with both objective and subjective poverty were selected by logistic regressions (table 4).
Table 4shows that fundamental needs associated with both objective and subjective poverty were partly shared in the focus countries. ‘Using your own means to cover a necessary yet unplanned expense’ seemed to be a ‘European’ fundamental need, while items about holidays, eating, warming the house and having a personal car were shared by three countries or more. Colour TV and a washing machine were not relevant in any country. The number of fundamental needs associated with objective and subjective poverty (between four and five) was quite constant.
Definition of an individual deprivation indicator
A binary individual deprivation indicator was obtained by deter-mining the best threshold for the number of fundamental needs unmet due to financial inability. The threshold best-fitting poverty in all countries was the lacking of two fundamental needs. Then, the households were defined as deprived only if they could not afford at least two of the country-specific funda-mental needs.
Step 2: Identification and dichotomisation of variables available both at aggregate (census) level and individual (EU-SILC) level
The aggregated index, based on each country’s available census data, mustfit with the common individual deprivation index to the best possible degree. Therefore, in order to compute this index, it was necessary to identify the variables that were avail-able for each country, phrased and coded in the same way in the EU-SILC and census data sets. Six domains of deprivation were identified across all five European countries (table 5).
Step 3: Construction of an ecological deprivation index (EDI)
For each country, EDI was derived from a weighted combination of aggregated variables from the national census. These variables were those best correlated with the individual deprivation indicator.
Table 5shows variables selected for the ecological deprivation index for each country, which were variables associated with the binary individual deprivation indicator.
In the final model, the regression coefficients associated with the selected variables became the variables’ weights measured at the aggregated level in the ecological index (table 5). For each country, the weighted sum of these variables constituted an eco-logical measure.
For the target countries, EDI was composed of 8–10 census variables. Four were shared in common: ‘overcrowding’, ‘non-owner’, ‘no higher education’ and ‘low-income occupations’. ‘Unemployed’ was not a variable for the Spanish and English EDI, where working situation was represented by ‘no self-employer with employees’ and ‘permanently disabled or/and unfit to work’, respectively. One peculiarity of the composition of the Spanish EDI was the ‘crime/vandalism’ census variable, which was not available in other censuses at the smallest level. Finally, because the domains of deprivation for which variables were available in the EU-SILC survey and the national censuses were not shared in common in all five countries, and because the variables associated with the individual deprivation indicator were different among countries, the variables comprising the final deprivation index differed among countries. We obtained a country-specific index approximating individual deprivation indicators by the available census tract data. Although the vari-ables differ among countries, the index was based on the same theoretical concept of relative poverty and it was comparable across countries (see online supplementary material 1).
Mapping of EDI
To develop more easily readable maps for Italy and Spain, EDI scores were computed (SAS V.9.1 in France and England, R 3.0.1 in Spain, SPSS V.21.0 in Portugal and SPSS V.19.0 in Italy) and mapped (ArcMap V.10.2.1) at the municipal level, while the Portugal and England maps are readable at the smallest level (census tract block groups and lower super output areas (LSOA; see online supplementary material 2).
DISCUSSION
This paper demonstrates that it was possible to construct an aggregate deprivation index at the small area-level for five European countries (France, Italy, Spain, Portugal and England) based on the concept of relative deprivation. Using individual
Table 4 Selecting fundamental needs associated with both objective and subjective poverty in France, Italy, Portugal, Spain and England-Wales in 2006 using univariable and multivariable logistic regression (Symbol X)
France Italy Portugal Spain England-Wales* Eating a meal containing meat, fish or the vegetarian equivalent once every two days x x x
Taking a week’s annual holiday away from home x x x x
Using your own means to cover a necessary yet unplanned expense x x x x x
Keeping your house adequately warm x x x
Having a phone (including a mobile phone) x
Having a colour TV
Having a computer x x
Having a washing machine
Having a personal car x x x
*England and Wales could not be distinguished for these data.
Table 3 Percentage of subjectively and objectively (income) poor households in France, Italy, Portugal, Spain and England
Subjectively poor households (%) Objectively (income) poor households (%) France 16 14 Italy 34.7 20.3 Portugal 15.7 20.7 Spain 60 21.3 England-Wales* 13.3 20.5
data common to all European members makes it possible to conduct European comparative studies.
The purpose of EDI is to measure the social environment in a comparable manner across countries, despite the differences in the census variables available, and to incorporate the social and cultural specificities concerning each country. The eco-logical deprivation indices are built according to shared meth-odological principles, by selecting fundamental needs associated with both objective and subjective poverty, and use the same theoretical concept of relative deprivation. The basis of this concept is that the experience of being deprived in a community is common to any culture or country, but that this deprivation may be produced by different mechanisms. The concept of relative deprivation3 makes it possible to measure comparable socioeconomic status using variables that may differ in each country.
Another advantage of this index is that it can be calculated at the small area census level. Despite the differences in population size at this level across countries, it was possible to account for contextual factors. The indices are composed of weighted census elements because these best reflect country-specific indi-vidual experiences of deprivation.40For this purpose, the much higher proportion of subjectively poor households in Spain compared with the other countries could reflect a more diffuse perception of the effect of the anticipated (2006–2010) inner socioeconomic crises on the family capability of affording fun-damental needs.
The similarities observed between countries in different stages of development indicate that the impact of cultural differences may be less than expected. For instance, among the nine needs studied, fundamental needs were the same for all countries, except for‘taking a week’s annual holiday away from home’ in Portugal, and ‘having a computer’ in Portugal and Italy. Consequently, the final national deprivation indices are very similar. Among the 17 census variables that make up the 5
national indices, 8 are shared by at least 3 indices and 4 are shared by all indices. Italy and Portugal shared the same compo-nents for their indices, but ‘Not married’ existed only in Italy. Only three variables are specific to one country: ‘Crime/ Vandalism’ and ‘No employer with employees’ in Spain, ‘Foreign nationality’ and ‘Household with at least 6 persons’ in France, and ‘No detached house’ and ‘Permanently disabled and/or unable to work’ in England.
Exploratory studies must be conducted on the impact of het-erogeneity of the size of geographical areas on comparability among countries. The geographical level of the census data varies widely, with a mean population ranging from 170 subjects per unit in Italy to 2000 subjects per unit in France. A dilution effect should be observed, caused by the greater population in larger units and the associated increase in social heterogeneity.36 EDI can be computed at several geographical scales and sizes and can be harmonised across Europe. Further studies will be conducted to compare the ability of each country’s EDI to cor-rectly identify disadvantaged areas. One specific trait of EDI is that it assesses deprivation in the same way in urban and rural areas. However, health inequalities tend to be more marked in urban areas (especially in the England), as highlighted in the European project INEQ-CITIES.41
The EU-SILC survey data used were those from the survey conducted in 2006, which were the complete data available at the beginning of the study. Eurostat indicator analyses on mon-etary poverty, material deprivation and low work intensity show that the number of people at risk of poverty or social exclusion in the European Union (28 members) was decreasing before the economic crisis, to reach its lowest level in 2009, and then grew again in the following years, marked by the economic crisis. The number of people living in severe material deprivation had thus increased in the majority of countries. (Eurostat website: http://ec.europa.eu/eurostat/statistics-explained/index.php/Europe_ 2020_indicators_poverty_and_social_exclusion). According to Table 5 Weights (regression model coefficients) of variables selected for the ecological deprivation index (EDI) in Italy, Portugal, Spain and England from 2001, and from 1999 for France’s census data
Domains Variables France Italy Portugal Spain England
Social exclusion Crime/vandalism 0.49
Foreign nationality 0.41
Household data Overcrowding* 0.21 0.83 0.40 0.99 0.95
Single-parent household 1.00 1.35
Household with≥6 persons 0.97
Basic amenities of housing No bath or shower 0.71 2.08 0.06 1.33
No indoor flushing 0.56 1.46
No detached house 0.85
Home ownership Non-owner† 1.02 1.07 1.19 0.73 1.46
Car No car 0.71 1.74 0.83
Marital status Not married 0.15 0.37 0.45
Year of birth/sex Women aged≥65 years 0.33 0.25
Employment status Permanently disabled or/and unable to work 0.98
Unemployed 0.94 1.18 0.37
Education level No higher education‡ 1.17 1.07 1.29 1.30 0.31
Occupation Status in employment : no self-employer with employees 0.95
Occupation : low income occupations§ 0.57 0.19 0.01 0.62 0.39
*Overcrowding:‘>1 person per room’, except for Portugal: ‘household with 6 rooms or more’.
†Non-owner: ‘all non-owners’ in France and Spain; ‘renters’ in Italy and Portugal; ‘social renters’ in England. ‡No higher education: ‘no tertiary education’ in France, Italy, Spain and England; ‘primary education’ in Portugal.
§Elementary occupations:‘unskilled workers’ in France and in Spain; ‘people in a situation other than employee’ in Italy; ‘manual workers’ in Portugal; ‘no business leaders/company managers/intermediate occupations’ in England.
these trends, the present EDI version is likely to underestimate the material deprivation. Thanks to its construction modalities, EDI is easily updated and can thus integrate such recent trends in further versions. Since EU-SILC survey data are renewed annually, the frequency of EDI upgrading could be annual even if the census frequency is multiannual in certain European countries.
Beyond intracountry validation by comparison with other available indices, the major advantage of an index such as EDI is that it provides not only a powerful tool in each country, but since it is constructed from one European study using the same questionnaire, it also constitutes a cross-cultural tool for conducting relevant international compari-sons on social inequities in health. Another strength of these indices is their ability to be replicable over time and adaptable to the available data, thanks to the dynamic cohort in the EU-SILC survey.
Since the EU-SILC survey is available for all members of the European community, EDI should be constructed for all 28 members. EDI will produce an improved understanding of the mechanisms underlying health inequalities while account-ing for the cultural and historical context of each country. Developing a standardised EDI across Europe will allow European comparative studies to be undertaken and replicated over time and space. From a pragmatic point of view, EDI can be used to investigate links between socioeconomic environ-ment and health in allfields where health data are available at aggregated level and comparable from one country to another. Many studies on deprivation and mortality data as health indicators have been developed in European coun-tries17 42 43 but no comparison between countries has been carried out. Cancer for which registries are already organised in a European network could be the first field for application of EDI.34 Moreover, EDI is a useful tool for targeting public health interventions at socioeconomically deprived indivi-duals. For example, persisting, wide socioeconomic inequal-ities in cancer survival have been observed in many countries where their healthcare system is based on universal free access and equity principles. Mechanisms underlying these inequal-ities remain poorly understood and international comparisons may enlighten the origins of these challenging inequalities. EDI can provide technical support to assist EU member states in implementing and strengthening patient and community empowerment policies, strategies and programmes, including guidance on how to reach those groups and individuals who are most likely to be disadvantaged, as recommended in WHO-Europe plans for 2012–2016.
What is already known on this subject
▸ Studying social inequalities in health requires the ability to measure them accurately, to compare them between different areas or countries and to follow trends over time. ▸ Several European countries have already developed
ecological deprivation indices; however, the approaches used to generate such indices vary widely, making international comparison difficult.
▸ To address this issue, a European transnational ecological deprivation index at the small area level has recently been developed in France: the French version of EDI.
What this study adds
▸ This study shows that a small area-level European deprivation index can be developed. By the concept and methods of construction, this index is likely to be replicable across Europe and able to be updatedflexibly annually. We argue that the EDI provides the focus and comparability required for studying social inequalities in health.
▸ The development of an EDI across Europe contributes to the priorities of Horizon 2020 and WHO-Europe recommendations by facilitating comparative analyses of public health systems, and research on the specifics and evolution of social inequalities in health. The potential effectiveness of new policies informed by EDI data at reducing inequalities in health will help to create greater fairness and equality in healthcare systems throughout the European Union.
Author affiliations
1French Institute of Health and Medical Research—Caen University, U1086
“Cancers & Préventions”, Caen, France
2Pôle Recherche, University Hospital of Caen, Caen, France
3Centre François Baclesse, Avenue du Général Harris—BP5026, Caen, France 4Department of Sociology, PhD School in Applied Sociology and Methodology of
Research, University of Milan-Bicocca, Genoa, Italy
5Department of Health Sciences, University of Genoa, Genoa, Italy 6
CIBER Epidemiología y Salud Pública (CIBERESP), Madrid, Spain
7Agència de Salut Pública de Barcelona, Barcelona, Spain 8Institut d’Investigació Biomèdica (IIB Sant Pau), Barcelona, Spain 9Universitat Pompeu Fabra, Barcelona, Spain
10Instituto de Engenharia Biomédica—INEB, Universidade do Porto—Departamento
de Epidemiologia Clínica, Medicina Preditiva e Saúde Pública, Faculdade de Medicina do Porto, Universidade do Porto—Instituto de Saúde Pública da Universidade do Porto—ISPUP, Porto, Portugal
11
Registro Oncologico Regional Sul, Lisbon, Portugal
12INSERM, U1027, Toulouse F-31300, Toulouse, France
13Université Toulouse III Paul-Sabatier, UMR1027, Toulouse F-31300, Toulouse,
France
14
Cancer Survival Group, Department of Non-Communicable Disease Epidemiology, London School of Hygiene and Tropical Medicine, London, UK
Twitter Follow Marc Marí-Dell’Olmo at @epistatistic
Acknowledgements The authors would like to acknowledge European Partnership for Action Against Cancer (EPAAC) and Eurostat, as well as the National Institutes of Statistics, for providing us with census data.
Contributors CP conducted the study and monitoring across all participants. EG wrote the manuscript. All the authors reviewed and approved thefinal version of the manuscript.
Funding EPAAC provided funding for workshops in Ispra, Lisbon, Porto and Caen. Competing interests None declared.
Provenance and peer review Not commissioned; externally peer reviewed. Open Access This is an Open Access article distributed in accordance with the Creative Commons Attribution Non Commercial (CC BY-NC 4.0) license, which permits others to distribute, remix, adapt, build upon this work non-commercially, and license their derivative works on different terms, provided the original work is properly cited and the use is non-commercial. See: http://creativecommons.org/ licenses/by-nc/4.0/
REFERENCES
1 Marmot M. European Commission. Health inequalities in the EU-final report of a consortium, consortium lead. Brussels: European Commission Directorate-General for Health and Consumers, 2013.
2 Fahey T. Poverty and the two concepts of relative deprivation. In: Working Paper (University College Dublin), July 2010.
3 Townsend P. Deprivation.J Soc Policy1987;16:125–46.
4 Townsend P. Poverty in the United Kingdom. London: Allen Lane and Penguin Books, 1979:1216.
5 Guillemin F, Carruthers E, Li LC. Determinants of MSK health and disability—social determinants of inequities in MSK health.Best Pract Res Clin Rheumatol 2014;28:411–33.
6 Johnson AM, Hines RB, Johnson JA, et al. Treatment and survival disparities in lung cancer: the effect of social environment and place of residence.Lung Cancer 2014;83:401–7.
7 Wang L, Hu W. Immigrant health, place effect and regional disparities in Canada. Soc Sci Med2013;98:8–17.
8 Domínguez-Berjón F, Borrell C, Rodríguez-Sanz M, et al. The usefulness of area-based socioeconomic measures to monitor social inequalities in health in Southern Europe.Eur J Public Health2006;16:54–61.
9 Matheson FI, Dunn JR, Smith KL, et al. Development of the Canadian Marginalization Index: a new tool for the study of inequality. Can J Public Health 2012;103(8 Suppl 2):S12–16.
10 Jarman B. Identification of underprivileged areas.BMJ (Clin Res Ed) 1983;286:1705–9.
11 Carstairs V, Morris R. Deprivation: explaining differences in mortality between Scotland and England and Wales.BMJ1989;299:886–9.
12 Eibner C, Sturm R. US-based indices of area-level deprivation: results from HealthCare for Communities.Soc Sci Med2006;62:348–59.
13 Frohlich N, Mustard C. A regional comparison of socioeconomic and health indices in a Canadian province.Soc Sci Med1996;42:1273–81.
14 Pampalon R, Raymond G. A deprivation index for health and welfare planning in Quebec. Chronic Dis Can 2000;21:104–13.
15 Salmond C, Crampton P, Sutton F. NZDep91: a New Zealand index of deprivation. Aust N Z J Public Health1998;22:835–7.
16 Caranci N, Costa G. Un indice di deprivazione a livello aggregato da utilizzare su scala nazionale: giustificazioni e composizione dell’indice. In: Costa G, Cislaghi C, Caranci N, eds. Disuguaglianze sociali di salute. Problemi di definizione e di misura. Salute e Società, 2009;58–78.
17 Caranci N, Biggeri A, Grisotto L, et al. [The Italian deprivation index at census block level: definition, description and association with general mortality]. Epidemiol Prev 2010;34:167–76.
18 Lillini R, Quaglia A, Vercelli M, et al. [Building of a local deprivation index to measure the health status in the Liguria Region]. Epidemiol Prev 2012;36:180–7. 19 Challier B, Viel JF. [Relevance and validity of a new French composite index to measure
poverty on a geographical level]. Rev Epidemiol Sante Publique 2001;49:41–50. 20 Havard S, Deguen S, Bodin J, et al. A small-area index of socioeconomic
deprivation to capture health inequalities in France.Soc Sci Med2008;67:2007–16. 21 Rey G, Jougla E, Fouillet A, et al. Ecological association between a deprivation
index and mortality in France over the period 1997–2001: variations with spatial scale, degree of urbanicity, age, gender and cause of death.BMC Public Health 2009;9:33.
22 Lalloué B, Monnez JM, Padilla C, et al. A statistical procedure to create a neighborhood socioeconomic index for health inequalities analysis.Int J Equity Health2013;12:21.
23 Domínguez-Berjón MF, Borrell C, Cano-Serral G, et al. [Constructing a deprivation index based on census data in large Spanish cities(the MEDEA project)].Gac Sanit 2008;22:179–87.
24 Marí-Dell’Olmo M, Martínez-Beneito MA, Borrell C, et al. Bayesian factor analysis to calculate a deprivation index and its uncertainty.Epidemiology2011;22:356–64. 25 Sundquist K, Malmström M, Johansson SE. Neighbourhood deprivation and
incidence of coronary heart disease: a multilevel study of 2.6 million women and men in Sweden.J Epidemiol Community Health2004;58:71–7.
26 Slachtová H, Tomásková H, Splíchalová A, et al. Czech socio-economic deprivation index and its correlation with mortality data.Int J Public Health2009;54:267–73. 27 Meijer M, Engholm G, Grittner U, et al. A socioeconomic deprivation index for small
areas in Denmark.Scand J Public Health2013;41:560–9.
28 Noble M, Mc Lennan D, Wilkinson K. The English Indices of Deprivation 2007. 2008. 29 Ralston K, Dundas R, Leyland AH. A comparison of the Scottish Index of Multiple
Deprivation (SIMD) 2004 with the 2009+1 SIMD: does choice of measure affect the interpretation of inequality in mortality?Int J Health Geogr2014;13:27. 30 NOBLE M, WRIGHT G, SMITH G. Measuring multiple deprivation at the small-area
level.Environment and Planning A2006;38:169–85.
31 Maier W, Fairburn J, Mielck A. [Regional deprivation and mortality in Bavaria. Development of a community-based index of multiple deprivation]. Gesundheitswesen2012;74:416–25.
32 Grundmann N, Mielck A, Siegel M, et al. Area deprivation and the prevalence of type 2 diabetes and obesity: analysis at the municipality level in Germany.BMC Public Health2014;14:1264.
33 Pornet C, Delpierre C, Dejardin O, et al. Construction of an adaptable European transnational ecological deprivation index: the French version.J Epidemiol Community Health2012;66:982–9.
34 Bryere J, Dejardin O, Bouvier V, et al. Socioeconomic environment and cancer incidence: a French population-based study in Normandy.BMC Cancer2014;14:87. 35 Ouédraogo S, Dabakuyo-Yonli TS, Roussot A, et al. European transnational
ecological deprivation index and participation in population-based breast cancer screening programmes in France.Prev Med2014;63:103–8.
36 Woods LM, Rachet B, Coleman MP. Choice of geographic unit influences socioeconomic inequalities in breast cancer survival.Br J Cancer2005;92: 1279–82.
37 Mobley LR, Kuo TM, Andrews L. How sensitive are multilevel regressionfindings to defined area of context?: a case study of mammography use in California.Med Care Res Rev2008;65:315–37.
38 Cadum E, Costa G, Biggeri A, et al. [Deprivation and mortality: a deprivation index suitable for geographical analysis of inequalities]. Epidemiol Prev 1999;23:175–87. 39 Gordon D, Levitas R, Pantazis C. Poverty and social exclusion in Britain. York:
Joseph Rowntree Foundation, 2000.
40 Saunders J. Weighted Census-based deprivation indices: their use in small areas. J Public Health Med1998;20:253–60.
41 Borrell C, Pons-Vigués M, Morrison J, et al. Factors and processes influencing health inequalities in urban areas.J Epidemiol Community Health2013;67:389–91. 42 Newton JN, Briggs AD, Murray CJ, et al. Changes in health in England, with
analysis by English regions and areas of deprivation, 1990–2013: a systematic analysis for the Global Burden of Disease Study 2013. Lancet 2015. 43 Gandarillas AM, Domínguez-Berjón MF, Soto MJ. Increase in socioeconomic
inequalities in mortality in a Southern European region: a small-area ecological study.J Public Health (Oxf )2015.