HAL Id: inserm-00530164
https://www.hal.inserm.fr/inserm-00530164
Submitted on 27 Oct 2010HAL is a multi-disciplinary open access archive for the deposit and dissemination of sci-entific research documents, whether they are pub-lished or not. The documents may come from teaching and research institutions in France or abroad, or from public or private research centers.
L’archive ouverte pluridisciplinaire HAL, est destinée au dépôt et à la diffusion de documents scientifiques de niveau recherche, publiés ou non, émanant des établissements d’enseignement et de recherche français ou étrangers, des laboratoires publics ou privés.
Scenarios of future lung cancer incidence by educational
level: Modelling study in Denmark.
Gwenn Menvielle, Isabelle Soerjomataram, Esther de Vries, Gerda Engholm,
Jan Barendregt, Jan Willem Coebergh, Anton Kunst
To cite this version:
Gwenn Menvielle, Isabelle Soerjomataram, Esther de Vries, Gerda Engholm, Jan Barendregt, et al.. Scenarios of future lung cancer incidence by educational level: Modelling study in Denmark.. European Journal of Cancer, Elsevier, 2010, 46 (14), pp.2625-32. �10.1016/j.ejca.2010.07.027�. �inserm-00530164�
S
CENARIOS OF FUTURE LUNG CANCER INCIDENCE BY EDUCATIONAL
LEVEL
:
MODELLING STUDY IN
D
ENMARK
Gwenn Menvielle1,2,3, Isabelle Soerjomataram3,4, Esther de Vries3, Gerda Engholm5, Jan J Barendregt6, Jan Willem Coebergh3, Anton E Kunst7
1. Inserm U1018, Center for Epidemiology and Population Health, Occupational and social
determinants of health, Villejuif, France
2. University of Versailles Saint Quentin, UMRS1018, France
3. Department of Public Health, Erasmus MC, Rotterdam, Netherlands
4. Harvard School of Public Health, Boston, the USA
5. Dept Cancer Prevention & Documentation, Danish Cancer Society, Copenhaguen,
Denmark
6. University of Queensland, School of Population Health, Herston, Australia
7. Department of Public Health, Academic Medical Center, University of Amsterdam,
Amsterdam, Netherlands
Corresponding author Gwenn Menvielle
Inserm U1018, Occupational and social determinants of health, Bat 15/16; 16 ave Paul
Vaillant Couturier; 94807 Villejuif Cedex; France
Tel : +33-1-77-74-74-20
Abstract
Objective: To model future trends in lung cancer incidence in Denmark by education under
different scenarios for cigarette smoking.
Methods: Lung cancer incidence until 2050 was modelled using the Prevent software. We
estimated lung cancer incidence under a baseline scenario and under four alternative
scenarios for smoking reduction: decreasing initiation rates among the young, increasing
cessation rates among smokers, a scenario combining both changes, and a levelling-up
scenario in which low and mid educated people acquired the smoking prevalence of highly
educated. Danish National Health Interview Surveys (1987-2005) and cancer registry data
combined with individual education status from Statistics Denmark were used for empirical
input.
Results: Under the baseline scenario, lung cancer rates are expected to decrease for most
educational groups during the next decades, but educational inequalities will increase further.
Under the alternative scenarios, an additional decrease in lung cancer rates will only be
observed from 2030 onwards, but only from 2050 onwards under the initiation scenario. The
cessation and the combined scenarios show the largest decrease in lung cancer rates for all
educational groups. However, in none of these scenarios, the relative differences between
educational groups would reduce. A modest decrease in these inequalities will be observed
under the levelling-up scenario.
Discussion: Our analyses show that relative inequalities in lung cancer incidence rates will
tend to increase. It may be reduced to a small extent if smoking prevalence of low educated
people were to converge towards those of high educated people. An important decrease in
lung cancer rates will be observed in all educational groups however, especially when
focusing both on initiation and cessation strategies.
Key-words
Introduction
Lung cancer is one of the main cancers in developed countries [1, 2]. Between the
mid-1990s and early 2000s in Europe, incidence and mortality rates started to decrease in men
whereas an increase is still observed among women in most countries [3]. Tobacco is the
major risk factor for lung cancer, with a population attributable fraction around 85% [4]. Most
European countries have reported higher lung cancer incidence and mortality rates among
people with lower socioeconomic position [5-7]. To explain these inequalities, a common
hypothesis is that a higher exposure to risk factors explains the higher incidence of lung
cancer in low socioeconomic groups. Studies have reported that a substantial part of this
inequality could be attributed to differences in smoking prevalence by socioeconomic position
[8, 9].
The existence of socioeconomic inequalities in lung cancer incidence and mortality is a major
public health concern. Because of the long latency period between exposure to smoking and
lung cancer incidence, any public health policy aiming at reducing smoking would only affect
lung cancer incidence several years after its implementation. Projections of the incidence of
the disease are thus the only mean for public health professionals and policy-makers to
decide which one should be implemented [10]. Therefore, it is crucial to develop tools to
estimate the timing and the magnitude of the impact of such public health policies. Such
projection models will also document short term trends in lung cancer rates that may be
expected in view of recent trends in smoking.
The aim of this analysis is to estimate changes in future lung cancer incidence for different
educational groups given different types of interventions on smoking, using the software
Prevent. In particular, the model will document how long it would take before the changes in
on long-term and good quality Danish data on smoking [11] and cancer incidence [7], both
Methods
We stratified all analyses by sex and education. Education was coded in three categories:
less than ten years of education (primary, secondary and grammar school) referred to as low
education, 10-12 years of education (vocational education) referred to as middle education,
and 13 years of education and more (tertiary education) referred to as high education [7].
Detailed description of the methodology including formulas used in Prevent can be found
elsewhere [12]. In our analyses, Prevent estimates the changes in lung cancer incidence in a
population due to changes in smoking prevalence. The method is based on the effect
measure of “potential impact fraction” (PIF). PIF represents the proportional change in the number of incident cases at a certain time due to changes in risk factor prevalence in the
past. The PIF is computed from the proportion of the population exposed to smoking and the
relative risk quantifying the association between smoking and lung cancer. We used a
relative risk of 9.9 among male smokers compared to never smokers, and a relative risk of
7.6 among female smokers [13]. PIF is specific for each disease-risk factor association (here,
lung cancer and smoking), for a specific age, sex and education combination and for a
specific point in time.
A time component accounts for the delay between exposure to tobacco and the onset of lung
cancer and is represented by latency (LAT) and lag time (LAG). LAT is the time between a
change in smoking rate and a change in lung cancer incidence. LAG is the time needed for a
formerly exposed (or unexposed) person to return to the risk of an unexposed (or exposed)
person, decreasing (or increasing) in an exponential manner. We set LAT at 7 years, and
LAG at 25 years. These values are consistent with the available evidence on decrease in
lung cancer incidence rates after stopping smoking [14, 15]. As a result, a change in smoking
prevalence does not change the PIF for the first 7 years. After that it changes exponentially
Because of the exponential relationship, most of the decrease occurred during the first 10
years of this 25 year decrease.
The PIF associated with a specific point in time is multiplied with the lung cancer incidence
rate of the base year to calculate the incidence at that point in time. Baseline incidence by
education was obtained from the Danish Cancer Society for the year 2004 [7]. In addition,
Prevent also allows an autonomous trend in lung cancer incidence, which is the trend that
would be observed in the absence of changes in smoking.
The main results of this paper were based on the assumption that lung cancer trends were
fully driven by the changes in smoking. In additional analyses, we assumed an autonomous
trend that accounted for past exposure to asbestos, which is the second major risk factor for
lung cancer [16]. The excess lung cancer cases due to exposure to asbestos can be
estimated from the number of mesothelioma observed, the latter being almost entirely
caused by exposure to asbestos [16]. Reviews have estimated the ratio of excess lung
cancer cases due to exposure to asbestos relative to mesothelioma cases. We used a ratio
of 2 lung cancers for 1 mesothelioma, which is suggested to be conservative in a recent
report [17]. Based on this ratio, we derived the autonomous trend for lung cancer incidence
from the estimated annual percent change observed in Denmark for male mesothelioma
incidence [18]. The trend was assigned to men with low and middle education aged 40 years
or older. We did not assign this trend to women and to high educated men as the level of
asbestos exposure was very low in these groups.
Demographic data was needed to estimate future lung cancer incidence rates. First, annual
all-cause mortality rates for the base year were estimated per education level by taking into
account estimates of mortality by education level during the 1990s for a national sample of
the Danish population [19]. Further, information on population size projected for the years
from the general population and was not available by education level. Therefore, we did not
present number of lung cancer cases by education but presented incidence rates only.
Smoking prevalence was estimated as a function of smoking initiation and cessation rates,
all estimated per age, sex and educational level. Smoking prevalence was computed
cohort-wise. We assumed smoking to be 0 below age 20 and smoking initiation to be effectuated
and completed at age 20. We then applied age-, sex-, period- and education-specific
cessation rates to compute smoking prevalence by age among people over 20.
Historical smoking prevalence data was obtained from the Danish National Health Interview
Survey in 1987, 1994, 2000 and 2005 (Table 1) [11]. For the period between 1987 and 2005,
cessation rates were computed with the model proposed by Mendez and colleagues [20],
taking into account population dynamics (number of people who started smoking, stopped
smoking, and died in each age group) and using the historical data on smoking and on
population size.
To estimate future cessation rates by age, sex and education, we used unpublished rates
available from an Italian study on smoking cessation rates of high and low educated Italian
men (Federico et al, 2009) (Table 2). This choice was based on the available evidence but
presents limitations that will be discussed later. We computed cessation rates among middle
educated people as the average between low and high educated people. The cessation rates
were assumed to be similar for men and women. Among low educated people, cessation
rates were higher among people aged 50+ years (4.25% smokers successfully quit per year)
than among their younger counterparts (2.53% and 2.58% cessation rates for the age group
20-30 and 30-50 respectively). Among high educated people, cessation rates were generally
higher and more similar by age group: 4.03% among people aged 20-30, 3.44% among
those aged 30-50, and 3.965% among people aged 50+.
We defined a baseline scenario and four smoking reduction scenarios derived from this
Baseline scenario
In this scenario, future smoking cessation and initiation rates remained at the 2005 level.
Cessation rates are presented in Table 2 and initiation rates are those observed for the age
group 20-24 in 2005 (Table 1).
Initiation scenario
This scenario assumed a 50% decrease in initiation rates during the next 15 years, so that
initiation rates are halved in 2020 compared to the baseline year (2005). This corresponded
to a 4.5% yearly decrease in smoking initiation rates in each educational group.
Cessation scenario
This scenario assumed a 50% increase in cessation rates for all age groups during the next
15 years. This corresponds to a 2.9% yearly increase in smoking cessation rates in each
educational group.
Combined scenario
This scenario combined the two previous scenarios. During the next 15 years, initiation rates
were halved and there would be a 50% increase in cessation rates.
Levelling-up scenario
We assumed that the cessation rates and the initiation rates of those with lower and mid
educational levels converge during the next 15 years towards the levels of the highly
educated people as observed at baseline.
Measure of socioeconomic inequalities
We computed age-standardised lung cancer incidence rates with the 2005 Danish population
as the standard. We computed the rate ratio between low or middle relative to high educated
Results
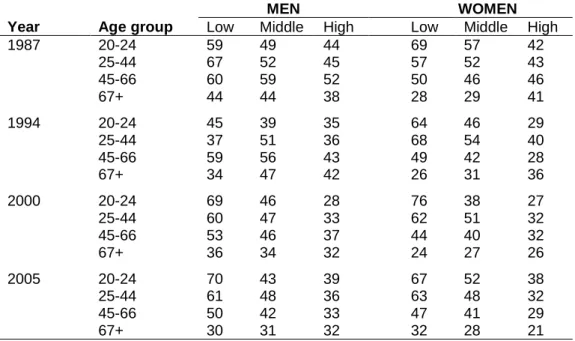
Smoking prevalence generally decreased between 1987 and 2005 for all education groups
among men and women (Table 1). Educational differences were observed in smoking
prevalence with higher rates associated with lower education both in men and women. In
2005 smoking prevalence was rather similar for men and women in each educational group.
Smoking prevalence decreased at every age for all education groups.
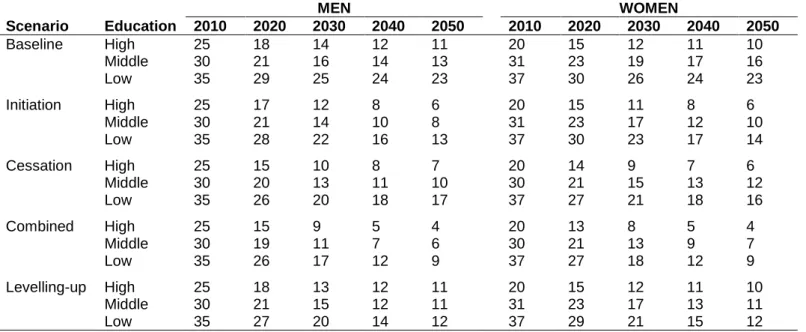
Relative differences in smoking prevalence between the scenarios beg in to change in 2030
(Table 3). The cessation scenario differed the least from the baseline scenario. The lowest
smoking prevalence was found with the combined scenario, followed by the initiation
scenario. For the levelling-up scenario, smoking prevalence hardly differed between
educational groups from 2040 onwards.
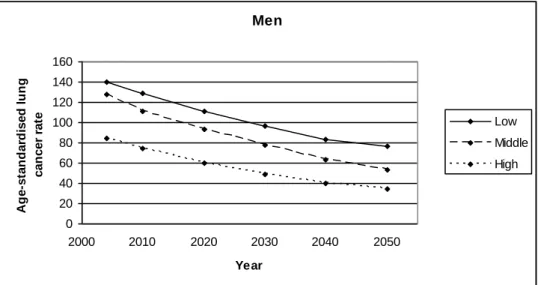
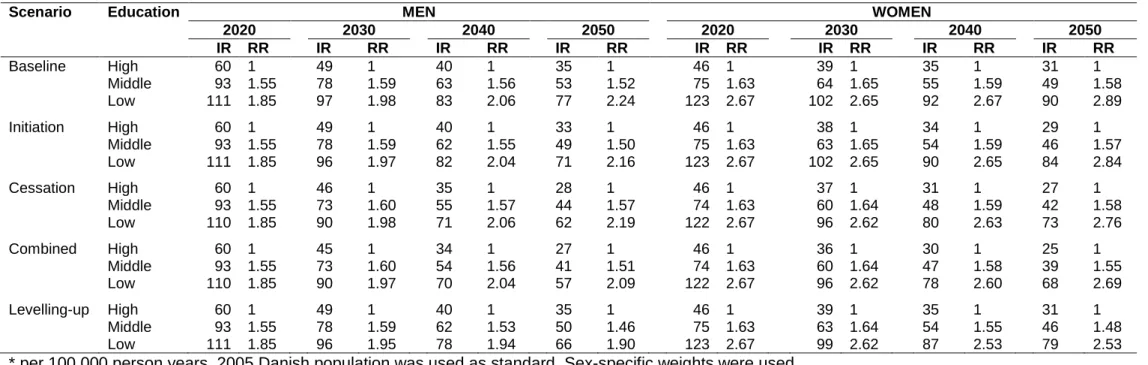
Educational inequalities in lung cancer incidence were observed in Denmark in 2004 with
higher rates among lower educated persons (Figure 1). Rates for high educated women
remained low until age 70. Under the baseline scenario, age-standardised (using 2005
Danish population), lung cancer incidence rates decrease from 140 (per 100,000 person
years) in 2004 to 77 in 2050, from 128 to 53 and from 84 to 35 among men with low, middle
or high education respectively (Figure 2). The decrease is proportionally smaller for low
educated men compared to middle and high educated men. The decrease in lung cancer
incidence rates was less pronounced among women. Female lung cancer incidence rates
were seen to decrease only after 2020 among low educated women with only slight
decreases in incidence rates between 2004 and 2020 for middle educated women. From
2004 to 2050, the incidence rates are expected to decrease from 129 to 90, from 85 to 49
and from 56 to 31 among low, middle and high educated women respectively (Figure 2). In
2004, the gradient was more pronounced among women (ratio IR low/high=2.30) than
women over the whole period whereas they increased for low educated men and women
(Table 4).
Table 4 shows the projected incidence rates and rate ratios under the different scenarios for
the years 2020, 2030, 2040 and 2050. The difference in incidence rates between the
baseline scenario and the alternative scenarios becomes evident from 2030 onwards. For
the initiation scenario, the incidence rates differed from those observed under the baseline
scenario in 2050, especially for low educated men and women. The lung cancer rates are
substantially lower in the cessation and the combined scenarios for all educational groups. In
2050, the difference in incidence rates between the baseline and the combined scenario was
more important for low educated men (20 per 100,000 person years) or women (22 per
100,000) than for the other educational groups.
In terms of rate ratios for educational differences in lung cancer incidence, the most
favourable situation will be observed for the levelling-up scenario, where rate ratios will
remain stable over the period. Rate ratios were observed to slightly increase for all other
scenarios.
Discussion
We investigated time trends in educational differences in lung cancer incidence under
different scenarios aimed at reducing tobacco consumption, either by increasing cessation or
lowering levels of initiation. The effect of the alternative scenarios becomes noticeable from
2030 onwards, when compared with the baseline scenario. The largest decrease in lung
cancer rates will be observed in the cessation and the combined scenarios. No decrease in
relative inequality will be observed over the whole period for all scenarios except the
Strengths and limits of Prevent have been thoroughly discussed elsewhere [12]. Projections
is a complex exercise that implies approximations, in which one focuses only on a few
variables while ignoring the rest. Because any changes in smoking prevalence will start to
have a visible impact on lung cancer incidence about 15 years later, long-term projections
are the only way to investigate future impacts of smoking reduction on lung cancer incidence.
The drawback is that long-term modelling goes along with more uncertainties in the
estimates, stemming from uncertainties in the baseline trends of smoking or in risk factors
not included in the model. Results can therefore not be interpreted as exact predictions but
will allow us to assess the effect of different smoking reduction scenarios. A difference in
estimated lung cancer incidence between two different scenarios will be related to the
difference between the two scenarios in terms of smoking prevalence.
As for any modelling exercise, data quality is a major issue as the outcome directly depends
on the input data. Lung cancer incidence by educational level was available from a project
linking the Danish Cancer Register with education information from Statistics Denmark at the
individual level. We had 17 years of historical smoking data from reliable national surveys
including information on education with a coding similar to that available for lung cancer data.
However, smoking prevalence before age 20 was not available by education in
cross-sectional surveys as education is not completed for most people. As a result, we had to
assume that smoking initiation was completed at age 20 and that nobody smoked before age
20. Consequently, we may have underestimated smoking exposure, and more so among low
educated subjects as they take up smoking earlier than their more educated counterparts
[21]. Also, we only had information on smoking status, whereas lung cancer risk also is
determined by intensity and duration of smoking [16]. However, the amount of cigarettes per
smoker does not greatly differ by education level [22].
We assumed no autonomous trend in lung cancer incidence rates. This means that all
literature, however, suggests that smoking does not totally account for socioeconomic
inequalities in lung cancer incidence, which partly may be explained by residual confounding
from smoking [8, 23] and other risk factors including occupational exposures [24]. We
conducted additional analyses with an autonomous trend in lung cancer incidence
accounting for past exposure to asbestos among low and middle educated men aged 40+
(results not shown). Expected lung cancer incidence rates including this autonomous trend
were slightly higher in these educational groups and socioeconomic inequalities were more
pronounced. Our main conclusions however did not change, probably because smoking is
responsible for the majority of lung cancer cases.
The education level of the population is increasing over time. In 2005, slightly more than half
of the Danish population had tertiary education (53% of men and 58% of women) whereas
34% of men and 22% of women had vocational education. The share of the population with
low education was low and is likely to decrease further in future years. The projected
incidence rates for the lowest education group would therefore refer to an increasingly
smaller group in the future. Despite this, inequalities are likely to be an important problem in
future years in Denmark as well, because differences in lung cancer incidence are also
observed between the two highest education groups. In addition, studies on time trends in
socioeconomic inequality in lung cancer do not report any clear decrease in inequality [25],
even when the measure of inequality accounted for changes in the socioeconomic
distribution of the population [26-28]. Furthermore, although the mean education level will
increase during the next decades, an important degree of educational stratification will
remain within the national population.
The parameters of the baseline scenario should be discussed. Little information is available
regarding cessation rates by education in Denmark. Estimates that are available are derived
from cross-sectional data, which mixes cohort, age and period effects [29]. Danish data on
the estimates that were available from an Italian study. We selected male cessation rates as
smoking histories strongly differ between Italian and Danish women, but much less so for
men. The Italian data indicate higher smoking cessation rates among higher educated
people as consistently suggested by indirect estimates for Denmark [30] and elsewhere [29,
31-33]. The education-specific cessation rates used were in line with those observed for
Spain [31], Italy [34] or the US [33].
Tobacco price increase, bans on smoking advertising, smoking bans at school and
anti-smoking education have all been found to affect anti-smoking initiation rates in the population
[35]. The most effective policies for smoking cessation were taxation policies and smoking
bans: cessation rates were increased by 3-5% with a 10% increase in price and by 12-38%
with comprehensive clean indoor laws [36]. Moreover, little is known on the differential effect
of these policies by socioeconomic status (SES), although it has been suggested that bans
on TV advertising or anti-smoking education may be more effective in reducing initiation
rates among young people from low SES groups [35, 37, 38]. Although recent evidence
suggested that high and low educated smokers benefit equally from the nationwide tobacco
control policies [39], specific policies may have differential effect by SES on smoking
cessation. There is no evidence regarding a differential effect of smoking bans in public
places and in the work place [35, 38]. Media campaigns are generally shown to have a larger
effect on high SES smokers or no differential effect by SES. They may nevertheless be most
effective among low SES smokers when implemented within a part of more comprehensive
tobacco control policies [37, 38, 40]. Bans on TV advertising may be more successful among
low SES smokers [37]. Support for smoking cessation via telephone help lines has been
shown to be effective among low SES smokers, especially with a follow-up from the
counsellors, whereas the price of nicotine replacement therapy may be a barrier for low SES
smokers if not offered freely [37]. Conflicting findings have been reported regarding the effect
of price increase by SES, with some observing greater effect among high SES smokers [41]
(income, education or occupation) considered [38] or vary over time [42]. Finally, more
comprehensive tobacco control policies have been shown to be more effective in increasing
the number of smokers who attempt quitting, and who are successful in these attempts [39].
Denmark has gradually implemented a number of tobacco control policies. Most have been
implemented during the 2000s: smoking ban in school in 2001, ban on smoking advertising
in 2002, sell of tobacco prohibited to people younger than 16 in 2004 and changed to 18 in
2008, a more general smoking ban in 2007, and a 10% increase in cigarette prices twice in
2010. These policies may be more efficient in decreasing smoking prevalence among young
subjects, and more so among low SES groups. These policies have yet to affect lung cancer
rates and we can thus expect larger decrease in smoking prevalence, and consequently
larger decrease in inequalities in lung cancer rates in future years.
Despite large decrease in lung cancer incidence rates, we observed that relative inequalities
between educational groups would be stable or even increasing during the period
2005-2050. This trend fits the general pattern that relative inequalities tend to increase when the
occurrence of a health problem in the population decreases [43]. Nonetheless, under all
smoking reduction scenarios, a substantial absolute number of lung cancer cases would be
avoided, among both lower and higher educated people. The lack of decrease in inequalities
is also partly due to the definition of the scenarios. The levelling-up scenario, however,
showed that relative inequalities in lung cancer incidence would decrease only if special
efforts were to be made to reduce the gap in smoking between high and low educated
groups. This scenario however also showed that reducing this gap alone does not bring
down absolute levels of lung cancer incidence to a great extent, and only at a longer run.
Cancer prevention works on a long-time scale. The incidence rates in the next decade are
nearly completely determined by past smoking exposure. Even though this result may be
forgotten in public health policies. We need scenarios based on population health models like
Prevent to demonstrate that some actions take much time to have their full effect. With
regards to smoking, because any change in smoking prevalence is likely to be gradual, any
effect of alternative smoking policies on lung cancer incidence is not expected to be
noticeable before the year 2030. As shown by our results, the levelling-up scenario will level
out educational differences in smoking prevalence in 2050 only and it will take 20 to 30 more
years before it fully impacts lung cancer rates. Increasing smoking cessation rates among
adults will be the most effective way to decrease lung cancer rates within a few decades.
Even though lowering initiation rates may be the most effective way to prevent high smoking
prevalence among young generations, the effect on change in smoking prevalence in the
population at large will be visible only on a long time scale. Therefore the success of
anti-smoking policies in decreasing overall levels and socio-economic inequalities in lung cancer
incidence will be evident only on a very long time scale. These policies are however likely to
show an earlier impact on other diseases such as cardiovascular diseases that have a much
shorter latency period.
Conclusion
Decreasing socioeconomic inequalities in lung cancer incidence is a major public health
challenge. This paper illustrates what could be achieved under different realistic scenarios for
smoking reduction. The decrease in socioeconomic inequalities may be modest even after
several decades. However, we observed a substantial decrease in lung cancer rates for all
educational groups, which means a significant number of lung cancer cases avoided. Our
results also underline the need for implementing anti-smoking policies focused both on
cessation rates (to bring important benefits to older generations at shorter run) and initiation
rates (to bring even greater benefits to younger generations at longer run).
A
CKNOWLEDGEMENTS
We thank Susanne Dalton, Institute of Cancer Epidemiology, Danish Cancer Society for
providing us with lung cancer incidence by education in Denmark in 2004. This project is
funded through the Eurocadet project (contract nb: SP23-CT-2005-006528).
C
ONFLICT OF INTEREST STATEMENT
Figure 1: Age-specific lung cancer incidence rate (per 100,000 person years) in Denmark in
2004 by sex and education level [7]
Men 0 100 200 300 400 500 600 30-34 35-39 40-44 45-49 50-54 55-59 60-64 65-69 70-74 75+ Age Lu ng c a nc e r ra te Low Middle High Wom en 0 100 200 300 400 500 600 30-34 35-39 40-44 45-49 50-54 55-59 60-64 65-69 70-74 75+ Age Lu ng c a nc e r ra te Low Middle High
Figure 2: Age-standardised lung cancer incidence rates (per 100,000 person years) in 2004,
2010, 2020, 2030, 2040 and 2050 by sex and education level. Baseline scenario
Men 0 20 40 60 80 100 120 140 160 2000 2010 2020 2030 2040 2050 Year A g e -s ta n d a rd is e d l u n g c a n c e r ra te Low Middle High Women 0 20 40 60 80 100 120 140 160 2000 2010 2020 2030 2040 2050 Year A g e -s ta n d a rd is e d l u n g c a n c e r ra te Low Middle High
Table 1: Age-specific smoking prevalence by education, gender, and calendar year between
1987 and 2005 in Denmark
MEN WOMEN
Year Age group Low Middle High Low Middle High
1987 20-24 59 49 44 69 57 42 25-44 67 52 45 57 52 43 45-66 60 59 52 50 46 46 67+ 44 44 38 28 29 41 1994 20-24 45 39 35 64 46 29 25-44 37 51 36 68 54 40 45-66 59 56 43 49 42 28 67+ 34 47 42 26 31 36 2000 20-24 69 46 28 76 38 27 25-44 60 47 33 62 51 32 45-66 53 46 37 44 40 32 67+ 36 34 32 24 27 26 2005 20-24 70 43 39 67 52 38 25-44 61 48 36 63 48 32 45-66 50 42 33 47 41 29 67+ 30 31 32 32 28 21
Table 2: Cessation rates by education, gender, and age group applied to the baseline
scenario* Age Education 20-30 30-50 50+ Low 0.0253 0.0258 0.0425 Middle 0.0328 0.0301 0.0411 High 0.0403 0.0344 0.0397
*: These cessation rates were used to project smoking prevalence between 2006 and 2050.
Table 3: Age-standardised smoking prevalence by education, gender, calendar year
according to different smoking scenarios between 2010 and 2050 in Denmark
MEN WOMEN Scenario Education 2010 2020 2030 2040 2050 2010 2020 2030 2040 2050 Baseline High 25 18 14 12 11 20 15 12 11 10 Middle 30 21 16 14 13 31 23 19 17 16 Low 35 29 25 24 23 37 30 26 24 23 Initiation High 25 17 12 8 6 20 15 11 8 6 Middle 30 21 14 10 8 31 23 17 12 10 Low 35 28 22 16 13 37 30 23 17 14 Cessation High 25 15 10 8 7 20 14 9 7 6 Middle 30 20 13 11 10 30 21 15 13 12 Low 35 26 20 18 17 37 27 21 18 16 Combined High 25 15 9 5 4 20 13 8 5 4 Middle 30 19 11 7 6 30 21 13 9 7 Low 35 26 17 12 9 37 27 18 12 9 Levelling-up High 25 18 13 12 11 20 15 12 11 10 Middle 30 21 15 12 11 31 23 17 13 11 Low 35 27 20 14 12 37 29 21 15 12
Initiation: 50% decrease in initiation rate by 2020; Cessation: 50% in cessation rates by
2020; Combined: combines initiation and cessation scenarios; Levelling-up: convergence
Table 4: Age-adjusted lung cancer incidence rates* (IR) and rate ratios (RR) by scenarios, calendar year, sex and education level.
Scenario Education MEN WOMEN
2020 2030 2040 2050 2020 2030 2040 2050 IR RR IR RR IR RR IR RR IR RR IR RR IR RR IR RR Baseline High 60 1 49 1 40 1 35 1 46 1 39 1 35 1 31 1 Middle 93 1.55 78 1.59 63 1.56 53 1.52 75 1.63 64 1.65 55 1.59 49 1.58 Low 111 1.85 97 1.98 83 2.06 77 2.24 123 2.67 102 2.65 92 2.67 90 2.89 Initiation High 60 1 49 1 40 1 33 1 46 1 38 1 34 1 29 1 Middle 93 1.55 78 1.59 62 1.55 49 1.50 75 1.63 63 1.65 54 1.59 46 1.57 Low 111 1.85 96 1.97 82 2.04 71 2.16 123 2.67 102 2.65 90 2.65 84 2.84 Cessation High 60 1 46 1 35 1 28 1 46 1 37 1 31 1 27 1 Middle 93 1.55 73 1.60 55 1.57 44 1.57 74 1.63 60 1.64 48 1.59 42 1.58 Low 110 1.85 90 1.98 71 2.06 62 2.19 122 2.67 96 2.62 80 2.63 73 2.76 Combined High 60 1 45 1 34 1 27 1 46 1 36 1 30 1 25 1 Middle 93 1.55 73 1.60 54 1.56 41 1.51 74 1.63 60 1.64 47 1.58 39 1.55 Low 110 1.85 90 1.97 70 2.04 57 2.09 122 2.67 96 2.62 78 2.60 68 2.69 Levelling-up High 60 1 49 1 40 1 35 1 46 1 39 1 35 1 31 1 Middle 93 1.55 78 1.59 62 1.53 50 1.46 75 1.63 63 1.64 54 1.55 46 1.48 Low 111 1.85 96 1.95 78 1.94 66 1.90 123 2.67 99 2.62 87 2.53 79 2.53
* per 100,000 person years, 2005 Danish population was used as standard. Sex-specific weights were used.
Initiation: 50% decrease in initiation rate by 2020; Cessation: 50% increase in cessation rates by 2020; Combined: combines initiation and
REFERENCES
1. Ferlay J, Bray F, Pisani P, Parkin DM. GLOBOCAN 2002: Cancer Incidence, Mortality and Prevalence Worldwide IARC CancerBase No. 5. 2.0 ed. Lyon: IARCPress; 2004.
2. Ferlay J, Parkin DM, Steliarova-Foucher E. Estimates of cancer incidence and mortality in Europe in 2008. Eur J Cancer 2010 Mar;46(4):765-81.
3. Karim-Kos HE, de Vries E, Soerjomataram I, Lemmens V, Siesling S, Coebergh JW. Recent trends of cancer in Europe: A combined approach of incidence, survival and mortality for 17 cancer sites since the 1990s. Eur J Cancer 2008 Jul;44(10):1345-89.
4. Danaei G, Vander Hoorn S, Lopez AD, Murray CJ, Ezzati M. Causes of cancer in the world: comparative risk assessment of nine behavioural and environmental risk factors.
Lancet 2005 Nov 19;366(9499):1784-93.
5. Mackenbach JP, Huisman M, Andersen O, et al. Inequalities in lung cancer mortality by the educational level in 10 European populations. Eur J Cancer 2004;40(1):126-35.
6. Mackenbach JP, Stirbu I, Roskam AJ, et al. Socioeconomic inequalities in health in 22 European countries. N Engl J Med 2008 Jun 5;358(23):2468-81.
7. Dalton S, Steding-Jessen M, Engholm G, Schüz J, Olsen J. Social inequality and incidence of and survival from lung cancer in a population-based study in Denmark, 1994-2003. Eur J Cancer 2008;44(14):1989-95.
8. Menvielle G, Boshuizen H, Kunst AE, et al. The role of smoking and diet in explaining educational inequalities in lung cancer incidence. J Natl Cancer Inst 2009 Mar 4;101(5):321-30.
9. Hart CL, Hole DJ, Gillis CR, Davey Smith G, Watt GC, Hawthorne VM. Social class differences in lung cancer mortality: risk factor explanations using two Scottish cohort studies. Int J Epidemiol 2001;30(2):268-74.
10. Veerman JL, Barendregt JJ, Mackenbach JP, Brug J. Using epidemiological models to estimate the health effects of diet behaviour change: the example of tailored fruit and vegetable promotion. Public Health Nutr 2006 Jun;9(4):415-20.
11. Ekholm O, Hesse U, Davidsen M, Kjoller M. The study design and characteristics of the Danish national health interview surveys. Scand J Public Health 2009 Sep;37(7):758-65. 12. Soerjomataram I, de Vries E, Engholm G, et al. Impact of smoking and alcohol intervention program on lung and breast cancer incidence in Denmark: an example of dynamic modeling with Prevent. Eur J Cancer in press.
13. Gandini S, Botteri E, Iodice S, et al. Tobacco smoking and cancer: a meta-analysis.
Int J Cancer 2008 Jan 1;122(1):155-64.
14. Leffondre K, Abrahamowicz M, Xiao Y, Siemiatycki J. Modelling smoking history using a comprehensive smoking index: application to lung cancer. Stat Med 2006 Dec 30;25(24):4132-46.
15. Thun MJ, Henley SJ, Burns D, Jemal A, Shanks TG, Calle EE. Lung cancer death rates in lifelong nonsmokers. J Natl Cancer Inst 2006 May 17;98(10):691-9.
16. Blot WJ, Fraumeni JF, Jr. Cancers of the lung and pleura. In: Schottenfeld D, Fraumeni JF, Jr., editors. Cancer epidemiology and prevention. New York: Oxford University Press; 1996. p. 637-65.
17. Group W. The Burden of Cancer Caused by Asbestos. Lyon; in press.
18. Montanaro F, Bray F, Gennaro V, et al. Pleural mesothelioma incidence in Europe: evidence of some deceleration in the increasing trends. Cancer Causes Control 2003 Oct;14(8):791-803.
19. Eurothine. Tackling health inequalities in Europe: An integrated approach EUROTHINE. Final report: Dept of Public Health. Erasmus University Medical Centre Rotterdam. The Netherlands.; 2007.
20. Mendez D, Warner KE, Courant PN. Has smoking cessation ceased? Expected trends in the prevalence of smoking in the United States. Am J Epidemiol 1998 Aug 1;148(3):249-58.
21. Rasmussen M, Due P, Damsgaard MT, Holstein BE. Social inequality in adolescent daily smoking: has it changed over time? Scand J Public Health 2009 May;37(3):287-94. 22. Cavelaars AE, Kunst AE, Geurts JJ, et al. Educational differences in smoking: international comparison. BMJ 2000;320(7242):1102-07.
23. Mao Y, Hu J, Ugnat AM, Semenciw R, Fincham S. Socioeconomic status and lung cancer risk in Canada. Int J Epidemiol 2001;30(4):809-17.
24. Menvielle G, Boshuizen H, Kunst AE, et al. Occupational exposures contribute to educational inequalities in lung cancer incidence among men: Evidence from the EPIC prospective cohort study. Int J Cancer 2010 Apr 15;126(8):1928-35.
25. Steenland K, Henley J, Thun M. All-cause and cause-specific death rates by educational status for two million people in two American Cancer Society cohorts, 1959-1996. Am J Epidemiol 2002;156(1):11-21.
26. Borrell C, Azlor E, Rodriguez-Sanz M, et al. Trends in socioeconomic mortality inequalities in a southern European urban setting at the turn of the 21st century. J Epidemiol
Community Health 2008 Mar;62(3):258-66.
27. Turrell G, Mathers C. Socioeconomic inequalities in all-cause and specific-cause mortality in Australia: 1985-1987 and 1995-1997. Int J Epidemiol 2001;30(2):231-39.
28. Menvielle G, Chastang JF, Luce D, Leclerc A. Temporal trends in socioeconomic inequality in mortality in France between 1968 and 1996. Study of educational differences by cause of death. Rev Epidemiol Sante Publique 2007;55:e1-e8.
29. Giskes K, Kunst AE, Benach J, et al. Trends in smoking behaviour between 1985 and 2000 in nine European countries by education. J Epidemiol Community Health 2005;59(5):395-401.
30. Pisinger C, Vestbo J, Borch-Johnsen K, Jorgensen T. Smoking cessation intervention in a large randomised population-based study. The Inter99 study. Prev Med 2005 Mar;40(3):285-92.
31. Schiaffino A, Fernandez E, Kunst A, et al. Time trends and educational differences in the incidence of quitting smoking in Spain (1965-2000). Prev Med 2007 Aug-Sep;45(2-3):226-32.
32. Federico B, Costa G, Kunst AE. Educational inequalities in initiation, cessation, and prevalence of smoking among 3 Italian birth cohorts. Am J Public Health 2007 May;97(5):838-45.
33. Gilpin EA, Pierce JP. Demographic differences in patterns in the incidence of smoking cessation: United States 1950-1990. Ann Epidemiol 2002 Apr;12(3):141-50.
34. Federico B, Costa G, Ricciardi W, Kunst AE. Educational inequalities in smoking cessation trends in Italy, 1982-2002. Tob Control 2009 Oct;18(5):393-8.
35. Main C, Thomas S, Ogilvie D, et al. Population tobacco control interventions and their effects on social inequalities in smoking: placing an equity lens on existing systematic reviews. BMC Public Health 2008;8:178.
36. Lemmens V, Oenema A, Knut IK, Brug J. Effectiveness of smoking cessation interventions among adults: a systematic review of reviews. Eur J Cancer Prev 2008 Nov;17(6):535-44.
37. Giskes K, Kunst AE, Ariza C, et al. Applying an equity lens to tobacco-control policies and their uptake in six Western-European countries. J Public Health Policy 2007 Jul;28(2):261-80.
38. Thomas S, Fayter D, Misso K, et al. Population tobacco control interventions and their effects on social inequalities in smoking: systematic review. Tob Control 2008 Aug;17(4):230-7.
39. Schaap MM, Kunst AE, Leinsalu M, et al. Effect of nationwide tobacco control policies on smoking cessation in high and low educated groups in 18 European countries. Tob
Control 2008 Aug;17(4):248-55.
40. Niederdeppe J, Fiore MC, Baker TB, Smith SS. Smoking-cessation media campaigns and their effectiveness among socioeconomically advantaged and disadvantaged populations. Am J Public Health 2008 May;98(5):916-24.
41. Regidor E, Pascual C, Gutierrez-Fisac JL. Increasing the price of tobacco: economically regressive today and probably ineffective tomorrow. Eur J Cancer Prev 2007 Aug;16(4):380-4.
42. Franks P, Jerant AF, Leigh JP, et al. Cigarette prices, smoking, and the poor: implications of recent trends. Am J Public Health 2007 Oct;97(10):1873-7.
![Figure 1: Age-specific lung cancer incidence rate (per 100,000 person years) in Denmark in 2004 by sex and education level [7]](https://thumb-eu.123doks.com/thumbv2/123doknet/14542787.535667/18.892.108.656.182.794/figure-specific-cancer-incidence-person-years-denmark-education.webp)