Frequency comb metrology with an optical
parametric oscillator
K. Balskus,1,* S. Schilt,2 V. J. Wittwer,2 P. Brochard,2 T. Ploetzing,3 N. Jornod,2 R. A.
McCracken,1 Z. Zhang,1 A. Bartels,3 D.T. Reid,1 and T. Südmeyer2 1Institute of Photonics and Quantum Sciences, SUPA, Heriot-Watt University, Edinburgh, EH14 4AS, UK
2Laboratoire Temps-Fréquence, Université de Neuchâtel, CH-2000 Neuchâtel, Switzerland 3Laser Quantum GmbH, D-78467 Konstanz, Germany
*kb202@hw.ac.uk
Abstract: We report on the first demonstration of absolute frequency comb metrology with an optical parametric oscillator (OPO) frequency comb. The synchronously-pumped OPO operated in the 1.5-µm spectral region and was referenced to an H-maser atomic clock. Using different techniques, we thoroughly characterized the frequency noise power spectral density (PSD) of the repetition rate frep, of the carrier-envelope offset frequency fCEO, and of an optical comb line νN. The comb mode optical linewidth at 1557 nm
was determined to be ~70 kHz for an observation time of 1 s from the measured frequency noise PSD, and was limited by the stability of the microwave frequency standard available for the stabilization of the comb repetition rate. We achieved a tight lock of the carrier envelope offset frequency with only ~300 mrad residual integrated phase noise, which makes its contribution to the optical linewidth negligible. The OPO comb was used to measure the absolute optical frequency of a near-infrared laser whose second-harmonic component was locked to the F = 2→3 transition of the 87Rb D2 line at 780 nm, leading to a measured transition frequency of νRb = 384,228,115,346 ± 16 kHz. We performed the same measurement with a commercial fiber-laser comb operating in the 1.5-µm region. Both the OPO comb and the commercial fiber comb achieved similar performance. The measurement accuracy was limited by interferometric noise in the fibered setup of the Rb-stabilized laser.
OCIS codes: (320.7110) Ultrafast nonlinear optics; (190.4970) Parametric oscillators and
amplifiers; (140.3425) Laser stabilization; (120.3930) Metrological instrumentation.
References and links
1. D. J. Jones, S. A. Diddams, J. K. Ranka, A. Stentz, R. S. Windeler, J. L. Hall, and S. T. Cundiff, “Carrier-envelope phase control of femtosecond mode-locked lasers and direct optical frequency synthesis,” Science
288(5466), 635–639 (2000).
2. H. R. Telle, G. Steinmeyer, A. E. Dunlop, J. Stenger, D. H. Sutter, and U. Keller, “Carrier-envelope offset phase control: A novel concept for absolute optical frequency measurement and ultrashort pulse generation,” App. Phys. B 69, 327–332 (1999).
3. T. Udem, J. Reichert, R. Holzwarth, and T. W. Hänsch, “Absolute optical frequency measurement of the Cesium D1 line with a mode-locked laser,” Phys. Rev. Lett. 82(18), 3568–3571 (1999).
4. S. A. Diddams, D. J. Jones, J. Ye, S. T. Cundiff, J. L. Hall, J. K. Ranka, R. S. Windeler, R. Holzwarth, T. Udem, and T. W. Hänsch, “Direct link between microwave and optical frequencies with a 300 THz femtosecond laser comb,” Phys. Rev. Lett. 84(22), 5102–5105 (2000).
5. R. Holzwarth, T. Udem, T. W. Hänsch, J. C. Knight, W. J. Wadsworth, and P. S. J. Russell, “Optical frequency synthesizer for precision spectroscopy,” Phys. Rev. Lett. 85(11), 2264–2267 (2000).
6. T. Udem, J. Reichert, R. Holzwarth, and T. W. Hänsch, “Accurate measurement of large optical frequency differences with a mode-locked laser,” Opt. Lett. 24(13), 881–883 (1999).
7. B. R. Washburn, S. A. Diddams, N. R. Newbury, J. W. Nicholson, M. F. Yan, and C. G. Jørgensen, “Phase-locked, erbium-fiber-laser-based frequency comb in the near infrared,” Opt. Lett. 29(3), 250–252 (2004). 8. F. Adler, K. Moutzouris, A. Leitenstorfer, H. Schnatz, B. Lipphardt, G. Grosche, and F. Tauser, “Phase-locked
two-branch erbium-doped fiber laser system for long-term precision measurements of optical frequencies,” Opt. Express 12(24), 5872–5880 (2004).
9. J. Jiang, J. E. Bernard, A. A. Madej, A. Czajkowski, S. Drissler, and D. J. Jones, “Measurement of acetylene-d absorption lines with a self-referenced fiber laser frequency comb,” J. Opt. Soc. Am. B 24(10), 2727–2735 (2007).
10. T. R. Schibli, K. Minoshima, F.-L. Hong, H. Inaba, A. Onae, H. Matsumoto, I. Hartl, and M. E. Fermann, “Frequency metrology with a turnkey all-fiber system,” Opt. Lett. 29(21), 2467–2469 (2004).
11. W. Hänsel, M. Giunta, K. Beha, M. Lezius, M. Fischer, and R. Holzwarth, “Ultra-low phase noise all-PM Er:fiber optical frequency comb,” in Advanced Solid State Lasers (2015) (Optical Society of America, 2015), paper ATh4A.2.
12. J. J. McFerran, W. C. Swann, B. R. Washburn, and N. R. Newbury, “Suppression of pump-induced frequency noise in fiber-laser frequency combs leading to sub-radian fceo phase excursions,” Appl. Phys. B 86(2), 219–227
(2007).
13. F. Quinlan, T. M. Fortier, M. S. Kirchner, J. A. Taylor, M. J. Thorpe, N. Lemke, A. D. Ludlow, Y. Jiang, and S. A. Diddams, “Ultralow phase noise microwave generation with an Er:fiber-based optical frequency divider,” Opt. Lett. 36(16), 3260–3262 (2011).
14. G. Krauss, D. Fehrenbacher, D. Brida, C. Riek, A. Sell, R. Huber, and A. Leitenstorfer, “All-passive phase locking of a compact Er:fiber laser system,” Opt. Lett. 36(4), 540–542 (2011).
15. T. Nakamura, I. Ito, and Y. Kobayashi, “Offset-free broadband Yb:fiber optical frequency comb for optical clocks,” Opt. Express 23(15), 19376–19381 (2015).
16. D. Fehrenbacher, P. Sulzer, A. Liehl, T. Kälberer, C. Riek, D. V. Seletskiy, and A. Leitenstorfer, “Free-running performance and full control of a passively phase-stable Er:fiber frequency comb,” Optica 2(10), 917–923 (2015).
17. K. Kim, B. R. Washburn, G. Wilpers, C. W. Oates, L. Hollberg, N. R. Newbury, S. A. Diddams, J. W. Nicholson, and M. F. Yan, “Stabilized frequency comb with a self-referenced femtosecond Cr:forsterite laser,” Opt. Lett. 30(8), 932–934 (2005).
18. A. Alcock, P. Ma, P. Poole, S. Chepurov, A. Czajkowski, J. Bernard, A. Madej, J. Fraser, I. Mitchell, I. Sorokina, and E. Sorokin, “Ultrashort pulse Cr4+:YAG laser for high precision infrared frequency interval measurements,” Opt. Express 13(22), 8837–8844 (2005).
19. T. I. Ferreiro, J. Sun, and D. T. Reid, “Frequency stability of a femtosecond optical parametric oscillator frequency comb,” Opt. Express 19(24), 24159–24164 (2011).
20. J. H. Sun, B. J. S. Gale, and D. T. Reid, “Composite frequency comb spanning 0.4-2.4 µm from a phase-controlled femtosecond Ti:sapphire laser and synchronously pumped optical parametric oscillator,” Opt. Lett.
32(11), 1414–1416 (2007).
21. K. Balskus, Z. Zhang, R. A. McCracken, and D. T. Reid, “Mid-infrared 333 MHz frequency comb continuously tunable from 1.95 to 4.0 μm,” Opt. Lett. 40(17), 4178–4181 (2015).
22. R. Paschotta, “Timing jitter and phase noiseof mode-locked fiber lasers,” Opt. Express 18(5), 5041–5054 (2010). 23. R. A. McCracken and D. T. Reid, “Few-cycle near-infrared pulses from a degenerate 1 GHz optical parametric
oscillator,” Opt. Lett. 40(17), 4102–4105 (2015).
24. K. A. Tillman, R. Thapa, K. Knabe, S. Wu, J. Lim, B. R. Washburn, and K. L. Corwin, “Stabilization of a self-referenced, prism-based, Cr:forsterite laser frequency comb using an intracavity prism,” Appl. Opt. 48(36), 6980–6989 (2009).
25. R. Matthey, F. Gruet, S. Schilt, and G. Mileti, “Compact rubidium-stabilized multi-frequency reference source in the 1.55-μm region,” Opt. Lett. 40(11), 2576–2579 (2015).
26. J. Ye, S. Swartz, P. Jungner, and J. L. Hall, “Hyperfine structure and absolute frequency of the (87)Rb 5P(3/2) state,” Opt. Lett. 21(16), 1280–1282 (1996).
27. G. D. Boyd and D. A. Kleinman, “Parametric interaction of focused Gaussian light beams,” J. Appl. Phys. 39(8), 3597–3639 (1968).
28. T. I. Ferreiro, J. Sun, and D. T. Reid, “Locking the carrier-envelope-offset frequency of an optical parametric oscillator without f-2f self-referencing,” Opt. Lett. 35(10), 1668–1670 (2010).
29. S. Schilt, N. Bucalovic, L. Tombez, V. Dolgovskiy, C. Schori, G. Di Domenico, M. Zaffalon, and P. Thomann, “Frequency discriminators for the characterization of narrow-spectrum heterodyne beat signals: application to the measurement of a sub-hertz carrier-envelope-offset beat in an optical frequency comb,” Rev. Sci. Instrum.
82(12), 123116 (2011).
30. V. Dolgovskiy, S. Schilt, N. Bucalovic, G. Domenico, S. Grop, B. Dubois, V. Giordano, and T. Südmeyer, “Ultra-stable microwave generation with a diode-pumped solid-state laser in the 1.5-μm range,” Appl. Phys. B
116(3), 593–601 (2014).
31. G. Di Domenico, S. Schilt, and P. Thomann, “Simple approach to the relation between laser frequency noise and laser line shape,” Appl. Opt. 49(25), 4801–4807 (2010).
1. Introduction
Self-referenced femtosecond frequency combs, in which the carrier-envelope offset (CEO) frequency fCEO is stabilized using the standard f-to-2f interferometry method [1, 2], are now the method of choice for absolute optical frequency metrology. They provide a direct, low-noise and phase-coherent link between radio-frequency (RF) primary standards and the optical frequency domain [3–6]. Therefore, they constitute a key element for the comparison of optical atomic clocks that are currently under development in several metrological
institutes and whose relative frequency stability has already surpassed the best microwave primary standards. While many different solid-state and fiber-laser architectures have been demonstrated as frequency combs, only a smaller sub-set has been evaluated in the context of absolute frequency metrology. Frequency comb metrology in the near-infrared beyond 1.1 µm has principally been pursued with 1.55-µm Er:fiber combs [7], for example to measure the frequency of the inter-combination line of the Ca transition at 455.986 THz [8] or of ro-vibrational transitions of acetylene [9,10]. Fiber-based comb systems are known to generally suffer from a relatively higher frequency noise than Ti:sapphire lasers or diode-pumped solid-state lasers resulting from their higher gain and nonlinearities. This results in a free-running CEO beat linewidth that is often in the 100-kHz range, even if very recent developments that make use of all-polarization-fiber architectures have demonstrated much lower noise operation [11]. Consequently, a large feedback bandwidth is generally needed in fiber combs in order to compensate for this higher frequency noise [12], unless the system is extremely stable and isolated from environmental noise sources [13]. An elegant approach to overcome this bandwidth requirement in fiber combs is based on passive CEO cancellation using a difference frequency generation (DFG) process between two distant spectral parts of the supercontinuum spectrum generated from a fibered femtosecond laser [14] As the resulting comb has only one remaining degree of freedom, full phase stabilization of the CEO-free comb can be achieved by stabilizing the repetition frequency, for instance to an optical frequency standard. This was recently demonstrated for the stabilization of an Yb-fiber comb to an ultra-stable laser at 1 μm [15], and for the stabilization of an Er-fiber comb to a sub-Doppler two-photon Rb transition [16] with a sub-hertz relative linewidth.
A limited number of optical frequency metrology experiments using solid-state laser combs have also been reported. For example, a 1.26-µm femtosecond Cr:forsterite laser was used to measure the frequency of a stabilized 657-nm continuous wave (cw) laser [17]. Near 1.55 µm, a repetition-rate-stabilized (but not CEO self-referenced) Cr4+:YAG laser was used to determine the frequency interval between selected acetylene transition lines [18].
In the context of the above discussion, femtosecond optical parametric oscillator (OPO) frequency combs [19, 20] evidently possess a number of features that make them attractive sources for optical frequency metrology. They are widely tunable [21], allowing them to directly reach a targeted metrology wavelength. In addition, the parametric gain process is extremely low-noise as a result of the absence of contributions from spontaneous emission, which otherwise can considerably increase the noise of a modelocked laser [22]. The ability to construct femtosecond OPOs with gain media as short as 500 µm [23] means that Kerr-mediated intra-cavity intensity-noise-to-phase-noise coupling can be orders of magnitude smaller than in a fiber comb. Therefore, OPO combs can routinely achieve a tight CEO lock characterized by the presence of a coherent peak in the RF spectrum of the CEO beat signal [19] and compare favorably with the equivalent >100 kHz linewidths observed in typical Cr:forsterite [17, 24] and some Er:fiber [10] near-IR combs.
Here we report the first demonstration, to the best of our knowledge, of an OPO frequency comb for absolute optical frequency metrology. We have measured the frequency of a 1560-nm laser referenced to the 87Rb D
2 F = 2→3 transition [25], whose reference value is precisely known [26]. A commercial Er:fiber comb operating at the same wavelength as the OPO provided a benchmark system against which the performance of the OPO comb was compared. In addition, we present a detailed analysis of the noise properties of the OPO comb fully-stabilized to an RF reference, obtained by separately measuring the frequency noise of the repetition rate, of the CEO beat and of an optical line.
2. Experiment
In this section we first describe the OPO and its full stabilization, then we present the experimental methods used to thoroughly characterize it in terms of noise properties. Finally, we describe how the fully-stabilized OPO was used to measure the absolute optical frequency of a 1560-nm laser frequency-stabilized to a Rb transition.
2.1 OPO configuration and full frequency stabilization
The overall experimental layout of the OPO is presented in Fig. 1. Signal pulses with a central wavelength of 1560 nm were generated by synchronously pumping a 4-mirror ring resonator based on a 1.2-mm-long periodically poled potassium titanyl phosphate (PPKTP) crystal (Raicol Crystals) with a modelocked Ti:sapphire pump laser (Gigajet, Laser Quantum). The pump laser had a repetition rate of 333 MHz, an average power of 1.45 W and its emission spectrum was centered at a wavelength of 800 nm. The PPKTP crystal contained ten parallel gratings, each of which had a 1-mm long section that was phase-matched for parametric down-conversion (grating period Λ = 25.4–27.25 µm). Further details of the crystal design were reported by Balskus et al. [21], which described an idler-stabilized frequency comb, as distinct from the signal-stabilized comb reported here.
The OPO used two concave focusing mirrors (M2, M3) with a radius of curvature of 75 mm which confined the oscillating signal wave to a 30-µm (1/e2) beam radius inside the PPKTP crystal at a signal wavelength of 1.55 µm. The pump beam was focused through the curved mirror M2 by a lens with a 63-mm focal length to produce a beam waist radius of 17-µm (1/e2) to fulfill the Boyd-Kleinman condition [27]. The 4-mirror resonator was highly reflective for the signal pulses in the spectral range from 980 to 1620 nm and its mirrors (M2– M5) had high transmission for both pump and idler wavelengths in the range of 750 to 850 nm and 1700 to 4500 nm, respectively. The output wavelength of the OPO signal was adjusted to 1560 nm by operating on a grating with Λ = 26.6 µm and by fine-tuning the cavity length. A 90% beam-splitter (BS1) reflected most of the Ti:sapphire laser power into the OPO, whereas the remaining 10% was coupled into a 30-cm long photonic crystal fiber (PCF) for super-continuum (SC) generation. A portion of the SC spectrum close to 530 nm was heterodyned with the pump-signal sum-frequency generation (SFG) component produced in the OPO crystal. After spectral filtering with a diffraction grating, a heterodyne signal suitable for fCEO detection was obtained.
Fig. 1. Layout of the PPKTP crystal-based OPO; M1-M11: mirrors; OC: output coupler; PD: photodiode; PBS: polarizing beam splitter; DG: diffraction grating; APD: avalanche photodiode; PCF: photonic crystal fiber; BS: beam splitter; BPF: band-pass filter; LPF: low-pass filter; HVA: high-voltage amplifier; DBM: double-balanced mixer. The comb frequencies
frep and fCEO are stabilized by two separated control loops to the same 10-MHz reference signal
from an H-maser.
The repetition rate of the OPO was detected with a high-speed InGaAs photodiode (DSC40S, Discovery Semiconductors Inc.), from which the third harmonic component 3frep was extracted using a bandpass filter for repetition rate locking. After amplification, the acquired 3frep signal was mixed in an analog phase comparator (double balanced mixer) with a ~1-GHz reference frequency from a synthesizer (Rohde & Schwartz SMF100A) phase-locked to the 10-MHz signal of an H-maser to ensure the long-term stability and accuracy of frep. The
resulting error signal was input into a commercial Laser Quantum TL-1000 stabilization unit, whose output was directed to two piezoelectric transducers (PZTs) inside the Ti:sapphire cavity and used to adjust frep. Using two PZTs allowed us to simultaneously achieve a high-bandwidth lock while also providing a wide enough capture range for a reliable long-term stabilization. The nominal repetition rate tuning coefficient was ~2 Hz/V for the fast actuator (PZT1, with a modulation bandwidth of around 1 kHz as described later) and ~20 Hz/V for the slow actuator (PZT2, with a bandwidth limited to around 1 Hz by a low-pass filter in the TL-1000 stabilization unit). The repetition rate could be locked for more than 10 hours in a standard laboratory environment.
The CEO frequency fCEO of the OPO signal was acquired by heterodyning coherent pump SC light at 529 nm with the pump-signal SFG light from the OPO crystal [28]. Our phase-locking electronics for fCEO stabilization typically require a signal-to-noise ratio (SNR) of > 30 dB. Careful adjustment of the delay between the two arms of the interferometer, of the spatial overlap and spectral bandwidth of the SC and SFG light were implemented to obtain a heterodyne beat with >35 dB SNR (measured in a resolution bandwidth of 100 kHz for an OPO signal of 1560 nm). After optimization, the acquired heterodyne signal was input into a phase-frequency-detector (PFD) to generate an error signal relative to the 10-MHz reference signal from the H-maser. Our PFD can measure phase fluctuations of up to ± 32π, and this large range makes it easier to track significant phase changes of fCEO. As a result, phase fluctuations of fCEO were efficiently reduced by a feedback loop containing a fast servo-controller (New Focus LB1005) whose output, after amplification, drove another PZT (PZT3) holding one of the mirrors inside the OPO cavity to adjust fCEO with a modulation bandwidth of a few kHz. A detailed characterization of the phase noise of the locked OPO comb, including fCEO, is presented in Section 3. We note that while operation too close to degeneracy can lead to instabilities in comb locking [21], in our configuration the signal and idler wavelengths were separated by at least 80 nm so no locking issues were present.
2.2 Experimental methods for noise characterization of the OPO
The noise properties of the fully-stabilized OPO were thoroughly characterized by separately analyzing the frequency noise power spectral density (PSD) of the two comb parameters frep
rep
(Sf ) and fCEO (SfCEO), as well as of an optical comb line at 1557 nm (SνN).
The frequency noise of frep was measured both in-loop and out-of-loop. The in-loop measurement was obtained by analyzing the noise of the error signal for frep, i.e., the output voltage of the frequency mixer that compared the phase of 3frep to the 1-GHz reference signal from a synthesizer. The measured voltage noise was converted into phase noise using the experimentally determined slope of the output signal of the phase detector observed when frep was unlocked. An out-of-loop measurement was also performed by detecting the 45th harmonic of frep (at ~15 GHz) using a fast photodiode (model 1434 from Newport, with 25-GHz bandwidth). After narrow-band filtering and amplification, the phase noise of this signal was measured by comparison against a reference synthesizer (Agilent E8257D) using a double balanced mixer (DBM). The sensitivity (in V/rad) of this phase detector was first determined from the measured amplitude of the DBM sinusoidal output signal observed when slightly detuning the synthesizer frequency from 45frep. Then the frequency of the reference signal was adjusted to exactly 45frep (the synthesizer was stabilized to the same H-maser as the reference signal for frep locking) and its phase at the input of the DBM was adjusted using a variable delay line to keep the two signals in quadrature, where the DBM acts as a linear phase detector. The measured voltage noise at the DBM output was converted into phase noise using the assessed sensitivity.
The frequency noise of the CEO beat was obtained by comparing fCEO to a 10-MHz reference signal (from the same H-maser) in a digital phase detector (DXD200 from MenloSystems). In this measurement, great care was taken to prevent operation of the phase detector at undesirable nonlinear points [29]. The output voltage of the phase detector was converted into phase changes using its measured sensitivity.
Finally, the noise of an optical comb line of the OPO at 1557 nm was assessed from the heterodyne beat fbeat with a cw ultra-narrow-linewidth laser. This optical reference consisted of an external-cavity planar waveguide laser (model ORION from Redfern Integrated Optics Inc.) locked to an ultra-stable high-finesse optical cavity [30]. The cw laser carried a negligible contribution to the frequency noise of the heterodyne beat, which was thus fully representative of the noise of the OPO comb line corresponding to a mode number of N
≈578,080. The heterodyne beat was implemented in an all-fiber beat detection unit (BDU) by combining the cw laser with a fraction of the OPO output power using a 50/50 fiber combiner. The OPO spectrum was filtered using a fiberized tunable optical filter (with 0.4-nm spectral width) to remove most of the spectral components that did not contribute to the beat signal. The heterodyne beat with a typical SNR of ~30 dB (in 30-kHz resolution bandwidth) was analyzed using a phase-locked loop (PLL) frequency discriminator [29] in order to assess the frequency noise of the OPO comb line.
The frequency noise (Sfrep) of the heterodyne beat and thus of the comb line νN contains
the noise of both the CEO beat (SfCEO) and of the repetition rate (Sfrep) scaled up by the
mode number N according to the comb equation:
rep CEO 2
beat N f f .
S =Sν =N S⋅ +S (1)
The noise contribution of fCEO was removed from this signal by frequency-mixing the heterodyne beat fbeat with the CEO beat fCEO in order to produce the difference-frequency signal fbeat−fCEO = ⋅N frep−νlaser. The mixer output signal was properly filtered to remove the sum-frequency component ( fbeat +fCEO = ⋅N frep+2fCEO−νlaser) that contains two times the CEO noise. The CEO-free beat offered an alternative approach to indirectly assess the noise of frep, which was much more sensitive as a result of the large scaling factor N. The frequency noise of this CEO-free beat was measured using the same PLL frequency discriminator as for the direct beat signal fbeat.
All noise PSDs were recorded using a fast Fourier transform (FFT) spectrum analyzer (Stanford Research SR-770) in the range of 1 Hz to 100 kHz. In order to obtain clean measurements with a good spectral resolution over the entire considered frequency range, each spectrum was obtained from the combination of several FFT spectra measured in different frequency ranges (one spectrum for each frequency decade), after co-averaging 2,000 individual FFT traces.
2.3 Application to the measurement of an absolute optical frequency
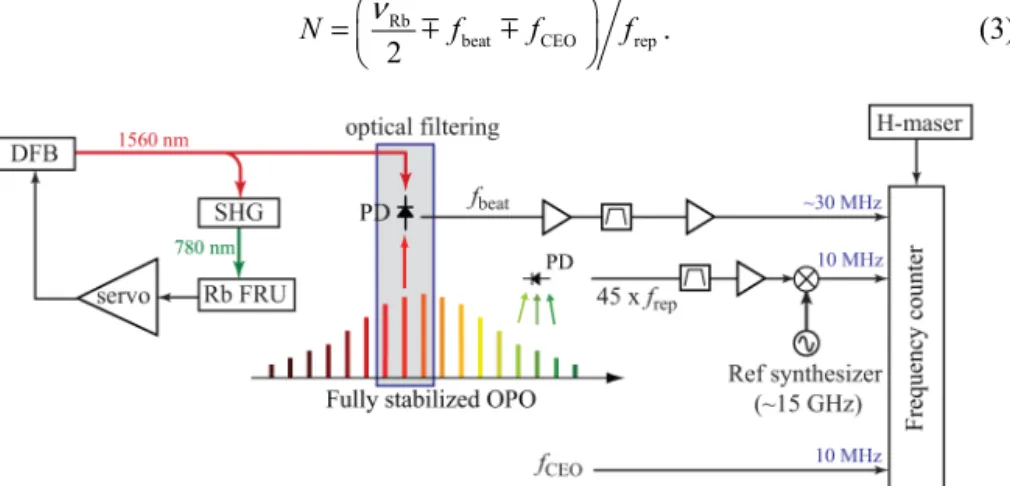
The OPO comb was also evaluated for a metrology application consisting in the measurement of an absolute optical frequency. A frequency-stabilized distributed feedback (DFB) laser at 1560 nm was used as a test laser in this experiment. This laser was frequency-doubled and stabilized to the F = 2→3 transition of the 87Rb D2 line at 780 nm (nominal transition frequency νRb = 384,228,115,203 kHz [26]) using a sub-Doppler saturated absorption scheme similar to the one previously reported by Matthey et al. [25]. A fraction of the laser power at the fundamental frequency was sent to the OPO set-up through 40 m of single-mode fiber. A heterodyne beat was performed between the DFB laser and a filtered output of the OPO at 1560 nm (with 0.4-nm spectral width) in an all-fiber BDU (Fig. 2). The OPO repetition rate was tuned such that the heterodyne beat was centered at around 30 MHz, which allowed straightforward bandpass filtering. The beat signal frequency fbeat, as well as the comb frequencies frep and fCEO, were simultaneously recorded with a 4-channel dead-time-free Π-type counter (FXM-50 from K + K Messtechnik) with 1-s gate time. In order to improve the precision of the measurement of frep that was limited by the millihertz resolution of the counter, the 45th harmonic of frep was detected and down-converted to 10 MHz by frequency mixing with the signal of a synthesizer (Agilent E8257D) referenced to the same H-maser. This scheme enabled us to determine frep with a relative resolution <10−13 for a 1-s counter
gate time. The optical frequency νcw of the laser was retrieved from the recorded frequencies using the comb equation
cw N frep fCEO fbeat,
ν = ⋅ ± ± (2)
where N is the index of the comb mode that was heterodyned with the laser. The mode number and the respective sign of the two beat signals fbeat and fCEO were separately determined. The sign of fbeat was first determined by observing the change of the beat frequency arising when the OPO repetition rate was slightly changed at constant fCEO (in order to assess if the observed beat frequency was νcw−νN or νN−νcw). Then, the sign of fCEO was determined by observing the change of the beat frequency when fCEO was changed at constant frep. Finally, the mode number N was inferred from the reference value νRb of the considered Rb transition [26] and the measured frequencies and corresponding signs (the correctness of this mode number was assessed by the fact that the obtained value was very close to an integer number):
Rb
beat CEO rep.
2
N=ν f f f (3)
Fig. 2. Scheme of the set-up used to measure the optical frequency of a 1560-nm DFB laser, whose second harmonic frequency was stabilized to the 87Rb D2 F = 2→3 transition. SHG:
second-harmonic generation; FRU: frequency reference unit; PD: photodiode.
3. OPO frequency comb characterization 3.1 Repetition rate noise
Figure 3 displays the different measurements of the frequency noise PSD of the stabilized repetition rate of the OPO performed as previously described in Section 2.2, as well as the noise of the free-running frep for comparison. A good agreement is observed between the in-loop and out-of-in-loop measurements at offset frequencies above ~30 Hz. At lower frequencies, the in-loop noise is smaller, however it does not represent the actual noise of frep, but only the quality of the repetition rate locking. The higher out-of-loop noise observed at low frequency arises from the RF synthesizer used as the reference signal in the repetition rate stabilization loop. At frequencies higher than ~2 kHz, the measurement was limited by the instrumental noise floor. To overcome this limitation, the complete noise spectrum of the repetition rate has been derived from the measurement of the heterodyne beat with the narrow-linewidth laser. The frequency noise PSD of the CEO-free beat (fbeat - fCEO) was measured and divided by N 2 to indirectly assess the noise of f
rep. A very good overlap with the out-of-loop noise directly measured on frep is observed up to ~1.5 kHz. At higher offset frequencies, this down-scaled optical measurement enabled us to overcome the instrumental noise floor of the direct measurement of the microwave signal frep and to retrieve the correct repetition rate noise
spectrum. The residual integrated phase noise of frep assessed from this measurement is at the milliradian level [1 Hz – 100 kHz].
Fig. 3. Frequency noise PSD of frep measured in-loop (at 3frep≈1 GHz) and out-of-loop (at 45frep
≈15 GHz) in the RF domain, and assessed from the optical beat between the OPO and a cw laser after CEO subtraction (at (fbeat – fCEO) = N·frep – νlaser). All frequency noise PSDs have been
down-scaled to the repetition rate frequency (~333 MHz).
The bandwidth of the repetition rate stabilization loop was about 1 kHz as shown by the comparison of the free-running and locked frep noise spectra in Fig. 3. This bandwidth was limited by mechanical resonances of the fast actuator PZT1 used to stabilize frep, which are clearly visible on the transfer function of frep measured for a modulation of PZT1 (Fig. 4). This result was obtained by modulating the voltage of PZT1 with a sine waveform and demodulating frep using a frequency discriminator followed by a lock-in amplifier to measure the amplitude and phase of the change of frep as a function of the modulation frequency. At frequencies lower than ~2 kHz, both the amplitude and the phase of the PZT response are smooth and fully appropriate for a stabilization loop.
Fig. 4. Transfer function of frep in amplitude (left) and phase (right) measured for a
modulation of PZT1.
3.2 CEO frequency noise
Figure 5 displays the measured frequency noise PSD of the stabilized CEO beat and the corresponding integrated phase noise. One can notice that the CEO frequency noise PSD lies entirely below the β-separation line introduced by Di Domenico et al. [31], which is the characteristic of a tight phase-lock where the CEO RF beat collapses to a coherent peak as shown in the inset of Fig. 5. The corresponding integrated phase noise is lower than 300 mrad [1 Hz – 100 kHz]. A significant contribution to this integrated phase noise arises from excess
noise observed in the range of 100 Hz to 1 kHz in the frequency noise PSD, which likely results from mechanical noise coupled into the OPO resonator. The other major contribution to the CEO integrated phase noise arises from a noise peak at ~30 kHz that results from intensity noise of the pump Ti:sapphire laser.
Fig. 5. Frequency noise PSD of fCEO measured in-loop and corresponding integrated phase
noise. The β-separation line that is important to determine the linewidth of the signal [31] is also shown by the dashed grey line. The inset shows the coherent peak in the CEO RF beat (500-Hz span with 1-Hz resolution bandwidth).
3.3 Noise and linewidth of an optical comb line
The frequency noise PSD of an optical line of the OPO comb at 1557 nm assessed from the heterodyne beat signal with the narrow-linewidth cw laser is displayed in Fig. 6. For comparison, the individual contributions of the CEO beat (SfCEO)and of the repetition rate
2
(N S⋅ frep)to the frequency noise of the optical line are also displayed. They clearly show that the noise of the OPO line predominantly arises from the noise of frep, which is limited by the reference synthesizer at low frequency. The peak at ~30 kHz in the noise spectrum of fCEO that originates from the pump Ti:sapphire laser is also visible in the noise spectrum of the optical line. This peak lies very close to the β-separation line and induces a contribution of about 10 kHz in the linewidth of the comb line calculated from the frequency noise spectrum using the approach of Di Domenico et al. [31]. However, this formalism provides only an approximate value that may deviate from the actual linewidth for noise components that are in the vicinity of the β-separation line, which is the case for the pump noise peak at ~30 kHz. Therefore, it is likely that this noise peak has only a marginal contribution to the OPO optical linewidth in reality. The fact that the measured CEO frequency noise was completely underneath the β-separation line and that a coherent peak was observed in the CEO RF spectrum (see Fig. 5) are good indications that the CEO noise should not contribute to the optical linewidth of the OPO.
Even when taking into account the contribution of the CEO noise discussed above, an optical linewidth of ~70 kHz (full width at half maximum, FWHM) is assessed for the OPO at 1557 nm for an observation time ranging between 10 ms and 1 s (corresponding to an integration of the frequency noise PSD from 1 Hz (100 Hz for 10 ms) up to 100 kHz). Without this contribution, the linewidth is reduced to about 60 kHz. As most of the noise components contributing to this linewidth arise at frequencies lower than ~5 kHz, a feedback loop with a reasonable bandwidth <10 kHz will be able to achieve a hertz-level linewidth for the entire OPO spectrum by stabilization to the ultra-stable laser at 1557 nm. This should be feasible using an improved PZT with a larger bandwidth.
Fig. 6. Frequency noise PSD of an optical line of the OPO at 1557 nm ( )
N
Sν and corresponding contribution of fCEO and N·frep. The optical linewidth retrieved from the
frequency noise PSD using the approximation of Di Domenico et al. [31] is also shown on the right vertical axis as a function of the low-frequency cut-off (inverse of the observation time).
4. Use of the OPO for absolute optical frequency measurement
A measurement of the optical frequency of the Rb-stabilized laser performed with the fully-stabilized OPO as described in Section 2.3 is displayed in Fig. 7. The time series of the recorded frequencies frep, fCEO and fbeat are shown together with their corresponding Allan deviation. The index of the comb mode that was heterodyned with the cw laser was determined from the reference frequency of the Rb transition and the recorded frequency and sign of the beat signals according to Eq. (3). The obtained value (576,467.999,785) was very close to an integer number, which validated its determination. From the measured values of the frequencies frep, fCEO and fbeat and their respective uncertainty (standard deviation), a frequency of 192,114,057,673 ± 8 kHz was determined for the 1560-nm laser, corresponding to a value of νRb = 384,228,115,346 ± 16 kHz for the frequency-doubled component locked to the Rb transition. This value is ~143 kHz higher than the reference Rb transition frequency [26]. This offset partially resulted from some frequency shift in the laser stabilization scheme to the Rb reference, which likely arose from the background signal in the error signal of the stabilization loop induced by the Doppler-broadened absorption profile in the Rb cell. In addition, a significant contribution to the frequency offset, but also to the measurement uncertainty, arose from etalon fringes occurring in the all-fiber laser set-up. This effect was mainly induced by a fiber combiner used in front of the cw laser, which induced significant reflections leading to this interferometric noise. This effect was more pronounced at the time of these measurements than in previously reported results of this stabilized laser system [25], due to some on-going developments in the Rb-stabilized laser set-up. Consequently, the frequency of the 1560-nm stabilized laser typically varied in a range of around ± 15 kHz as a result of environmental temperature changes, resulting in an uncertainty in the assessed Rb transition frequency of around ± 30 kHz. These variations strongly limited the precision of the retrieved Rb transition frequency. The uncertainty of the measurement resulting from the OPO comb was much smaller. The relative frequency instability of the repetition rate of the OPO amounts to ~1.5·10−12 at 1-s integration time and decreases approximately as τ−1 [Fig. 7(b)], whereas the contribution of the CEO frequency to the instability of the optical comb line is much smaller, in the order of 10−15/τ [Fig. 7(d)]. Therefore, the uncertainty in the measurement of an optical frequency at ~1.55 μm brought by the OPO is <300 Hz/τ, limited by the RF reference used in the stabilization of the OPO repetition rate.
Fig. 7. Determination of the absolute frequency of a 1560-nm DFB laser, frequency-doubled and stabilized to the 87Rb F = 2→3 D2 transition, determined from the heterodyne beat with the
fully-stabilized OPO. (a, c) Recorded time series of frep and fCEO, respectively. (b, d)
Corresponding Allan deviation (relative to the optical frequency νcw in the case of fCEO). (e, f)
Time series and corresponding Allan deviation of the 1560-nm cw laser (blue curves) and contribution of the OPO instability in the measurement (red curves).
The performance of the OPO comb for this optical metrology application has been compared against a commercial Er:fiber frequency comb (FC1500 from Menlo Systems, Germany, with 250-MHz repetition rate) as a benchmark system in the same wavelength region. The Er:fiber comb was fully-stabilized to the same H-maser and was used in a similar way to measure the frequency of the Rb-stabilized laser. The assessed value of νRb = 384,228,115,266 ± 75 kHz was offset by ~63 kHz from the reference Rb transition [26] and was thus ~80 kHz smaller than the value obtained with the OPO. The importance of etalon fringes in the Rb-stabilized laser system was even more pronounced in the measurement with the Er:fiber comb, which resulted in frequency variations of the beat signal at 1560 nm in a range of around ± 80 kHz. These larger frequency variations are the main reason for the higher uncertainty in the Rb transition frequency assessed with the Er:fiber comb. The difference between the values of the Rb transition frequency obtained with the two combs arises from the different time of the measurements, resulting in a modified impact of etalon fringes. The frequency shifts observed with the two comb systems are compatible when taking into account the measurement uncertainties and the typical range of fluctuations of the Rb-stabilized laser. Therefore, these results prove the suitability of the OPO for frequency metrology applications.
5. Summary and conclusions
We fully stabilized an OPO synchronously-pumped by a 333-MHz modelocked Ti:sapphire laser to a stable RF reference and performed a detailed analysis of its noise and frequency stability properties. An optical linewidth of <70 kHz was assessed from these measurements for an optical comb line at 1.56 μm. The CEO-beat had a negligible contribution in the OPO optical linewidth as a result of the tight lock obtained using a phase-locked loop with a feedback signal applied to a PZT-controlled mirror in the OPO cavity. The residual integrated phase noise of the CEO beat was smaller than 300 mrad.
As a first metrology application, we used the OPO to measure the optical frequency of the 87Rb D2 F = 2→3 transition, by counting f
rep, fCEO and fbeat when heterodyning the OPO with a 1560-nm laser, frequency-doubled and locked to a Rb cell in a saturated spectroscopy setup [3]. A frequency of 384,228,115,346 ± 16 kHz has been determined, which is in good agreement with the value retrieved using a commercial Er:fiber comb. The frequency offset of ~143 kHz observed in comparison to the reference Rb transition frequency [26] results in a large part from etalon fringes in the all-fibered stabilization scheme of the cw laser. In this measurement, the relative uncertainty carried out by the OPO was in order of 1.5·10−12·τ−1, limited by the RF reference used in the stabilization of the OPO repetition rate. This performance could be improved by stabilizing the OPO comb directly to an optical narrow-linewidth reference instead of an RF reference.
These results demonstrate the suitability of the developed OPO for precise optical frequency metrology. In a separate study we also confirmed that the comb phase-noise performance could be maintained across the entire tuning range of the OPO (1.0-4.0 µm, with the exception of a small region near degeneracy) [21]. Thus, by exploiting the exceptional tunability available from OPO combs, frequency-comb metrology can now be performed across the near- to mid-infrared region from a single system.
Acknowledgments
This research was carried out under the METROCOMB project, which has received funding from the European Community’s Seventh Framework Program (FP7/2007-2013) under Grant Agreement no. 605057. We thank our colleagues W. Moreno and F. Gruet for providing the signal of the Rb-stabilized laser.