HAL Id: hal-02417745
https://hal.archives-ouvertes.fr/hal-02417745
Submitted on 18 Dec 2019HAL is a multi-disciplinary open access archive for the deposit and dissemination of sci-entific research documents, whether they are pub-lished or not. The documents may come from teaching and research institutions in France or abroad, or from public or private research centers.
L’archive ouverte pluridisciplinaire HAL, est destinée au dépôt et à la diffusion de documents scientifiques de niveau recherche, publiés ou non, émanant des établissements d’enseignement et de recherche français ou étrangers, des laboratoires publics ou privés.
influence of initial pressure on hydrogen/air
flameacceleration during severe accident in npp
R. Scarpa, E. Studer, S. Kudriakov, B. Cariteau, N. Chaumeix
To cite this version:
R. Scarpa, E. Studer, S. Kudriakov, B. Cariteau, N. Chaumeix. influence of initial pressure on hydrogen/air flameacceleration during severe accident in npp. ICHS 2017, Sep 2017, Hambourg, Germany. �hal-02417745�
INFLUENCE OF INITIAL PRESSURE ON HYDROGEN/AIR FLAME
ACCELERATION DURING SEVERE ACCIDENT IN NPP
Scarpa, R.1, Studer, E.2, Kudriakov, S.3, Cariteau, B.4 and Chaumeix, N.5 1 DEN-STMF, CEA, Université Paris-Saclay, Gif-sur-Yvette, 91191, France,
roberta.scarpa@cea.fr
2 DEN-STMF, CEA, Université Paris-Saclay, Gif-sur-Yvette, 91191, France,
etienne.studer@cea.fr
3 DEN-STMF, CEA, Université Paris-Saclay, Gif-sur-Yvette, 91191, France,
sergey.kudriakov@cea.fr
4 DEN-STMF, CEA, Université Paris-Saclay, Gif-sur-Yvette, 91191, France,
benjamin.cariteau@cea.fr
5 ICARE, CNRS-Orléans,Avenue de la Recherche Scientifique, Orléans, 45100, France,
chaumeix@cnrs-orleans.fr
ABSTRACT
Flame acceleration (FA) and explosion of hydrogen/air mixtures remain key issues for severe accident management in nuclear power plants. Empirical criteria were developed in the early 2000s by Dorofeev and colleagues, providing effective tools to discern possible FA or DDT (Deflagration-to-Detonation Transition) scenarios. A large experimental database, composed mainly of middle-scale experiments in obstacle-laden ducts at atmospheric pressure condition, has been used to validate these criteria. However, during a severe accident, the high release rate of steam and non-condensable gases into the containment can result in pressure increase up to 5 bar abs. In the present work, the influence of the unburnt gas initial pressure on flame propagation mechanisms was experimentally investigated. Premixed hydrogen/air mixtures with
2 H
close to 11% were considered. From the literature we know that these flames are supposed to accelerate up to Chapman-Jouguet deflagration velocity in long obstacle-laden tubes at initial atmospheric conditions. Varying the pressure in the fresh gas in the range 0.6-4 bar, no relevant effects on the flame acceleration phase were observed. However, as the initial pressure was increased, we observed a decrease in the flame velocity close to the end of the tube. The pressure increase due to the combustion reaction was found to be proportional to p0.
NOMENCLATURE
Latin letters
AICC Adiabatic Isochoric Complete Combustion
BR Blockage ratio [-]
c Speed of sound [m/s]
CC Piezoelectric shock sensor CJ Chapman-Jouguet condition
d Obstacle inner diameter [m]
D Tube diameter [m]
DDT Deflagration-to-Detonation Transition
f Frequency [Hz]
FA Flame Acceleration
l Tube length [m]
n Overall reaction order [-]
p Pressure [bar]
PP Piezoelectric pressure sensor PMT Photomultiplier tube
T Temperature [K] V Velocity [m/s] x Distance [m] Greek letters Zeldovich number [-] Molar fraction [-] Uncertainty Equivalence ratio [-]
Superscripts and subscripts
0 Initial condition a Acoustics ad Adiabatic combustion b Burnt gas c Cut-off def Deflagration det Detonation F Flame H2 Hydrogen L Laminar max Maximum s Sound S Shock u Unburnt gas 1.0 INTRODUCTION
In case of severe accident, in-core metal-water reactions due to fuel heat-up lead to massive release of hydrogen into the containment of Light Water Reactors, as recently recalled by Fukushima accident. The safety features currently implemented for severe accident management do not avoid the possible formation of large flammable clouds. If ignited, hydrogen/air flames may accelerate up to supersonic speeds over a wide range of hydrogen concentration. Such explosions could eventually jeopardize the integrity of the containment and damage components important to safety or accident management. Moreover, since hydrodynamic forces depend on the drag force as well as on the acceleration of the flow field [1], structural damage becomes more important as the propagation velocity of the reactive wave increases.
The empirical flame acceleration criteria developed in the early 2000s by Dorofeev and colleagues [2], [3] provide effective tools for the analysis of the possible scenarios and it allows the selection of the most relevant situations for which flame acceleration (FA) may take place. Nevertheless, most of FA and DDT (Deflagration-to-Detonation Transition) criteria are based on experimental databases in which explosions were carried out at atmospheric conditions. In case of a severe accident, the high release rate of steam and non-condensable gases into the containment may result in a pressure increase up to 5 bar abs. Therefore, hydrogen explosions are more likely to happen at an initial pressure greater than the atmospheric one.
According to the thermal theory of Mallard and Le Chatelier, the laminar burning velocity is expected to vary in line with expression (1):
2 2 n L p S , (1)
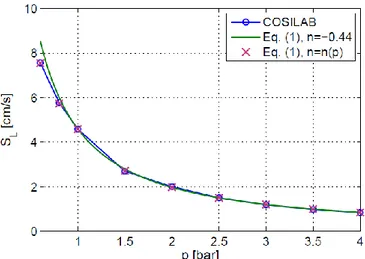
where nn( p) is the overall reaction order. For lean mixtures at atmospheric conditions n 1, thereforeSL decreases with increasing pressure. This variation is linked to the fact that the ignition temperature tends to increase as the initial pressure increases. According to [4], n strongly decreases with pressure and for lean mixtures it may reach negative values. In Fig.1 the variation of the laminar burning velocity with pressure for 11 %vol H2-air mixture is shown. COSILAB® v.3 code [5], coupled with the detailed kinetic mechanism described in [6], was used to compute the laminar flame speed. Results are then compared with equation (1).
Figure 1. Laminar burning velocity vs. pressure for 11 %vol H2-air mixture (= 0.296).
For lean mixture at p10 bar the activation energy increases as 2 1
p . Since the adiabatic flame temperature is essentially independent of pressure in the range of pressure variation considered in the present study, the Zeldovich number is supposed to vary in the same way as the activation energy. Moreover, by assuming that Tb,ad remains constant, we make the hypothesis that the speed of sound in
the burnt gas is not affected by pressure variations.
In the present work, the influence of p0 on premixed hydrogen/air flame propagation has been experimentally investigated in the SSEXHY facility (Structures Submitted to an EXplosion of HYdrogen). The device (Fig. 2) consist of a stainless steel tube equipped with annular obstacles uniformly distributed all along the tube length. Experiments were performed at initial pressure in the range 0.6-4 bar abs. For this campaign we chose to test mixtures with hydrogen content close to 11.0 %vol. From literature [7] we know that these mixtures are supposed to accelerate inside an obstacle-laden tube up to an asymptotic velocity. This saturation velocity corresponds to the Chapman-Jouguet deflagration speed [8]. By decreasing the hydrogen concentration, the mixture is shown to be not sufficiently energetic to sustain the above mentioned condition. As a result, these flames may be partially or totally quenched depending on the obstacle blockage ratio. At atmospheric initial conditions, mixtures with 11.0 %vol hydrogen identify the lower limit for FA [3]. In consequence, their behavior is quite unstable: even the slightest variation of a fundamental parameter may lead to significant modification of flame behavior.
2.0 EXPERIMENTAL SETUP
The experimental facility (Fig. 2 and Fig. 3) consists in an obstacle-laden tube designed to study the acceleration mechanisms of premixed hydrogen/air flames. The tube is composed of 4 modules of the same length l 1310 mm and internal diameter D120 mm. In the present experimental campaign only three modules are exploited for a total length of 3930 mm.
Figure 2. SSEXHY facility in the 3-modules configuration.
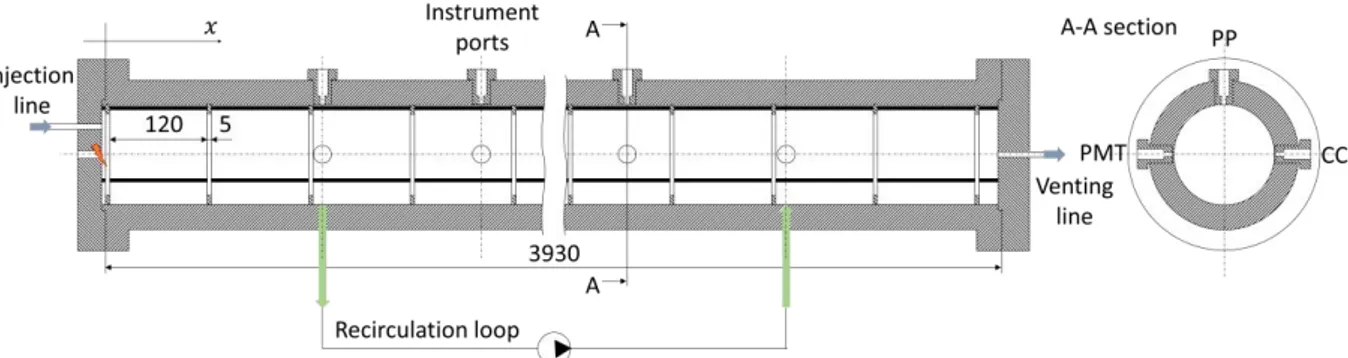
Figure 3. Schematic of the experimental device. Lengths are given in mm.
The acceleration tube is designed for a nominal operating pressure of 100 bar, making the device suitable for studying both deflagration and detonation mechanisms. Gas injection and venting lines are located at the flanged heads. The first head also hosts in its centre an automotive spark plug used to ignite the flammable mixture, as shown in Fig. 3.
Thirty-two equally spaced annular obstacles have been installed inside the tube with the aim of promoting turbulence at the wall. Obstacle blockage ratio ( 2
D d
=1 ( / )
BR ) is equal to 0.3. The structure supporting the obstacles is formed by three thin threaded rods. The stainless steel annular obstacles (5 mm thick) present three holes, 60° spaced from each other, for rods insertion. Obstacles are 120 mm spaced from each other, resulting in a 125 mm uniform pitch.
Air (20.1% O2 – 70.9% N2) and hydrogen are consecutively injected into the tube from two separated gas tanks. Prior to gas injection, lines are vented by removing the residual gas with a vacuum pump, thus avoiding any contact between hydrogen and oxygen. This precaution allows us to achieve a flammable mixture only inside the tube. At the end of the injection process the injection system is inerted with nitrogen. Hydrogen concentration can be varied inside flame propagation limits, covering the whole spectrum of possible mixtures from lean mixtures to rich ones, including stoichiometric conditions. Once the initial conditions of the experiment are established, i.e. pressure and hydrogen concentration, the method of partial pressures is used to prepare the desired mixture inside the tube.
Three pressure sensors are available for three different pressure ranges: a vacuum gauge in the range 0-133 mbar, a pressure transmitter in the range 0-1000 mbar, while the last one covers the range 0-5 bar.
Since hydrogen and air are injected at different times, a concentration gradient is formed along the tube axis. Mixture homogenisation is then promoted by an ATEX gas recirculation pump. The mixture is forced to recirculate into an external loop for about 30 minutes before reaching the homogeneous condition. This period of time was calibrated from pre-tests using helium instead of hydrogen and measuring the local concentration with thermal conductivity gauges. Close to the recirculation loop entrance at the tube wall, two taps are available for gas sampling. Gas samples are then analysed by a gas chromatograph (Agilent 490 µGC). The uncertainty in gas composition is in the order of 0.1 %vol. In the 3-modules configuration, the combustion tube is equipped with 40 instrumentation ports. The instrumentation configuration for the present experimental campaign involved fourteen photomultiplier tubes (PMT), nine piezoelectric pressure sensors (PP) and fourteen piezoelectric shock sensors (CC). Sensors disposition along the tube is detailed in Tab. 1. Here the origin x=0
corresponds to the inner surface of the first flanged connection, located 5 mm away from the origin of the fluid domain, as shown in Fig. 3.
Table 1. Instrumentation configuration.
Location [mm] Shock sensors Pressure sensors (type) Photomultiplier tubes 265 PMT1 460 CC1 PP1 (6001) PMT2 655 CC2 PP2 (7001) PMT3 850 CC3 PP3 (6001) PMT4 1045 CC4 PP4 (601A) PMT5 1575 CC5 PP5 (7001) PMT6 1770 CC6 PMT7 1965 CC7 PP6 (7001) PMT8 2160 CC8 PMT9 2355 CC9 PP7 (7001) PMT10 2885 CC10 PMT11 3080 CC11 PP8 (7001) PMT12 3275 CC12 PMT13 3470 CC13 PP9 (7001) PMT14 3665 CC14
A cross sectional view of the tube shows the position of the sensors on the tube diameter (A – A section in Fig. 3). On the vertical position (on the top generatrix of the tube) we can find dynamic pressure sensors (Kistler 601A, 6001 and 7001 types). For the 601A and 6001 types we have used a flush mounting nut, while 7001 type are recessed mounted. At 90° from the pressure sensors, we can find the optical access for the Hamamatsu R11568 photomultiplier tubes (PMT). These detectors collect the UV light emitted by OH• radicals located at the reaction front within a very narrow solid angle (xmax 3.66mm). As the flame tip passes through the PMT solid angle, a negative voltage is recorded. This signal allows us to extrapolate the time-of-arrival of the flame tip, monitoring flame propagation along the tube axis.
On the other side, Chimiemetal piezoelectric sensors are located. These detectors allow the detection of a shock wave in the unburnt gas. Thanks to their small sensitive area (2 mm diameter), they can be used to extrapolate the velocity of the pressure wave ahead of the flame in a more accurate way. These sensors are not calibrated and strongly affected by the radiation emitted by the flame. As a result, once
the flame passes by the sensor, the piezoelectric crystal respond with a strong current pulse. Their use is therefore restricted to the detection of the shock waves ahead the flame, in the unburnt gas.
Tube inner wall, as well as obstacles surface, was thermally treated with black oxides to prevent light reflection. The accuracy of optical measurements is therefore increased.
National Instrument NI PXIe-1078 data acquisition station was used to record sensors output signals. The five acquisition cards 12-bit, 8-channels NI PXIe-5105 (with onboard memory) allow a maximum record frequency of 60 MHz per card. Acquisition trigger and signal record are controlled via LabVIEW 2015 platform. The program is coded to launch signal acquisition as the ignition spark is initiated.
3.0 RESULTS AND DISCUSSION
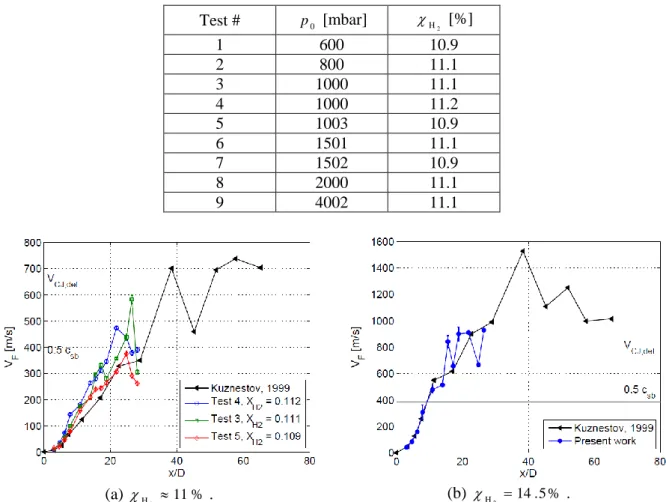
The test matrix is presented in Tab. 2. A repeatability study was performed at p0 1bar in order to compare the results obtained in the present work with those from literature. In Fig. 4(a) the velocity of the flame tip along the tube axis is presented for the test cases 3, 4 and 5 ( 11%
2 H
). Present results were compared to those from [7] for the same mixture composition and obstacle blockage ratio.
Table 2. Test matrix.
Test # p0 [mbar] H2 [%] 1 600 10.9 2 800 11.1 3 1000 11.1 4 1000 11.2 5 1003 10.9 6 1501 11.1 7 1502 10.9 8 2000 11.1 9 4002 11.1 (a) 11% 2 H . (b) 14.5% 2 H .
Figure 4. Repeatability study at atmospheric pressure (p0 1000 mbar). Experiments performed during the present work are compared to those from [7] for the same mixture composition and obstacle
In Fig. 4(a) the error band associated to velocity measurement technique is also presented for the three test cases. This uncertainty is related to the error in the flame position measurement introduced by PMT solid angle. In Fig. 4(b) a repeatability study for 14.5%
2 H
is presented. Here the error band represents minimum and maximum values over three repeated shots. The experiments performed with a more reactive mixture match perfectly the data presented in [7], while for mixtures with 11% hydrogen data dispersion is wider. These flames show in fact a quite unstable behaviour that reflects in the repeatability study.
Sensors output signals were recorded at 100 kHz. To eliminate the noise related to electronics and structures resonance, a low-pass filter was applied to the signals. The cut-off frequency was chosen to preserve burnt gas acoustics among the obstacles. The frequency of an acoustic wave propagating in the burnt gas inside the chamber delimited by two obstacles can be computed as follows:
D c
fa sb
2
. (2)
For 11% hydrogen, csb 684 m/s thus fa 2850 Hz. The cut-off frequency for the filtering process was then imposed to be fc fa. To avoid damping the amplitude of those harmonics close to fa, we decided to use fc 3200 Hz.
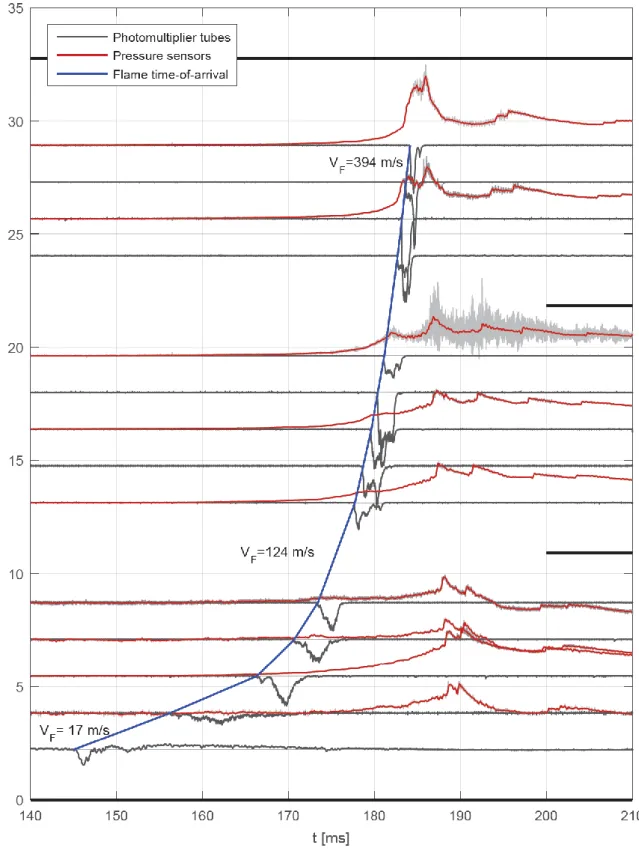
In Fig. 5, signals from Test 1 are presented in a 70 ms time window. Since the acquisition is triggered by the current that supplies the electrical spark, the exact time t0at which the ignition of the mixture takes place is unknown. In the graph, signals are plotted according to their non-dimensional position
D
x / along the tube. The solid large black lines identify tube modules borders. Both recorded pressure signals (light grey lines) and filtered ones (red lines) are presented in Fig. 5. Signals recorded by piezoelectric sensors correspond to the dynamic overpressure. The absolute pressure can then be obtained by adding to the overpressure the initial value of the pressure. An important thing to point out is that the radiation emitted by the flame strongly influences the response of those pressure sensors in flush mounting position (PP1, PP3 and PP4). By comparing PP2 and PP3 signals, we can note that thermal load on the sensor is lower for the sensor in the recessed mounting position.
The time-of-arrival diagram of the flame tip, drawn from photomultiplier tubes response, is also presented in Fig. 5 with a blue solid curve. For the sake of clarity, shock sensor output signals are not presented in the graph.
The saw-tooth shape of the pressure signals visible in Fig. 5 is caused by the shock waves reflecting on the head flanges. For the test cases with p0 1000 mbar, a quasi-mono-dimensional leading shock is formed. Post-processing pressure signals from Test 1, we found that, after the first reflection at the end of the tube, the shock wave propagates at almost 701 m/s. At each reflection its velocity decreases: VS 655 m/s after the second reflection, VS 630 m/s after the third one, VS 594 m/s after the fourth one and so on. The shock wave is therefore less energetic at each step. As the initial pressure is increased, the leading shock wave can no longer be considered mono-dimensional. As a result, pressure signals are characterized by a multitude of peaks with the same frequency (corresponding to a sound wave travelling along the tube) but different phase (see Fig. 7(a) and Fig. 8(a)).
The influence of the initial pressure on the flame velocity is shown in Fig. 6. Test cases were sorted in two groups depending on the hydrogen concentration. In Fig. 6(a) we present the test cases with
% 9 . 10 2 H
, while in Fig. 6(b) those cases with 11.1%
2 H
are shown. In the first stage of flame acceleration no significant differences with pressure variation may be observed.
Figure 5. Test 1: p0 600 mbar andH2 0.109 . Cut-off frequency on pressure sensors output signal fc 3200 Hz.
(a) 10.9% 2 H . (b) 11.1% 2 H .
Figure 6. Flame tip velocity.
Measurement spread is comparable to that one shown in the repeatability study. On the other hand, the last stage of flame propagation is characterized by a decrease of the flame velocity. This slowdown is more pronounced as the initial pressure increases. This is due to the fact that the leading shock ahead of the flame arrives at the end of the tube long before the flame. Here the shock is reflected by the head flange and it propagates towards the flame. As the shock interacts with the flame, hydrodynamic forces tend to stop the flame. Probably if the mixture was sufficiently reactive, flame-shock interaction would rather have caused a transition to detonation.
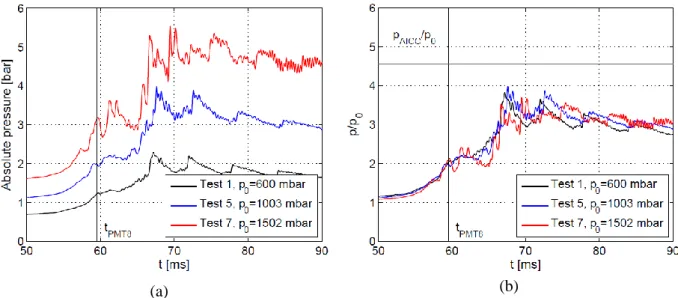
Fig. 7 and Fig. 8 show the pressure variations recorded by PP6 and PP9 for different tests. Curves were shifted in time so that the flame time-of-arrival at the correspondent sensor position is the same for all the tests. Flame tip time-of-arrival is also presented in the graphs with a vertical black line.
(a) (b)
Figure 7. Influence of the initial pressure p0 on the pressure peaks recorded by PP6: (a) absolute pressure; (b) absolute pressure to initial pressure ratio.
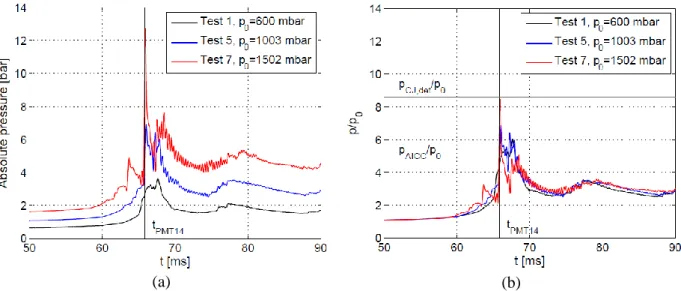
(a) (b)
Figure 8. Influence of the initial pressure p0 on the pressure peaks recorded by PP9: (a) absolute pressure; (b) absolute pressure to initial pressure ratio.
As the initial pressure is increased, the curves show a more oscillating profile. The frequency of these oscillations matches fa. Amplitude of acoustic waves in the burnt gas becomes then more important as the initial pressure increases. In Fig 7(b) and Fig. 8(b), the absolute pressure to the initial pressure ratio is presented. Here the curves are almost perfectly superposed. The pressure values following an adiabatic isochoric complete combustion (AICC) and a CJ detonation are also presented in Fig 7(b) and Fig. 8(b).
4.0 CONCLUSIONS
The effect of initial pressure on lean hydrogen/air flame acceleration was experimentally investigated. The initial pressure was varied in the rage 0.6-4 bar abs. In the early stages of flame acceleration no significant changes were observed. In the central module, where the velocity increase is almost constant, a wide data dispersion was noticed. However, this spread is similar to that one encountered in the repeatability study. As shown in Fig. 4(a), the experimental device is not long enough to allow the flame to reach the CJ saturation velocity for a 11 %vol hydrogen mixture.
As the initial pressure was increased, we observed a decrease in the flame velocity close to the end of the tube. The reason of this flame slowdown is mainly due to the interaction between the reflected shock wave and the flame. As a matter of fact, the higher the initial pressure, the more energetic the shock wave, as pointed out in Fig. 8(a). Then, the hydrodynamic force generated by the shock and acting on the flame becomes stronger, slowing down the flame in its propagation along the tube. Fig. 7(b) and Fig. 8(b) show that the pressure increase due to the combustion reaction is directly proportional to the initial pressure. The pressure increase due to the shock compression seems to follow the same trend too. As a result, in the last section of the tube temperature and pressure of the compressed fresh gas vary according to the examined test case. This change in the physical properties of the unburnt gas could affect the kinetic mechanism of the combustion reaction controlling flame propagation.
Further experimental campaigns are planned to complete the study. For these new experiments we envisage to investigate the influence of the initial pressure variation on different mixture compositions, including rich mixtures. Obstacle size variation is also foreseen. In future works, the effect of the dynamic pressure peaks on simple stainless steel structures, such as plates and cylinders, placed at the
end of the accelerating tube will also be analysed. A visualization module with quartz windows will be also available to perform optical flame front tracking measurements.
Present and future studies provide a solid base of experimental data for the validation of CFD models devoted to the simulation of LWR severe accident scenarios. In particular, experiments on SSEXHY facility are currently used to validate the correlation used in [9] to evaluate propagation speed of the reaction front in large geometries.
ACKNOWLEDGMENTS
The work was performed at the French Alternative Energies and Atomic Energy Commission (CEA). Authors thank Air Liquide and EDF for supporting current works.
REFERENCES
1. The Steel Construction Institute, Protection of piping systems subject to fires and explosions, Health &Safety Executive, 2005.
2. Breitung, W., Chan, C., Dorofeev, S. B., Eder, A., Gelfand, B., Heitsch, M., Klein, R., Malliakos, A., Shepherd, E., Studer, E. and Thibault, P., State-of-the-art report on flame acceleration and deflagration-to-detonation transition in nuclear safety, Nuclear Energy Agency, NEA/CSNI/R(2000)7
3. Dorofeev, S. B., Kuznetsov, M. S., Alekseev, V. I., Efimenko, A. and Breitung, W., Evaluation of limits for effective flame acceleration in hydrogen mixtures, J. Loss Prev. Process Ind., 14, 2001, pp. 583–589.
4. Law, C. K., Propagation, structure, and limit phenomena of laminar flames at elevated pressures,
Combustion Science and Technology, 178, 2006, pp. 335-360.
5. Rotexo. COmbution SImulation LABoratory. http://www.rotexo.com, 2015. [Online accessed 10-September-2015].
6. Connaire, M. O., Curran, H J., Simmie, J. M., Pitz, W. J. and Westbrook, C.K., A Comprehensive Modeling Study of Hydrogen Oxidation, International Journal of Chemical Kinetics, 36, 2004, pp. 603-622.
7. Kuznetsov, M. S., Alekseev, V., Bezmelnitsyn, A. V., Breitung, W., Dorofeev, S. B., Matsukov, I., Vaser, A. and Yankin, Y. G., Effect of obstacle geometry on behaviour of turbulent flames, Forschungszentrum Karlsruhe, Technik und Umwelt, Report No. IAE-6137/3 FZKA 6328
8. Chue, R. S., Clarke, J. F. and Lee, J. H., Chapman-Jouguet deflagrations, Proceedings of the Royal
Society of London Series a-Mathematical Physical and Engineering Sciences, 441, No. 1913,
1993 pp. 607–623.
9. Velikorodny, A., Studer, E., Kudriakov, S. and Beccantini, A., Combustion modeling in large scale volumes using EUROPLEXUS code, Journal of Loss Prevention in the Process Industries, 35, 2015, pp. 104.