HAL Id: hal-01844365
https://hal.sorbonne-universite.fr/hal-01844365
Submitted on 19 Jul 2018
HAL is a multi-disciplinary open access
archive for the deposit and dissemination of sci-entific research documents, whether they are pub-lished or not. The documents may come from teaching and research institutions in France or abroad, or from public or private research centers.
L’archive ouverte pluridisciplinaire HAL, est destinée au dépôt et à la diffusion de documents scientifiques de niveau recherche, publiés ou non, émanant des établissements d’enseignement et de recherche français ou étrangers, des laboratoires publics ou privés.
Analysis of microRNA expression in the thymus of
Myasthenia Gravis patients opens new research avenues
Mélanie Cron, Solène Maillard, Fabien Delisle, Nolwenn Samson, Frédérique
Truffault, Maria Foti, Elie Fadel, Julien Guihaire, Sonia Berrih-Aknin, Rozen
Le Panse
To cite this version:
Mélanie Cron, Solène Maillard, Fabien Delisle, Nolwenn Samson, Frédérique Truffault, et al.. Anal-ysis of microRNA expression in the thymus of Myasthenia Gravis patients opens new research av-enues. Autoimmunity Reviews, Elsevier, 2018, 17 (6), pp.588-600. �10.1016/j.autrev.2018.01.008�. �hal-01844365�
1
Analysis of microRNA expression in the thymus of Myasthenia Gravis patients
opens new research avenues
Mélanie A. Crona, Solène Maillarda, Fabien Delislea, Nolwenn Samsona, Frédérique Truffaulta, Maria Fotib, Elie Fadelc, Julien Guihairec, Sonia Berrih-Aknina and Rozen Le Pansea*
a Sorbonne Université, INSERM, Association Institut de Myologie, Center of Research in Myology, UMRS 974, Paris, France
bGenopolis Consortium, Milano-Bicocca University, Milano, Italy
cHôpital Marie Lannelongue, Paris-Sud Université, Le Plessis-Robinson, France
* Corresponding author:
Rozen Le Panse
Center of Research in Myology
UMRS 974 - UPMC Sorbonne Universities - INSERM - AIM 105, Boulevard de l'Hôpital
75013 PARIS - FRANCE
Tel 0033 (0)1 40 77 81 23 Fax 0033 (0)1 40 77 81 29 rozen.lepanse@upmc.fr
Abbreviations: AChR: acetylcholine receptor
DGCR8: DiGeorge syndrome Critical Region gene 8
FC: fold change
FMR1: fragile X mental retardation 1 IFN-I/β: type-I interferon/interferon β
IFNAR: interferon alpha and beta receptor subunit MG : myasthenia gravis
miRNA: micro-RNA
TEC: thymic epithelial cell
WDR1: WD repeat domain 1
2
ABSTRACT
In early-onset Myasthenia Gravis (MG) with anti-acetylcholine receptor antibodies, thymic abnormalities associated with ectopic germinal centers are frequent. miRNAs by acting as post-transcriptional regulators are involved in autoimmunity. To investigate the implication of miRNAs in thymic changes associated with early-onset MG, we performed a miRnome study and data were analyzed with different approaches. miRNAs of interest were further investigated by RT-PCR and transfection experiments for functional tests.
First, analyzing specific dysregulated miRNAs, we focused our attention on 7-5p and miR-125a-5p, and confirmed by RT-PCR their respective down- and up-regulation in MG thymuses. miR-7 was the most down-regulated thymic miRNA in MG and we observed an inverse correlation between its expression and CCL21 mRNA expression. We next showed that miR-7 down-regulation was due to thymic epithelial cells and by transfecting these cells with miR-7, we demonstrated that it controlled CCL21 release. As CCL21 is essential for germinal center development, we suggested that miR-7 could be involved in thymic changes associated with MG. miR-125a was up-regulated in MG thymuses and is of great interest as it is known to regulate FoxP3 expression, and to modulate the different inflammatory signaling pathways. Thanks to this thymic miRnome study, we also showed the specific dysregulation of miRNA clusters. In particular, we observed that miRNAs localized at the extremity of the X chromosome were down-regulated. This effect seemed linked to their close localization to the fragile X mental retardation 1 gene (FMR1) and the DNA methylation status.
Altogether, this miRnome analysis demonstrated that specific thymic miRNAs can be associated with MG and provides novel insights into the pathogenesis of MG.
HIGHLIGHTS
Dysregulated thymic miRNAs are associated with early-onset MG
miR-7-5p, the most down-regulated miRNA, decreases CCL21 expression
Down-expression of miRNA clusters on the X chromosome
3
1. INTRODUCTION
Acquired Myasthenia Gravis (MG) is a rare neuromuscular disease caused by autoantibodies against components of the neuromuscular junction. Over 85% of patients develop autoantibodies against the acetylcholine receptor (AChR). MG patients suffer from invalidating fluctuating skeletal muscle weaknesses. MG is a prototype autoimmune disease and if the target organ is the muscle, the effector organ is the thymus [1] [2]. AChR-MG patients with an early-onset form of the disease (mostly females under 45-50 years old) show thymic abnormalities as the thymus displays the characteristics of tertiary lymphoid organs: chronic inflammation, neoangiogenic processes with high endothelial venule and lymphatic vessel development, chemokine overexpression, such as CXCL13 and CCL21, favoring peripheral-cell recruitment and leading to ectopic germinal center development [3] [4]. These changes seem mainly orchestrated by the abnormal expression of interferon (IFN)-β that is overexpressed in the MG thymus [5] and this could be related to a pathogen infection [6]. Actually, the MG thymus contains all the components for the anti-AChR response: AChR expression by thymic epithelial cells (TECs) and myoid cells, presence of B cells producing anti-AChR antibodies and of anti-anti-AChR autoreactive T cells [1].
MicroRNAs (miRNAs), by acting as post-transcriptional regulators, have a role in physiological and pathophysiological processes, including autoimmune diseases [7]. They are transcribed as primary miRNAs, cleaved into pre-miRNAs by DROSHA and its partner DGCR8 (DiGeorge syndrome Critical Region gene 8) in the nucleus and transported to the cytoplasm by the duo DICER/TRBP1. Mature miRNAs coupled with the RNA-induced silencing complex (RISC, composed among other proteins of DICER, TRBP1, AGO2…) are guided to mRNA targets, leading to their degradation or to the inhibition of their translation, according to the perfect
4 or imperfect miRNA-mRNA matching, respectively [8]. As a given miRNA can have several targets and a mRNA can be targeted by several miRNAs at the same time, regulation by miRNAs is very subtle and complex to apprehend [9]. The level of cytoplasmic miRNAs available to regulate mRNA expression is dependent on different regulation processes, as detailed by Gulyaeva and Kushlinskiy [10].
A few studies have investigated the global role of miRNAs in normal thymuses. In conditional knockout (KO) mice for Dicer or Dgcr8 in TECs, a profound disruption of the thymic architecture and an alteration in TEC cellularity are observed. An important decrease in the number of thymocytes is also observed [11] [12]. The lack of mature miRNAs in TECs can affect thymopoïesis [13], the expression of the autoimmune regulator (AIRE) and of tissue-specific antigens [14]. Surprisingly, in conditional Dicer-TEC KO mice, epithelial voids appear due to epithelial apoptosis and an unusual presence of CD19+ B cells is observed [11]. Specific miRNAs can also play key roles in thymus homeostasis and thymopoïesis and their regulation must be tightly controlled. Environmental factors, such as infections, are able to modify the expression of miRNAs and eventually alter the thymic function [15] [16]. For example, in mice miR-29a is an important regulator of the type I IFN (IFN-I) signaling pathway by targeting a subunit of its receptor (IFNAR1) in TECs and by reducing cell-sensitivity to IFN-I and consequently to pathogen infections [11].
We then hypothesized that dysregulated miRNAs could play a role in thymic changes leading to MG. By investigating for the first time the global expression of miRNAs and clusters of miRNAs in the thymus of early-onset MG patients, we bring new knowledge in post-transcriptional mechanisms associated with thymic changes in MG and opens new research avenues on myasthenia gravis.
5
2. MATERIALS AND METHODS
2.1. Patient selection and thymic samples
Thymic biopsies were collected from early-onset MG patients undergoing thymectomy and healthy donors undergoing cardiovascular surgery at the Marie Lannelongue Surgical Center (Le Plessis-Robinson, France). Briefly, MG and control thymuses from female donors were used for the miRnome study and RT-PCR (controls (n=6, 15-33 years old); untreated MG (n=12) and corticoid-treated MG (n=8) patients were detailed in table 1). MG and control thymuses from female and male donors were used for thymocytes extraction (controls (n=5, from 9 days to 27 years old); MG (n=12-Table 1)) and for TEC cultures (controls (n=10, 10-35 years old); MG (n=13-Table 1)). MG patients were only treated with cholinesterase inhibitors except for a group of corticosteroid-treated patients for Fig. 4B (Table 1). Patients had no other known diseases including thymoma. All the studies on thymuses were approved by a local ethics committee (CPP, authorization number ID RCB 2010-A00250-39) and informed consent forms have been collected.
2.2. RNA preparation
Total RNA from thymic biopsies was extracted using the mirVana miRNA Isolation Kit, according to the manufacturer’s instructions (Life Technologies, Villebon-sur-Yvette, France). Thymic fragments were lysed directly in the Lysis/Binding Solution provided in the kit using the FastPrep FP120 instrument (Qbiogen, Illkirch, France). RNA quality was assessed (Bioanalyzer 2100, Agilent Technologies, Les Ulis, France) and samples with a RNA Integrity Number (RIN) over 7 were used in our experiments.
6
2.3. miRNA profiling
Global miRNA expression analyses were performed using the Affymetrix GeneChip miRNA 3.0 Array (Santa Clara, USA). Chips contained 3391 human miRNAs (1658 pre-miRNAs and 1733 mature miRNAs) and 2216 human snoRNAs, CDBox RNAs, H/ACA Box RNAs and scaRNAs. Briefly, 1 µg of total RNA was labeled using the flashTag Biotin HSR RNA Labeling Kit (Affymetrix), followed by the hybridization overnight according to the manufacturer’s instructions. Afterwards, miRNA chips were then scanned with the Affymetrix GeneChip Scanner 3000.
2.4. miRNA data analyses
The quality control of the scanned data was first estimated by confirming the order of the signal intensities of the Poly-A and hybridization controls using the Affymetrix GeneChip Expression Console. Then raw expression values were generated as “.CEL files” and “.CHP files” and were analyzed into the Transcriptome Analysis Console Software (TAC). The average for the intensity of fluorescence for each small RNA is calculated with the Tukey’s Biweight method that calculates a robust average unaffected by outliers. The Tukey's Biweight average values are given in tables 2A-B in a log2 scale. TAC computes and summarizes a traditional unpaired One-Way Analysis of Variance (ANOVA) for each pair of condition groups. The fold changes (FCs) are given in linear values for MG versus control data. We selected small human RNAs that were dysregulated with a FC over 1.5 or -1.5 and p-value ≤ 0.05. Other miRNAs of interest could have also been extracted if we had lowered the fold change threshold and these miRNAs can be found in the supplemental table S1.
To search for miRNA clusters susceptible to be dysregulated in MG patients versus controls, we compared for each chromosome the number of dysregulated miRNAs with a χ2 test in
7 table 2A to the number of mature human miRNAs spotted on the Affymetrix GeneChip miRNA 3.0 Array.
2.5. Combined miRNA and mRNA data analyses
To sort out dysregulated miRNAs that could modulate gene expression in the thymus of MG patients, we have used the web resource MAGIA2 (gencomp.bio.unipd.it/magia2/) [17]. This web tool allows the analyses of miRNA and mRNA expression data for the detection of inversely correlated miRNA and mRNA pairs. The integration of target predictions with miRNA and gene expression profiles improves the detection of functional miRNA-mRNA relationships. We have used transcriptomic data obtained on thymus samples from MG patients and controls. This study has been published in 2006 [18] and data are available on the ArrayExpress database – accession no. E-MEXP-518 (www.ebi.ac.uk/arrayexpress).
For the mRNA matrix, we uploaded dysregulated gene transcripts with a FC of 1.8 and a p-value under 0.05 (97 up- and 154 down-regulated mRNAs) [18]. For the miRNA matrix, as fold changes were less discriminative, all mature miRNA (1733) expression data were uploaded. For non-matched miRNA and mRNA expression data, a meta-analysis based on the inverse χ2 distribution identified oppositely variable miRNA-target gene pairs. Two target prediction databases that are regularly updated, were used with a medium stringency: 1) Targetscan predicts miRNA targets by searching for conserved and non-conserved 8- to 6-mer sites in the 3’UTR of protein-coding transcripts [19], 2) DIANA-microT identifies miRNA targets in the 3’UTR but also in the coding sequence of protein-coding transcripts [20].
2.6. Retro-Transcription and Polymerase Chain Reaction (RT-PCR)
RT-PCR on mRNA were performed as previously described [5]. miRNAs were retro-transcribed using TaqMan® MicroRNA RT Kit (Life Technologies) according to the manufacturer’s
8 instructions. PCR reactions were carried out on a Light Cycler 480 (Roche, Meylan, France) using the TaqMan® Universal Master Mix II, no UNG (Life Technologies). The PCR cycle conditions were as followed: a cycle of denaturation of 10 minutes at 95°C, 50 cycles of amplification of 15 seconds at 95°C and 1 minute at 60°. miRNA expression was normalized to 28S rRNA or GAPDH mRNA expression. Primer sequences and references are listed in tables S2A-B.
2.7. Primary TEC cultures for transfection or methylation experiments
Primary thymic epithelial cells (TECs) were cultured from thymic explants and correspond mainly to medullary TECs as previously described [21]. TECs were transfected with Lipofectamine RNAiMax (Life Technologies). Briefly, 40pmol of miR-7-5p or scramble RNA (Eurogentec, Seraing, Belgium) were diluted in 50µl of X-vivo15 medium (Lonza, Switzerland). In parallel, 4µl of Lipofectamine RNAiMax were diluted in 50µl of X-vivo15 medium. Then, both solutions were mixed and incubated for 20 minutes at room temperature. The resulting mixes were added to cultured cells (4 x10⁵ cells per well) at a ratio of 1:4 of X-vivo15 medium in 12-well plates for 48h.
For methylation experiments, TECs were seeded in RPMI containing 10% of fetal calf serum (5 x10⁵ cells per well) and treated after 24 hours with 5µM of 5-Azacytidine for 48 hours. TECs were then lysed for total RNA extraction.
2.8. CCL21 ELISA
CCL21 antibody (AF366, R&D Systems, Lille, France) was diluted at 1 µg/ml in coating buffer (50 mM NaHCO3 and 50 mM Na2CO3, pH 9.4) and incubated overnight at 4°C. TEC culture medium (1.5mg/mL of proteins) were incubated for 3 hours, and subsequently, 0.25 µg/ml of biotinylated anti-CCL21 (BAF366, R&D Systems), and streptavidin-horseradish peroxidase (Life
9 Technologies) were added. Tetramethylbenzidine (BioLegend, United Kingdom) was used for color development and plates were read at 450 nm on a SPARK 10M microplate reader (TECAN Life Sciences, Grödig, Austria).
2.9. Statistical analyses
In dot graphs, 2-by-2 comparisons were done using the non-parametric Mann-Whitney or Wilcoxon tests as indicated in the figure legends. For correlation analyses, significance was assessed using a Pearson’s correlation test.
10
3. RESULTS
3.1. Analysis of differentially expressed miRNAs in the thymus of MG patients
Thymic miRNA expression profiles were compared between MG patients and age-matched female controls. Table S1 lists all miRNAs analyzed on the Affymetrix miRNA arrays. Analyzing all human miRNAs that were dysregulated in MG thymuses (FC ≥1.5 and p≤0.05), we found 74 miRNAs (Tables 2A-B and Fig. 1A): 61 mature miRNAs (24- up and 37 down-regulated) and 13 pre-miRNAs (10 up- and 3 regulated) (Table 2B). 5 of the pre-miRNAs (3 up- and 2 down-regulated) were also found dysregulated as mature miRNAs: miR-548w, miR-4538, miR-4539 and miR-30e, miR-363 (Tables 2A-B).
To confirm the expression profile of the most down-regulated miRNAs (miR-429-3p, miR-7-5p and miR-1-5p) or the most up-regulated miRNAs (miR-138-1-3p, miR-486-5p and miR-4455-5p) (Fig. 1B-G), we analyzed by RT-PCR their level of expression. Although the decrease or the increase of these miRNAs were consistently confirmed, the differences between MG and controls were only significant in RT-PCR for miR-486-5p and miR-7-5p (Fig. 1H-M).
3.2. Analysis of miR-7 expression in the MG thymus
From the miRnome analysis, miR-7-5p was one of the most down-regulated miRNAs in the thymus of MG patients and we confirmed by RT-PCR its down-regulation in MG thymuses compared to controls (Fig. 1I). We then demonstrated that miR-7-5p was even more down-regulated in the thymus of patients with a high degree of thymic hyperplasia (Fig. 2A). In corticoid-treated patients, miR-7-5p was still down-regulated compared to non-MG donors but a slight increase was observed when comparing corticoid-treated patients with MG patients with a high degree of hyperplasia (Fig. 2A). To further investigate the miRnome data, we also measured the level of expression of other miR-7 members: miR-7-1-3p and miR-7-2-3p. We confirmed the specific down-regulation of miR-7-5p (the leading strand) in MG
11 thymuses, as we did not observe any change for miR-7-1-3p and miR-7-2-3p (the passenger strands) expression in the thymus of MG and control donors (Fig. 2B-C). We next analyzed if the down-regulation of miR-7-5p was observed in the two main thymic cell types: TECs obtained from thymic explants after 7 days in culture and thymocytes freshly obtained from thymic biopsies. miR-7-5p was expressed in both cell types but very weakly in thymocytes. We observed a down-expression of miR-7-5p in TECs from MG patients compared to TECs from controls (Fig. 2D). In contrast, in freshly isolated thymic cell suspension, we observed a higher expression level of miR-7-5p in cells from MG patients compared to controls (Fig. 2E). This increase was not correlated with the presence of B cells in thymic-cell suspensions from MG patients as no correlations were observed compared to CD19 mRNA expression (data not shown). All these data confirmed that miR-7-5p was down-regulated in the thymus of MG in relation to a decrease in TECs.
3.3. Effect of miR-7 on CCL21 expression in thymic epithelial cells
From predictive databases, we determined that miR-7-5p was of particular interest as it targets mRNAs of several genes involved in MG (Fig. 2F-G). As we observed a direct inverse correlation between miR-7-5p expression and CCL21 mRNA in the thymus (Fig. 2H), we investigated whether miR-7-5p could inhibit CCL21 expression in TECs. We then carried out transfection experiments in TECs and analyzed the level of CCL21 released in the culture medium after 48h. First, we demonstrated the efficiency of our transfections in primary TEC cultures by evaluating the intracellular level of miR-7-5p after transfection (Fig. 2I). Next, we demonstrated that CCL21 protein levels were decreased from 9 to 20% when TECs were transfected with miR-7-5p compared to a scramble RNA (Fig. 2J). These results sustain that miR-7 has an effect on CCL21 protein expression and a decrease in miR-7-5p expression could be responsible for the overexpression of CCL21 in MG thymuses [4].
12
3.4. Search for inverse correlation for miRNA and mRNA expression data
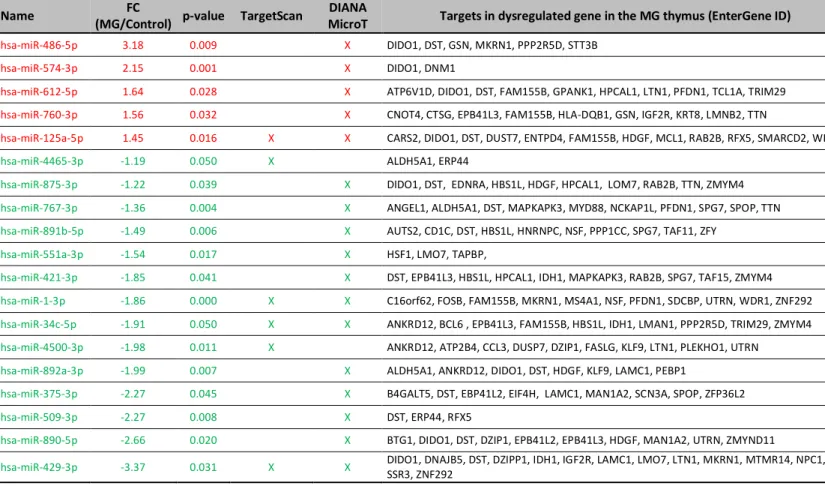
To sort out dysregulated miRNAs that could modulate gene expression in the thymus of MG patients, we have used the web resource MAGIA2 as fully detailed in the method section. We identified mature miRNAs and genes possibly regulated by transcription factors, whose expression levels were inversely correlated in the thymus of MG patients. The target prediction databases, Targetscan and DIANA-microT extracted 6 miRNAs (1 up- and 5 down-regulated) and 16 miRNAs (4 up- and 12 down-down-regulated), respectively. Among them, 486-5p was again put forward as an up-regulated miRNA in MG patients. 125a-5p, miR-34c-5p, miR-1-5p and miR-429-3p were identified by both predictive databases (Fig. 3A-B and Table 3).
Among these dysregulated miRNAs, we analyzed by PCR the expression of miR-125a-5p and confirmed its up-regulation in the thymus of MG patients (Fig. 3C). Among miR-125a-5p targets listed in table 3, we were particularly interested in WDR1 (WD repeat-containing protein 1), a molecule recently implicated in auto-inflammatory processes [22]. We then showed that WDR1 mRNA expression was significantly decreased in the thymus of MG patients and that its expression was indeed inversely correlated with miR-125a-5p expression (Fig. 3D-E).
3.5. Analysis of chromosomal cluster dysregulation
In the list of dysregulated mature miRNAs (Table 2A), we observed a high representation of miRNAs from the chromosomes 14 and X. Using a χ2 test, we demonstrated for up-regulated mature miRNAs a significant overrepresentation of chromosomes 4, 8, 14 and X. For chromosomes 4 and 8, miRNAs were found up-regulated but they were spread along each chromosome (Fig. 4A and Table 2A). In contrast, for miRNAs up-regulated on chromosome 14, miR-4538-5p, miR-4539-3p, miR-4710-5p were all located in the 14q32.33 region on the
13 negative DNA strand. Moreover, pre-miRNAs for miR-4539 and miR-4538 were also found upregulated (Table 2B). All these miRNAs belong to a miRNA cluster well referenced in miRbase.
We found for down-regulated mature miRNAs a significant overrepresentation of miRNAs located on the negative DNA strand at the extremity of the long arm of the X chromosome (Fig. 4A and Table 2A): miR-20b-3p*, miR-363-3p and miR-509-3p, miR-890-5p and miR-892b-3p. miR-20b-3p* and miR-363-3p belong to a referenced cluster in the Xq26.2 region, while miR-890-5p, miR-892b-3p and miR-509-3p belong to two other miRNA clusters in the Xq27.3 region. These miRNAs were all found down-expressed (Table 2A). We selected 2 of these miRNAs for validation by RT-PCR: miR-20b-3p* and miR-892b-3p, and confirmed their decreased expression in MG thymuses compared to controls (Fig. 4B-E).
This chromosomal region corresponds to a fragile site where the fragile X mental retardation 1 (FMR1) gene locates. Analyzing the level of expression of FMR1 in the thymus, we observed also a significant decreased expression in MG patients (Fig. 4F). FRM1 expression level is linked to the degree of methylation of its 5’UTR sequence that could also impact the level of expression of miRNAs that are encoded nearby [23]. We then checked on TEC cultures if FMR1, miR-892b-3p and miR-20b-3p* were conjointly regulated by DNA methylation. TEC cultures were treated for 48h by 5-Azacytidine, a molecule causing hypomethylation of DNA. Changes in miR-20b-3p* expression could not be analyzed as this miRNA was hardly expressed in TECs. However, we observed a concomitant increased expression of FMR1 and of miR-892b-3p after demethylation (Fig. 4G-H). Altogether, these results suggest that the degree of methylation of this chromosomal region could explain the low level of FMR1 as well as miRNAs, and could play a role in MG.
14
4. DISCUSSION
MG patients with anti-AChR antibodies very often display thymic abnormalities with neoangiogenic processes and follicular hyperplasia characterized by the development of ectopic germinal centers. Here, we investigated dysregulated miRNAs that could help to understand the impact of post-transcriptional mechanisms on events leading to thymic changes associated with MG.
4.1. Specific dysregulated miRNAs in MG
We used two different approaches to search for dysregulated miRNAs in the MG thymus: a classical approach based on the fold change of miRNA expression and another approach taking into account the inverse correlation between the miRNA and mRNA expression levels. We validated by PCR the overexpression of miR-486-5p and miR-125a-5p, and the down-expression of miR-20b-3p*, miR-892b-3p and miR-7-5p. Among these miRNAs, we focus our interest on miR-7-5p as detailed below (paragraph 4.2), but miR-125a-5p and miR-20b-3p* are also of interest in the context of MG and autoimmunity. A decreased expression of miR-20b-3p* has already been observed in the serum of early-onset MG patients [24]. Xin et al. also showed a decreased expression of miR-20b in the serum of thymoma-associated MG, and in thymoma compared to non-thymomatous adjacent tissues. They demonstrated that the decrease of 20b could favor T-cell proliferation [25] but a lower expression level of miR-20b could also favor Th17-cell differentiation as observed in multiple sclerosis [26]. Lately, miR-20b has been characterized as an inhibitor of the inflammation by acting on NLRP3 (NLR Family Pyrin Domain Containing 3), a key protein of the inflammasome [27]. Therapies aiming at restoring miR-20b expression in MG but also in other autoimmune conditions could have a
15 beneficial impact on disease evolution as described with Natalizumab in multiple sclerosis [28].
Here, we observed that miR-125a-5p was overexpressed in the thymus of early-onset MG patients and this miRNA has also been described as up-regulated in thymoma-associated MG. It is suggested that it could be involved in the regulation of FoxP3 expression which is decreased in thymoma-associated MG [29] [30]. FoxP3 is an indispensable transcription factor for the generation and the regulatory function of regulatory T cells. The suppressive activity of regulatory T cells is severely impaired in early-onset MG patients and associated with a decreased expression of FoxP3 in CD4+ T cells [31]. Altogether, this suggests that miR-125a could play a role in the decreased functionality of regulatory T cells in MG patients. Here, we demonstrated an inversed correlation in the expression of miR-125a-5p and of WDR1, one of its mRNA target extracted with MAGIA2. WDR1 has been implicated in auto-inflammatory processes associated with 18 expression [22]. This observation is of particular interest as IL-18 is overexpressed in the serum of MG patients [32] and the administration of an anti-IL-IL-18 antibody to myasthenic rats leads to the alleviation of clinical symptoms [33]. miR-125a could also target other mRNAs such as TNFAIP3 (Tumor Necrosis Factor Alpha-Induced Protein 3), also known as A20. TNFAIP3 is essential for the development and function of immune cells and has been implicated in the pathogenesis of various autoimmune diseases [34]. TNFAIP3 is a key molecule in the negative regulation of NF-κB (Nuclear Factor κB) and also TLR (Toll-Like Receptor) signaling pathways [35] [36]. Consequently, increased expression of miR-20b and miR-125a could modulate inflammatory pathways and could play a key role in MG and in other autoimmune diseases [34] [37].
16 Consequently, these observations suggest that miRNAs such as or miR-125a-5p can modulate inflammatory pathways and could play a key role in MG and in other autoimmune diseases.
4.2. miR-7 downregulation is involved in thymic changes
We validated that miR-7-5p was the most down-regulated miRNA in MG thymuses and this was due to its down-regulation in TECs. We showed that the level of miR-7 expression was even more decreased in highly hyperplastic thymuses. Interestingly, in corticoid-treated patients, miR-7 expression was higher than in hyperplastic thymuses. Altogether, this suggests that miR-7 could vary along with treatments and the hyperplastic state of the thymus.
miR-7 was initially described in cancers but more recently its potential implication in autoimmune conditions has been highlighted. miR-7 expression is downregulated in the serum of patients with dermatomyositis and neuromyelitis optica [38] [39]. However, we did not observe such decrease in the serum of MG patients (data not shown). miR-7 expression seems to be decreased in inflammatory tissues. As observed in MG thymuses, miR-7 is also downregulated in the skin of dermatomyositis patients [38] and in actively inflamed Crohn’s disease colonic tissues [40].
Using prediction databases, we found that miR-7-5p can interact with the 3’-UTR region of CCL21. More, we observed that miR-7-5p and CCL21 mRNA expression were inversely correlated in the thymus of MG patients. CCL21 plays an important role in thymopoïesis. It is mainly secreted by TECs promoting the recruitment of pro-thymocytes and later on the migration of CD4+ thymocytes towards the medulla region [41]. In the MG thymus, CCL21 is abnormally overexpressed and this is mainly due to ectopic lymphatic vessels [4], but also to a lesser extent by TECs. Indeed, IFN-β that is overexpressed in MG thymuses can induce CCL21 expression in lymphatic endothelial cells and TECs [5]. As miR-7-5p down-regulation was
17 observed in MG TECs, we investigated its effects by transfecting miR-7-5p in primary TEC cultures. We showed that miR-7-5p could decrease CCL21 release by TECs. This suggests that decreased miR-7-5p expression in MG thymuses could affect CCL21 expression and disturb intrathymic-cell migration. We did not investigate the impact of miR-7-5p transfection in thymic lymphatic endothelial cells that have been shown to highly expressed CCL21 in MG thymuses. The level of post-transcriptional regulation of mRNAs by miRNAs is probably cell-dependent and the effects of miR-7-5p could be higher in lymphatic endothelial cells.
Altogether our results suggest that an abnormal expression of miR-7 could participate in the abnormal expression of CCL21 associated with thymic changes observed in MG patients.
4.3. Dysregulated miRNA clusters suggest the implication of X chromosome in MG
Analyzing the chromosomal localization of dysregulated miRNAs, we observed a significant overrepresentation of two chromosomal regions. miRNAs overexpressed in 14q32.33 correspond to a cluster of miRNAs, including miR-4537, miR-4538, miR-4539 and miR-4507. This chromosomal region was also found significantly overrepresented in a thymic transcriptome study of MG patients [18]. It corresponds to the immunoglobulin heavy chain locus and its overrepresentation likely reflects the increased number of B cells in MG thymus. The miRNAs encoded by this cluster are not considered as intragenic miRNAs but they could be transcribed together with immunoglobulin heavy chain genes as they are encoded on the same DNA strand and on overlapping regions.
Analyzing specific dysregulated miRNA from table 2A, we also found a significant overrepresentation of down-regulated miRNAs encoded by the Xq27.3 and Xq26.2 regions. The importance of miRNAs in the Xq27.3 region was also pointed out by our analysis of inverse correlation for miRNA and mRNA expression (Table 3). The dysregulated miRNAs in these
18 chromosomal regions has not yet been linked to autoimmunity and inflammation, except miR-20b, as detailed in paragraph 4.1. As many autoimmune diseases, MG is predominantly observed in females, and autoimmunity is much higher in patients with X-linked disorders [42]. The Xq27.3 chromosomal region encodes for the FMR1 gene implicated in the Fragile X syndrome, a form of X-linked mental retardation. This syndrome results from the expansion of CGG repeat sequences in the 5′ untranslated region of the FMR1 gene. Normal alleles are considered to have between 5 and 44 CGG repeats, alleles with 45 to 54 repeats are intermediate (grey zone), alleles with 55 to 200 repeats constitute premutated FMR1 and over 200 repeats alleles present a full mutation. Individuals with FMR1 full mutation or premutations display immune-mediated disorders and in particular a higher risk to develop autoimmune diseases [43] [44].
The regulation of FMR1 expression is very complex and dependent on the number of CGG repeat sequences in 5’UTR and the subsequent DNA methylation level, especially for individuals with the full mutation genotype. However, the presence of a methylation boundary region upstream FMR1 promoter and of four CTCF binding sites are also important for FMR1 expression. CTCF is an important transcriptional regulator of genes harboring trinucleotide repeats and it is mostly active in chromatin organization [45] [46].
Analyzing FMR1 mRNA expression, we observed a significant decreased expression in the thymus of MG patients. Of note, the expression of FMR2/AFF2, a gene localized near FMR1 was also strongly decreased in the thymus of MG patients (data not shown). We also demonstrated that demethylation with 5-Azacytidine of control TEC cultures increased FMR1 expression concomitantly with the increased expression of miR-892b-3p. miRNAs that were found down-regulated in our study could have been impacted by the higher methylation
19 status of DNA in this region even if there are on opposite strands [47]. This suggest that genes and miRNAs encoded in this chromosomal region could be conjointly regulated and it raises the issue of a link between autoimmunity and this chromosomal region.
5. CONCLUSION
Studies have been carried out to investigate the implication of miRNAs in physiological and pathophysiological mechanisms. Here for the first time, we investigated with different approaches dysregulated miRNAs in the thymus of MG patients. We demonstrated that specific miRNAs were implicated in thymic changes associated with MG, in particular, miR-7-5p but others such as miR-125a-miR-7-5p and miR-20b-3p* are also of interest. We also demonstrated a decreased expression of genes and miRNA clusters localized at the extremity of the X chromosome with a potential link with autoimmunity. Altogether this detailed analysis of the thymic miRnome is of great interest bringing new knowledge in the etiological and pathophysiological mechanisms involved in early-onset MG.
20
Acknowledgments
We would like to thank Perrine Cufi for her technical assistance, Dr Vincent de Montpreville and Sylvie Planté from the anatomy and histology department from the Marie Lannelongue Surgical Center and Lilia Lamrani for the management of thymus collect. Dr Florent Dumont and Dr Micaela Polay-Espinoza for their advice regarding miRnome analyses. We also would like to thank Dr Nadine Dragin and Marine Guilbaud for helpful discussion and Damien Amelin for his technical advice.
This work was supported by grants from the European Community (FIGHT-MG/HEALTH-2009-242-210) and from the “Association Française contre les Myopathies” (AFM).
Authorship
MAC, SM, FD, NS performed and analyzed the experiments, FT collected samples and provided patient information, MF performed the miRnome experiment, EF and JG provided thymic biopsies, SB-A and SM read and revised the manuscript, MAC and RLP designed the study, analyzed the experiments and wrote the manuscript.
Conflict of interest
21
REFERENCES
[1] Berrih-Aknin S, Le Panse R. Myasthenia gravis: A comprehensive review of immune dysregulation and etiological mechanisms. J Autoimmun, 2014;52:90-100.
[2] Marx A, Pfister F, Schalke B, Saruhan-Direskeneli G, Melms A, Strobel P. The different roles of the thymus in the pathogenesis of the various myasthenia gravis subtypes. Autoimmun Rev, 2013;12:875-84.
[3] Méraouna A, Cizeron-Clairac G, Le Panse R, Bismuth J, Truffault F, Talaksen C et al. The chemokine CXCL13 is a key molecule in autoimmune Myasthenia Gravis. Blood, 2006;108:432-40.
[4] Berrih-Aknin S, Ruhlmann N, Bismuth J, Cizeron-Clairac G, Zelman E, Shachar I et al. CCL21 overexpressed on lymphatic vessels drives thymic hyperplasia in myasthenia. Ann Neurol, 2009;66:521-31.
[5] Cufi P, Dragin N, Ruhlmann N, Weiss JM, Fadel E, Serraf A et al. Central role of interferon-beta in thymic events leading to myasthenia gravis. J Autoimmun, 2014;52:44-52.
[6] Cavalcante P, Cufi P, Mantegazza R, Berrih-Aknin S, Bernasconi P, Le Panse R. Etiology of myasthenia gravis: innate immunity signature in pathological thymus. Autoimmun Rev, 2013;12:863-74.
[7] Chen JQ, Papp G, Szodoray P, Zeher M. The role of microRNAs in the pathogenesis of autoimmune diseases. Autoimmun Rev, 2016;15:1171-80.
[8] Winter J, Jung S, Keller S, Gregory RI, Diederichs S. Many roads to maturity: microRNA biogenesis pathways and their regulation. Nat Cell Biol, 2009;11:228-34.
[9] Ebert MS, Sharp PA. Roles for microRNAs in conferring robustness to biological processes. Cell, 2012;149:515-24.
[10] Gulyaeva LF, Kushlinskiy NE. Regulatory mechanisms of microRNA expression. Journal of translational medicine, 2016;14:143.
[11] Papadopoulou AS, Dooley J, Linterman MA, Pierson W, Ucar O, Kyewski B et al. The thymic epithelial microRNA network elevates the threshold for infection-associated thymic involution via miR-29a mediated suppression of the IFN-alpha receptor. Nat Immunol, 2012;13:181-7.
[12] Khan IS, Taniguchi RT, Fasano KJ, Anderson MS, Jeker LT. Canonical microRNAs in thymic epithelial cells promote central tolerance. Eur J Immunol, 2014;44:1313-9.
22 [13] Zuklys S, Mayer CE, Zhanybekova S, Stefanski HE, Nusspaumer G, Gill J et al. MicroRNAs control the maintenance of thymic epithelia and their competence for T lineage commitment and thymocyte selection. J Immunol, 2012;189:3894-904.
[14] Ucar O, Tykocinski LO, Dooley J, Liston A, Kyewski B. An evolutionarily conserved mutual interdependence between Aire and microRNAs in promiscuous gene expression. Eur J Immunol, 2013.
[15] Belkaya S, Silge RL, Hoover AR, Medeiros JJ, Eitson JL, Becker AM et al. Dynamic modulation of thymic microRNAs in response to stress. PloS one, 2011;6:e27580.
[16] Linhares-Lacerda L, Palu CC, Ribeiro-Alves M, Paredes BD, Morrot A, Garcia-Silva MR et al. Differential Expression of microRNAs in Thymic Epithelial Cells from Trypanosoma cruzi Acutely Infected Mice: Putative Role in Thymic Atrophy. Frontiers in immunology, 2015;6:428.
[17] Bisognin A, Sales G, Coppe A, Bortoluzzi S, Romualdi C. MAGIA(2): from miRNA and genes expression data integrative analysis to microRNA-transcription factor mixed regulatory circuits (2012 update). Nucleic Acids Res, 2012;40:W13-21.
[18] Le Panse R, Cizeron-Clairac G, Bismuth J, Berrih-Aknin S. Microarrays reveal distinct gene signatures in the thymus of seropositive and seronegative myasthenia gravis patients and the role of CC chemokine ligand 21 in thymic hyperplasia. J Immunol, 2006;177:7868-79. [19] Agarwal V, Bell GW, Nam JW, Bartel DP. Predicting effective microRNA target sites in
mammalian mRNAs. eLife, 2015;4.
[20] Paraskevopoulou MD, Georgakilas G, Kostoulas N, Vlachos IS, Vergoulis T, Reczko M et al. DIANA-microT web server v5.0: service integration into miRNA functional analysis workflows. Nucleic Acids Res, 2013;41:W169-73.
[21] Cufi P, Dragin N, Weiss JM, Martinez-Martinez P, De Baets MH, Roussin R et al. Implication of double-stranded RNA signaling in the etiology of autoimmune myasthenia gravis. Ann Neurol, 2013;73:281-93.
[22] Kim ML, Chae JJ, Park YH, De Nardo D, Stirzaker RA, Ko HJ et al. Aberrant actin depolymerization triggers the pyrin inflammasome and autoinflammatory disease that is dependent on IL-18, not IL-1beta. J Exp Med, 2015;212:927-38.
[23] Wheeler AC, Bailey DB, Jr., Berry-Kravis E, Greenberg J, Losh M, Mailick M et al. Associated features in females with an FMR1 premutation. Journal of neurodevelopmental disorders, 2014;6:30.
23 [24] Chunjie N, Huijuan N, Zhao Y, Jianzhao W, Xiaojian Z. Disease-specific signature of serum miR-20b and its targets IL-8 and IL-25, in myasthenia gravis patients. Eur Cytokine Netw, 2015;26:61-6.
[25] Xin Y, Cai H, Lu T, Zhang Y, Yang Y, Cui Y. miR-20b Inhibits T Cell Proliferation and Activation via NFAT Signaling Pathway in Thymoma-Associated Myasthenia Gravis. BioMed research international, 2016;2016:9595718.
[26] Zhu E, Wang X, Zheng B, Wang Q, Hao J, Chen S et al. miR-20b suppresses Th17 differentiation and the pathogenesis of experimental autoimmune encephalomyelitis by targeting RORgammat and STAT3. J Immunol, 2014;192:5599-609.
[27] Lou J, Wang Y, Zhang Z, Qiu W. MiR-20b inhibits mycobacterium tuberculosis induced inflammation in the lung of mice through targeting NLRP3. Exp Cell Res, 2017;358:120-8. [28] Ingwersen J, Menge T, Wingerath B, Kaya D, Graf J, Prozorovski T et al. Natalizumab restores aberrant miRNA expression profile in multiple sclerosis and reveals a critical role for miR-20b. Ann Clin Transl Neurol, 2015;2:43-55.
[29] Li J, Qiu D, Chen Z, Du W, Liu J, Mo X. Altered expression of miR-125a-5p in thymoma-associated myasthenia gravis and its down-regulation of foxp3 expression in Jurkat cells. Immunol Lett, 2016;172:47-55.
[30] Nishi T, Yokoyama S, Takamori S, Matsuo T, Murakami D, Akagi Y et al. Thymoma in Patient with Myasthenia Gravis Has Significantly Fewer Forkhead Box P3 Positive Lymphocytes than that without One. Kurume Med J, 2015;61:65-71.
[31] Balandina A, Lecart S, Dartevelle P, Saoudi A, Berrih-Aknin S. Functional defect of regulatory CD4(+)CD25+ T cells in the thymus of patients with autoimmune myasthenia gravis. Blood, 2005;105:735-41.
[32] Jander S, Stoll G. Increased serum levels of the interferon-gamma-inducing cytokine interleukin-18 in myasthenia gravis. Neurology, 2002;59:287-9.
[33] Souroujon MC, Maiti PK, Feferman T, Im SH, Raveh L, Fuchs S. Suppression of myasthenia gravis by antigen-specific mucosal tolerance and modulation of cytokines and costimulatory factors. Ann N Y Acad Sci, 2003;998:533-6.
[34] Zhang M, Peng LL, Wang Y, Wang JS, Liu J, Liu MM et al. Roles of A20 in autoimmune diseases. Immunol Res, 2016;64:337-44.
[35] Kim SW, Ramasamy K, Bouamar H, Lin AP, Jiang D, Aguiar RC. MicroRNAs miR-125a and miR-125b constitutively activate the NF-kappaB pathway by targeting the tumor necrosis
24 factor alpha-induced protein 3 (TNFAIP3, A20). Proc Natl Acad Sci U S A, 2012;109:7865-70.
[36] Hamerman JA, Pottle J, Ni M, He Y, Zhang ZY, Buckner JH. Negative regulation of TLR signaling in myeloid cells--implications for autoimmune diseases. Immunol Rev, 2016;269:212-27.
[37] Avidan N, Le Panse R, Harbo HF, Bernasconi P, Poulas K, Ginzburg E et al. VAV1 and BAFF, via NFkB pathway, are genetic risk factors for myasthenia gravis. Annals of Clinical and Translational Neurology, 2014.
[38] Oshikawa Y, Jinnin M, Makino T, Kajihara I, Makino K, Honda N et al. Decreased miR-7 expression in the skin and sera of patients with dermatomyositis. Acta Derm Venereol, 2013;93:273-6.
[39] Vaknin-Dembinsky A, Charbit H, Brill L, Abramsky O, Gur-Wahnon D, Ben-Dov IZ et al. Circulating microRNAs as biomarkers for rituximab therapy, in neuromyelitis optica (NMO). Journal of neuroinflammation, 2016;13:179.
[40] Nguyen HT, Dalmasso G, Yan Y, Laroui H, Dahan S, Mayer L et al. MicroRNA-7 modulates CD98 expression during intestinal epithelial cell differentiation. J Biol Chem, 2010;285:1479-89.
[41] Kurobe H, Liu C, Ueno T, Saito F, Ohigashi I, Seach N et al. CCR7-dependent cortex-to-medulla migration of positively selected thymocytes is essential for establishing central tolerance. Immunity, 2006;24:165-77.
[42] Larizza D, Calcaterra V, Martinetti M. Autoimmune stigmata in Turner syndrome: when lacks an X chromosome. J Autoimmun, 2009;33:25-30.
[43] Winarni TI, Chonchaiya W, Sumekar TA, Ashwood P, Morales GM, Tassone F et al. Immune-mediated disorders among women carriers of fragile X premutation alleles. American journal of medical genetics Part A, 2012;158A:2473-81.
[44] Pretto DI, Eid JS, Yrigollen CM, Tang HT, Loomis EW, Raske C et al. Differential increases of specific FMR1 mRNA isoforms in premutation carriers. J Med Genet, 2015;52:42-52. [45] Naumann A, Hochstein N, Weber S, Fanning E, Doerfler W. A distinct DNA-methylation
boundary in the 5'- upstream sequence of the FMR1 promoter binds nuclear proteins and is lost in fragile X syndrome. Am J Hum Genet, 2009;85:606-16.
[46] Lanni S, Goracci M, Borrelli L, Mancano G, Chiurazzi P, Moscato U et al. Role of CTCF protein in regulating FMR1 locus transcription. PLoS Genet, 2013;9:e1003601.
25 [47] He C, Zhao X, Jiang H, Zhong Z, Xu R. Demethylation of miR-10b plays a suppressive role in ccRCC cells. International journal of clinical and experimental pathology, 2015;8:10595-604.
26
FIGURE LEGENDS
Figure 1: Dysregulated mature and precursor miRNAs in MG thymuses compared to controls.
(A) Volcano plot of differentially expressed miRNAs identified using Affymetrix GeneChip 3.0 miRNA Arrays and using the Transcriptome Analysis Console Software. Comparison of miRNAs expressed in the thymus of MG patients (n=12) versus adult controls (n=6). The vertical lines correspond to fold changes of 1.5 for up or down-regulated miRNAs in Log2. The horizontal line delineates a p-value of 0.05 in Log10. The red (34) and green (40) points represent the differentially expressed miRNAs with statistical significance for up- and down-regulated miRNAs, respectively. Empty dots correspond to pre-miRNAs and filled dots to mature miRNAs.
Intensity of fluorescence of 429-3p (B), 7-5p (C), 1-5p (D), 138-1-3p (E), miR-486-5p (F) and miR-4455-5p (G) from the Affymetrix chips for non-MG adults (controls, n=6) and MG patients (n=12). RT-PCR data for miR-429-3p (H), miR-7-5p (I), miR-1-5p (J) , miR-138-1-3p (K), miR-486-5p (L) and miR-4455-5p (M) in MG thymuses (n=12) compared to non-MG controls (N=6). miRNA expression level are given in arbitrary units and were normalized to 28S expression. P-values were assessed by the Mann-Whitney test and only p-values < 0.05 are indicated (*p<0.05, ** p<0.01).
Figure 2: Down-regulation of miR-7-5p in the thymus of MG patients
(A) PCR analyses for miR-7-5p expression in the thymus of non-MG adults (n=6), of ML patients (MG patients displaying low degree thymic hyperplasia (with 2 or fewer GCs per section, n=6)), MH patients (MG patients displaying high degree thymic hyperplasia (with 3 or more GCs per section, n=6)) and of MG patients under cortico-therapy (n=8). RT-PCR analyses for
miR-7-1-27 3p (B) and miR-7-2-3p (C) expression in the thymus of non-MG adults (n=6) and MG patients (n=12). (D) PCR analyses for miR-7-5p expression in medullary TECs from non-MG adults (n=11) and MG patients (n=13) after 7 days in culture. (E) PCR analyses for miR-7-5p expression in freshly extracted thymic cells from non-MG controls (n=5) and MG patients (n=14). miRNA expression levels were given in arbitrary units and were normalized to 28S. P-values were assessed by the Mann-Whitney test and only p-values < 0.05 are indicated (*p<0.05, **p<0.01). (F) List of genes dysregulated in the thymus of MG patients and targeted by miR-7-5p according to prediction databases. (1) Abbreviations : CCL21: C-C motif chemokine ligand 21; CXCL12/13: C-X-C motif chemokine ligand 12/13; EGFR: epithelial growth factor receptor; IFNAR1/2: interferon alpha and beta receptor subunit 1/2; IGF1R: insulin-like growth factor 1 receptor; IRF8: interferon regulatory factor 8; MyD88: myeloid differentiation primary response 88; PTPN22: protein tyrosine phosphatase non-receptor type 22; TLR4: toll-like receptor 4. (2) (http://www.targetscan.org/vert_71) (3) (http://www.microrna.org) (4) (http://diana.imis.athena-innovation.gr/DianaTools/index.php?r=microT_CDS/index). (G) Scheme for miR-7 targeted genes involved in MG and associated function. (H) Correlation between CCL21 mRNA and miR-7-5p expression in the thymus of non-MG controls (n=6) and MG patients (n=12). Pearson’s correlation was assessed and p-value under 0.05 indicated. (I) Representative experiment of miR-7-5p level in TECs transfected with miR-7-5p (+) or with a scramble RNA (-) for 48h. miR-7-5p expression was normalized on 28S expression. (J) CCL21 protein expression in experiments with TECs from three different donors. TECs were transfected either with miR-7-5p (+) or scramble RNA (-) for 48h and CCL21 protein level was assessed by ELISA in the medium of TEC cultures. Error bars correspond to the measures made on three different wells.
28
Figure 3: Inverse correlation for miRNA and mRNA expression data
Inversely correlated miRNA-mRNA interactions were analyzed with MAGIA2. Networks of miRNAs (orange triangles), mRNAs for transcription factors (green circles) and mRNAs for other genes (blue circles) were built using the prediction databases Targetscan (A) or DIANA micro-T (B). The miRNAs and their targets are listed in table 3. RT-PCR data for miR-125a-5p (C), WDR1 mRNA (D) in the thymus of controls (n=6) and MG patients (n=12). mRNA and miRNA expression levels were given in arbitrary units and were normalized to 28S. P-values were assessed by the Mann-Whitney test and only p-values < 0.05 are indicated (*p<0.05). (E) Inverse correlation for miR-125a-5p and WDR1 mRNA expression in the thymus of controls (n=6) and MG patients (n=12). Pearson’s correlation was assessed and p-values under 0.05 are indicated.
Figure 4. Expression of miRNAs and FMR1 mRNA located ion the same region of the X chromosome
(A) The bar chart indicates the expected frequency of miRNAs on each chromosome compared to the observed frequency extracted from the list of significantly overexpressed (in red) or down-regulated (in green) mature miRNAs listed in table 2A. If the p-value for the calculated Chi-square test was < 0.05 (*), the hypothesis was rejected, meaning that the proportion of dysregulated miRNAs on a given chromosome is significantly higher than expected.
Intensity of fluorescence of miR-20b-3p* (B) and miR-892b-3p (C) from the Affymetrix chips for non-MG adults (controls, n=6) and MG patients (n=12). RT-PCR data for miR-20b-3p* (D), miR-892b-3p (E) and FMR1 mRNA (F) expression in the thymus of controls (n=6) and MG patients (n=11). mRNA expression levels were given in arbitrary units and were normalized to 28S expression. Representative experiment of FMR1 (G) and miR-892b-3p (H) expression in
29 TECs treated with 5-Azacytidine (5µM) for 48h. mRNA and miRNA expression levels were given in arbitrary units and were normalized to GAPDH. P-values were assessed by the Mann-Whitney test and only p-values < 0.05 are indicated (*p<0.05, **p<0.01).
Table 1
(1) Degree of thymic hyperplasia: low hyperplasia (with 2 or fewer GCs per section) or high hyperplasia (with 3 or more GCs per section). (2) Interval in months between the onset of MG and thymectomy. (3) Myasthenia Gravis Foundation of America (MGFA) clinical classification. (4) Patients with corticoid treatment were only used for RT-PCR in Figure 4B. NS: not specified.
Patient
ID Gender Age (years)
Degree of thymic hyperplasia (1) Interval onset - Thymectomy (2) MGFA score at thymectomy (3) Corticoid treatment (4) Cholinesterase inhibitors Anti-AChR titer (nmol/L) miRnome PCR on thymic extracts PCR on thymocytes PCR on TECs
MG1 F 15 Low 13 III b No Yes 3.45 X
MG2 F 23 Low 7 II a No Yes 2118.7 X X X MG3 F 29 Low 7 I a No NS 83.7 X X MG4 F 35 Low 24 IV a No Yes 11.1 X MG5 F 20 Low 6 II a No Yes >100 X X MG6 F 32 Low 6 II b No Yes 17.3 X X MG7 F 29 Low 7 I a No NS 83.7 X MG8 F 19 Low 9 II a No Yes 21.3 X MG9 F 30 High 2 IV a No NS >100 X X MG10 F 30 High 14 I No NS 3180.2 X X MG11 F 25 High 3 II a No Yes 3.21 X X MG12 F 28 High 4 II a No Yes 60.38 X X
MG13 F 28 High 36 III a No Yes 9.7 X X
MG14 F 22 High 2 III a No Yes 264 X X
MG15 F 19 Low 18 III a Yes Yes 0.5 X
MG16 F 33 Low 30 II b Yes Yes 4.33 X
MG17 F 37 Low 6 III a Yes Yes 3.46 X
MG18 F 23 Low 18 II b Yes Yes NS X
MG19 F 26 Low 24 II b Yes Yes 4.4 X
MG20 F 32 Low 9 III a Yes Yes 9.6 X
MG21 F 38 Low 60 II b Yes Yes 21.4 X
MG22 F 31 Low 30 II a Yes Yes NS X
MG23 F 16 Low 24 III No Yes 52.8 X
MG24 F 16 High 12 II b No Yes NS X MG25 F 41 High 12 II a No Yes 3.3 X MG26 F 24 High 24 II b No Yes 10.2 X MG27 F 23 Low 4 II b No Yes 20.2 X MG28 F 17 Low 7 II a No Yes 4.1 X MG29 F 26 Low 8 II b No Yes 9.6 X MG30 F 25 High 24 II b No Yes 23.4 X MG31 F 24 High 7 II a No Yes 9.4 X
MG32 F 20 High 4 III No Yes 3.4 X
MG33 F 20 High 6 II b No Yes 11 X MG34 F 16 Low 12 II b No Yes 10.3 X MG35 F 12 High 17 IV a No Yes >100 X MG36 F 18 Low 36 IV b No Yes 206.6 X MG37 F 23 Low 2 II a No Yes >100 X MG38 F 34 High 90 NS No Yes 43 X
MG39 F 42 Low 48 III b No Yes 0.38 X
MG40 F 26 High 48 II a No Yes 851.9 X MG41 M 20 Low 28 II a No Yes 87.6 X MG42 M 24 Low 84 II b No Yes 35.3 X MG43 F 12 Low 28 NS No Yes >100 X MG44 F 31 NS 24 NS No Yes NS X MG45 F 37 Low NS NS No Yes NS X
Table 2A Name Accession MG bi-weight avg Signal (log2) Control bi-weight avg Signal (log2) MG/Control
FC (linear) p-value ANOVA Chromosome Cytogenetic band
hsa-miR-4455-5p MIMAT0018977 5.44 3.37 4.20 0.0137 4 4q35.1 hsa-miR-138-1-star MIMAT0004607 5.28 3.59 3.22 0.0082 3 3p21.32 hsa-miR-486-5p MIMAT0002177 11.56 9.89 3.18 0.0087 8 8p11.21 hsa-miR-4793-3p MIMAT0019966 5.66 4.02 3.11 0.0451 3 3p21.31 hsa-miR-548w MIMAT0015060 4.48 2.87 3.05 0.0363 16 16p12.1 hsa-miR-4495 MIMAT0019030 3.56 2.00 2.95 0.0286 12 12q23.1 hsa-miR-297 MIMAT0004450 5.63 4.19 2.72 0.0346 4 4q25 hsa-miR-486-3p MIMAT0004762 6.43 4.99 2.72 0.0419 8 8p11.21 hsa-miR-4529-3p MIMAT0019068 5.24 3.83 2.65 0.0088 18 18q21.2 hsa-miR-595 MIMAT0003263 4.40 3.03 2.58 0.0394 7 7q36.3 hsa-miR-548c-5p MIMAT0004806 3.09 1.78 2.48 0.0270 12 12q14.2 hsa-miR-4710 MIMAT0019815 6.55 5.92 1.55 0.0086 14 14q32.33 hsa-miR-574-3p MIMAT0003239 11.15 10.05 2.15 0.0010 4 4p14 hsa-miR-3148 MIMAT0015021 4.04 3.01 2.04 0.0302 8 8p12 hsa-miR-4485 MIMAT0019019 9.15 8.14 2.01 0.0436 11 11p15.4 hsa-miR-31 MIMAT0000089 10.75 9.81 1.91 0.0297 9 9p21.3 hsa-miR-4539 MIMAT0019082 7.68 6.89 1.72 0.0118 14 14q32.33 hsa-miR-3177-3p MIMAT0015054 5.24 4.47 1.71 0.0397 16 16p13.3 hsa-miR-502-3p MIMAT0004775 9.76 9.01 1.67 0.0451 X Xp11.23 hsa-miR-612 MIMAT0003280 3.82 3.11 1.64 0.0277 11 11q13.1 hsa-miR-668 MIMAT0003881 3.92 3.21 1.64 0.0425 14 14q32.31 hsa-miR-2278 MIMAT0011778 3.98 3.32 1.58 0.0451 9 9q22.32 hsa-miR-760 MIMAT0004957 4.72 4.08 1.56 0.0318 1 9q22.32 hsa-miR-4538 MIMAT0019081 6.24 5.12 2.16 0.0114 14 14q32.33 hsa-miR-744-star MIMAT0004946 2.09 2.67 -1.50 0.0301 17 17p12 hsa-miR-181d MIMAT0002821 9.12 9.71 -1.50 0.0198 19 19p13.13 hsa-miR-1273e MIMAT0018079 3.65 4.24 -1.51 0.0067 17 17q23.3 hsa-miR-3065-5p MIMAT0015066 1.82 2.41 -1.51 0.0197 17 17q25.3 hsa-miR-642b MIMAT0018444 6.12 6.71 -1.51 0.0113 19 19q13.32 hsa-miR-551a MIMAT0003214 2.10 2.72 -1.54 0.0168 1 1p36.32 hsa-let-7g MIMAT0000414 11.47 12.11 -1.56 0.0460 3 3p21.1 hsa-miR-337-5p MIMAT0004695 5.90 6.55 -1.57 0.0452 14 14q32.2 hsa-miR-101-star MIMAT0004513 2.98 3.64 -1.58 0.0364 1 1p31.3 hsa-miR-376a MIMAT0000729 2.03 2.71 -1.61 0.0233 14 14q32.31 hsa-miR-4510 MIMAT0019047 4.53 5.24 -1.63 0.0110 15 15q14 hsa-miR-4721 MIMAT0019835 6.71 7.43 -1.65 0.0105 16 16p11.2 hsa-miR-378d MIMAT0018926 7.14 7.87 -1.67 0.0328 4/8 4p16.2/8q22.1 hsa-miR-487a MIMAT0002178 2.39 3.16 -1.71 0.0166 14 14q32.31 hsa-miR-98 MIMAT0000096 5.83 6.61 -1.72 0.0091 X Xp11.22 hsa-miR-363 MIMAT0000707 9.81 10.60 -1.73 0.0132 X Xq26.2
hsa-miR-218 MIMAT0000275 2.39 3.25 -1.81 0.0466 4/5 4p15.31/5q34 hsa-miR-20b-star MIMAT0004752 5.99 6.85 -1.81 0.0098 X Xq26.2 hsa-miR-421 MIMAT0003339 6.79 7.68 -1.85 0.0405 X Xq13.2 hsa-miR-1 MIMAT0000416 1.98 2.88 -1.86 0.0000 20/18 20q13.33/18q11.2 hsa-miR-148a MIMAT0000243 8.29 9.26 -1.95 0.0092 7 7p15.2 hsa-miR-4500 MIMAT0019036 2.21 3.19 -1.98 0.0114 13 13q31.2 hsa-miR-892b MIMAT0004918 2.83 3.82 -1.99 0.0073 X Xq27.3 hsa-miR-379 MIMAT0000733 6.86 7.93 -2.10 0.0479 14 14q32.31 hsa-miR-34b-star MIMAT0000685 3.66 4.84 -2.26 0.0357 11 11q23.1 hsa-miR-375 MIMAT0000728 6.54 7.73 -2.27 0.0448 2 2q35 hsa-miR-509-3p MIMAT0002881 2.10 3.28 -2.27 0.0079 X Xq27.3 hsa-let-7f MIMAT0000067 10.49 11.70 -2.32 0.0205 9/X 9q22.32/Xp11.22 hsa-miR-720 MIMAT0005954 7.21 8.44 -2.34 0.0186 3 3q26.1 hsa-miR-133b MIMAT0000770 2.61 3.95 -2.52 0.0483 6 6p12.2 hsa-miR-196b MIMAT0001080 6.87 8.23 -2.57 0.0023 7 7p15.2 hsa-miR-890 MIMAT0004912 3.03 4.44 -2.66 0.0195 X Xq27.3 hsa-miR-454 MIMAT0003885 5.00 6.44 -2.70 0.0334 17 17q22 hsa-miR-30e-star MIMAT0000693 5.64 7.13 -2.80 0.0145 1 1p34.2 hsa-miR-103b MIMAT0007402 2.43 3.97 -2.91 0.0204 5/20 5q34/20p13 hsa-miR-19b-1-star MIMAT0004491 2.20 3.81 -3.05 0.0111 13 13q31.3 hsa-miR-7 MIMAT0000252 2.96 4.62 -3.16 0.0007 9/15/19 9q21.32/15q26.1/19p13.3 hsa-miR-429 MIMAT0001536 3.59 5.34 -3.37 0.0305 1 1p36.33 Table 2B Name Accession MG bi-weight avg Signal (log2) Control bi-weight avg Signal (log2) MG/Control
FC (linear) p-value ANOVA Chromosome Cytogenetic band
hp-hsa-mir-1915 MI0008336 4.86 4.00 1.81 0.0304 10 10p12.31 hp-hsa-mir-339 MI0000815 5.06 4.23 1.78 0.0346 7 7p22.3 hp-hsa-mir-4539-star MI0016910 6.14 5.46 1.60 0.0061 14 14q32.33 hp-hsa-mir-4638 MI0017265 2.97 2.21 1.70 0.0486 5 5q35.3 hp-hsa-mir-4730 MI0017367 4.69 3.92 1.70 0.0417 17 17q25.3 hp-hsa-mir-4776-2 MI0017420 3.96 3.22 1.67 0.0035 2 2q34 hp-hsa-mir-4539 MI0016910 5.18 4.57 1.53 0.0153 14 14q32.33 hp-hsa-mir-4516 MI0016882 3.23 2.59 1.56 0.0160 16 16p13.3 hp-hsa-mir-548w MI0014222 2.42 1.79 1.54 0.0028 16 16p12.1 hp-hsa-mir-4538 MI0016909 5.45 4.67 1.72 0.0283 14 14q32.33 hp-hsa-mir-30e-star MI0000749 2.79 3.39 -1.52 0.0173 1 1p34.2 hp-hsa-mir-363 MI0000764 4.20 4.83 -1.55 0.0047 X Xq26.2 hp-hsa-mir-320e MI0014234 3.41 4.16 -1.69 0.0223 19 19q13.32
Table 3. Dysregulated miRNAs and their targets, according to TargetScan and DIANA-microT.
MAGIA2 used the TargetScan and DIANA micro-T databases to associate dysregulated genes in MG thymus and putative miRNA targets. Dysregulated miRNAs were extracted from TAC analysis whereas dysregulated genes in the thymus were extracted from a previous transcriptomic study as fully detailed in the method section.
Name FC
(MG/Control) p-value TargetScan
DIANA
MicroT Targets in dysregulated gene in the MG thymus (EnterGene ID)
hsa-miR-486-5p 3.18 0.009 X DIDO1, DST, GSN, MKRN1, PPP2R5D, STT3B
hsa-miR-574-3p 2.15 0.001 X DIDO1, DNM1
hsa-miR-612-5p 1.64 0.028 X ATP6V1D, DIDO1, DST, FAM155B, GPANK1, HPCAL1, LTN1, PFDN1, TCL1A, TRIM29
hsa-miR-760-3p 1.56 0.032 X CNOT4, CTSG, EPB41L3, FAM155B, HLA-DQB1, GSN, IGF2R, KRT8, LMNB2, TTN
hsa-miR-125a-5p 1.45 0.016 X X CARS2, DIDO1, DST, DUST7, ENTPD4, FAM155B, HDGF, MCL1, RAB2B, RFX5, SMARCD2, WDR1
hsa-miR-4465-3p -1.19 0.050 X ALDH5A1, ERP44
hsa-miR-875-3p -1.22 0.039 X DIDO1, DST, EDNRA, HBS1L, HDGF, HPCAL1, LOM7, RAB2B, TTN, ZMYM4 hsa-miR-767-3p -1.36 0.004 X ANGEL1, ALDH5A1, DST, MAPKAPK3, MYD88, NCKAP1L, PFDN1, SPG7, SPOP, TTN hsa-miR-891b-5p -1.49 0.006 X AUTS2, CD1C, DST, HBS1L, HNRNPC, NSF, PPP1CC, SPG7, TAF11, ZFY
hsa-miR-551a-3p -1.54 0.017 X HSF1, LMO7, TAPBP,
hsa-miR-421-3p -1.85 0.041 X DST, EPB41L3, HBS1L, HPCAL1, IDH1, MAPKAPK3, RAB2B, SPG7, TAF15, ZMYM4 hsa-miR-1-3p -1.86 0.000 X X C16orf62, FOSB, FAM155B, MKRN1, MS4A1, NSF, PFDN1, SDCBP, UTRN, WDR1, ZNF292 hsa-miR-34c-5p -1.91 0.050 X X ANKRD12, BCL6 , EPB41L3, FAM155B, HBS1L, IDH1, LMAN1, PPP2R5D, TRIM29, ZMYM4 hsa-miR-4500-3p -1.98 0.011 X ANKRD12, ATP2B4, CCL3, DUSP7, DZIP1, FASLG, KLF9, LTN1, PLEKHO1, UTRN
hsa-miR-892a-3p -1.99 0.007 X ALDH5A1, ANKRD12, DIDO1, DST, HDGF, KLF9, LAMC1, PEBP1
hsa-miR-375-3p -2.27 0.045 X B4GALT5, DST, EBP41L2, EIF4H, LAMC1, MAN1A2, SCN3A, SPOP, ZFP36L2
hsa-miR-509-3p -2.27 0.008 X DST, ERP44, RFX5
hsa-miR-890-5p -2.66 0.020 X BTG1, DIDO1, DST, DZIP1, EPB41L2, EPB41L3, HDGF, MAN1A2, UTRN, ZMYND11
hsa-miR-429-3p -3.37 0.031 X X DIDO1, DNAJB5, DST, DZIPP1, IDH1, IGF2R, LAMC1, LMO7, LTN1, MKRN1, MTMR14, NPC1, SSR3, ZNF292