HAL Id: inserm-02877129
https://www.hal.inserm.fr/inserm-02877129
Submitted on 22 Jun 2020
HAL is a multi-disciplinary open access
archive for the deposit and dissemination of sci-entific research documents, whether they are pub-lished or not. The documents may come from teaching and research institutions in France or abroad, or from public or private research centers.
L’archive ouverte pluridisciplinaire HAL, est destinée au dépôt et à la diffusion de documents scientifiques de niveau recherche, publiés ou non, émanant des établissements d’enseignement et de recherche français ou étrangers, des laboratoires publics ou privés.
diversity and distribution of Saccharomyces eubayanus
lineages
Roberto Nespolo, Carlos Villarroel, Christian Oporto, Sebastián Tapia,
Franco Vega-Macaya, Kamila Urbina, Matteo de Chiara, Simone Mozzachiodi,
Ekaterina Mikhalev, Dawn Thompson, et al.
To cite this version:
Roberto Nespolo, Carlos Villarroel, Christian Oporto, Sebastián Tapia, Franco Vega-Macaya, et al.. An Out-of-Patagonia migration explains the worldwide diversity and distribution of Saccharomyces eu-bayanus lineages. PLoS Genetics, Public Library of Science, 2020, 16 (5), pp.e1008777. �10.1371/jour-nal.pgen.1008777�. �inserm-02877129�
RESEARCH ARTICLE
An Out-of-Patagonia migration explains the
worldwide diversity and distribution of
Saccharomyces eubayanus lineages
Roberto F. NespoloID1,2,3☯, Carlos A. VillarroelID2,4☯, Christian I. OportoID2,4, Sebastia´n
M. TapiaID2, Franco Vega-MacayaID2,4, Kamila UrbinaID2,4, Matteo De ChiaraID5,
Simone MozzachiodiID5, Ekaterina Mikhalev6, Dawn Thompson6, Luis F. LarrondoID2,7,
Pablo Saenz-AgudeloID1, Gianni LitiID5, Francisco A. CubillosID2,4*
1 Instituto de Ciencias Ambientales y Evolutivas, Universidad Austral de Chile, Valdivia, Chile, 2 Millennium
Institute for Integrative Biology (iBio), Santiago, Chile, 3 Center of Applied Ecology and Sustainability (CAPES), Santiago, Chile, 4 Universidad de Santiago de Chile, Facultad de Quı´mica y Biologı´a, Departamento de Biologı´a, Santiago, Chile, 5 Universite´ Coˆte d’Azur, CNRS, INSERM, IRCAN, Nice, France, 6 Ginkgo Bioworks, Boston, Massachusetts, United States of America, 7 Departamento Gene´tica Molecular y Microbiologı´a, Facultad de Ciencias Biolo´gicas, Pontificia Universidad Cato´lica de Chile, Santiago, Chile
☯These authors contributed equally to this work.
*francisco.cubillos.r@usach.cl
Abstract
Population-level sampling and whole-genome sequences of different individuals allow one to identify signatures of hybridization, gene flow and potential molecular mechanisms of environmental responses. Here, we report the isolation of 160 Saccharomyces eubayanus strains, the cryotolerant ancestor of lager yeast, from ten sampling sites in Patagonia along 2,000 km of Nothofagus forests. Frequency of S. eubayanus isolates was higher towards southern and colder regions, demonstrating the cryotolerant nature of the species. We sequenced the genome of 82 strains and, together with 23 available genomes, performed a comprehensive phylogenetic analysis. Our results revealed the presence of five different lin-eages together with dozens of admixed strains. Various analytical methods reveal evidence of gene flow and historical admixture between lineages from Patagonia and Holarctic regions, suggesting the co-occurrence of these ancestral populations. Analysis of the genetic contribution to the admixed genomes revealed a Patagonian genetic origin of the admixed strains, even for those located in the North Hemisphere. Overall, the Patagonian lineages, particularly the southern populations, showed a greater global genetic diversity compared to Holarctic and Chinese lineages, in agreement with a higher abundance in Pata-gonia. Thus, our results are consistent with a likely colonization of the species from periph-eral glacial refugia from South Patagonia. Furthermore, fermentative capacity and maltose consumption resulted negatively correlated with latitude, indicating better fermentative per-formance in northern populations. Our genome analysis, together with previous reports in the sister species S. uvarum suggests that a S. eubayanus ancestor was adapted to the harsh environmental conditions of Patagonia, a region that provides the ecological condi-tions for the diversification of these ancestral lineages.
a1111111111 a1111111111 a1111111111 a1111111111 a1111111111 OPEN ACCESS
Citation: Nespolo RF, Villarroel CA, Oporto CI,
Tapia SM, Vega-Macaya F, Urbina K, et al. (2020) An Out-of-Patagonia migration explains the worldwide diversity and distribution of
Saccharomyces eubayanus lineages. PLoS Genet
16(5): e1008777.https://doi.org/10.1371/journal. pgen.1008777
Editor: Christian R. Landry, University of Laval,
CANADA
Received: February 19, 2020 Accepted: April 14, 2020 Published: May 1, 2020
Copyright:© 2020 Nespolo et al. This is an open access article distributed under the terms of the
Creative Commons Attribution License, which permits unrestricted use, distribution, and reproduction in any medium, provided the original author and source are credited.
Data Availability Statement: The sequencing data
generated in this study was submitted to the NCBI BioProject database (http://www.ncbi.nlm.nih.gov/ bioproject/) under accession number
PRJNA540832. Supplementary material is also available in the following website:https://github. com/ibioChile/CubillosLab, including fasta files containing the accessory genes and Region A contigs sequences.
Author summary
Lager yeast history has intrigued scientists for decades. The recent isolation ofS. eubaya-nus, the lager yeast ancestor, represents an unprecedented opportunity to extend our knowledge on yeast phylogeography and the origins of theS. pastorianus lager hybrid. However, the genetic, phenotypic and evolutionary history of this species remains poorly known. Our work demonstrates thatS. eubayanus isolates from Patagonia have the great-est genetic diversity, comprising the larggreat-est number of lineages within a single geographic region and experienced ancestral and recent admixture between lineages, likely suggesting co-occurrence in Patagonia. Importantly, some isolates exhibited significant phenotypic differences for traits such as high temperature and ethanol tolerance, together with fer-mentation performance, demonstrating their potential in the brewing industry for the generation of new styles of lager beers. Furthermore, our results support the idea of colo-nization from peripheral glacial refugia from the South, as responsible for the high genetic diversity observed in southern Chilean Patagonia. Our results allow hypothesizing a suc-cessful physiological adjustment of the species to the local conditions in Patagonia, explaining its wide distribution in the southern hemisphere.
Introduction
The identification of admixed and/or hybrid individuals in nature together with the geo-graphic distribution of ecologically relevant traits is crucial for the understanding of how new lineages diversify in a given climate/region/environment [1]. Unfortunately, studies addressing admixture in fungi are still uncommon. In this context, the utilization of population-level sam-pling and whole-genome sequences involving large sets of individuals allows studying genetic correlations by exploring patterns of genomic variation across lineages and identifying signa-tures of gene flow, revealing potential mechanisms of physiological adjustment to the environ-ment [2]. The monophyleticSaccharomyces genus is an ideal model to investigate genomic variation and admixture, since within the clade isolates occupy a broad range of environments. Currently, the clade is composed of eight species [3], including the partially domesticatedS. cerevisiae and other non-domesticated species, such as S. eubayanus [4]. Given the economic importance of this clade, as well as the wealth of genomic information that has been produced in the past decade, particularly for the model organismS. cerevisiae [5–10], natural populations ofSaccharomyces are excellent models for understanding genome evolution in the wild.
Having been the first sequenced eukaryote, studies inS. cerevisiae have gained great depth by the wealth of additional full genome data coming from diverse isolates, providing excep-tional new insights into the genomic processes that drive phenotypic traits and genome evolu-tion between isolates [5,6,11]. Since the recent possibility to rapidly and cost-effectively sequence full genomes, otherSaccharomyces genomes have been fully obtained [3]. Saccharo-myces species harbour different genetic distributions, population histories and unique pheno-typic properties [12]. Phylogenomics analyses inS. uvarum suggested that a Patagonian sub-population gave rise to the Holarctic sub-population through a recent bottleneck [13]. Similarly, recurrent hybridization events between lineages were reported inS. paradoxus, demonstrating how recurring hybridization events in nature contribute to genomic, phenotypic and poten-tially the species diversity [14]. In this context, admixture in yeast has been associated to tran-sient habitats, like fruits, where insects can carry live yeast spores and favour a wider
Funding: This research was supported to FC by
Comisio´n Nacional de Investigacio´n Cientı´fica y Tecnolo´gica CONICYT FONDECYT [1180161] and Millennium Institute for Integrative Biology (iBio). CV is supported by CONICYT FONDECYT [grant 3170404]. RN is supported by FIC ‘Transferencia Levaduras Nativas para Cerveza Artesanal’ and Fondecyt grant 1180917. KU was funded by USA1899 – Vridei 021943CR-PAP Universidad de Santiago de Chile. The funders had no role in study design, data collection and analysis, decision to publish, or preparation of the manuscript.
Competing interests: the authors have declared
geographic distribution and genetic admixture compared to less nutrient rich barks, where admixture could occur over longer periods [15,16].
In nature, severalSaccharomyces inter-species hybrids have been found. An example of this includes the workhorse of the modern brewing industry,S. pastorianus, a hybrid between S. cerevisiae and the cold-tolerant S. eubayanus [17,18]. Despite the industrial importance ofS. pastorianus, much of the natural history of this hybrid remains obscure, largely because the S. eubayanus parental species was only recently isolated [19].S. eubayanus was originally isolated fromNothofagus trees in the Argentinian Patagonia [19,20] and since then it has been isolated in New Zealand [21], North America [22,23] and East Asia [24]. However, the evolutionary origin ofS. eubayanus is still controversial. While this species has been isolated from South AmericanNothofagus trees recurrently [20] and only a handful of isolates have been recovered from trees in China and North America [24,25], a subset of the strains from China have been reported as the earliest diverging lineage, suggesting an Asian origin of the species [24]. How-ever, these findings have been challenged [20]. Molecular profiling indicates thatS. eubayanus is composed of three lineages, besides the early diverging lineage of West China. These popula-tions include a ‘Holarctic’ (HOL) cluster (a group of related strains from Tibet and North America) and two Patagonian populations denominated: ‘Patagonia A’ (PA) and ‘Patagonia B’ (PB) [25]. Whole genome sequence comparison among wildS. eubayanus strains indicates that, thus far, the Holarctic lineage is the closest relative of the lager yeast [20,25]. Interest-ingly, multi-locus sequence comparisons have indicated that the nucleotide diversity ofS. eubayanus Patagonian populations is higher than that of the West China and the Holarctic (North American) lineages. However, until now only a handful ofS. eubayanus genomes per population have been fully sequenced, which prevents depicting a detailed population geno-mics portrait of this species.
Here, we describe the isolation of 160S. eubayanus strains from bark samples obtained fromNothofagus trees in Chile (Fig 1) and we provide annotated genomes together with phe-notypic characterization for 82 selected strains. We investigated genetic structure, admixture and nucleotide diversity of this set of strains, while also re-analyzed 23 previously published genomes. Overall, we provide evidence of historical admixture events in Patagonia that signifi-cantly expands the formerly known genetic history of the species. Moreover, phenotypic clus-tering correlated well with genetic distances, where individuals from northern sites showed greater fermentation performance and high-temperature tolerance than isolates from southern sites. The genomic data presented here broadens our knowledge of the genetics, ecology, and evolution of wild yeast strains.
Results
S. eubayanus isolation and whole genome sequencing
In order to determine the distribution ofS. eubayanus along the south western side of the Andes Mountains, we sampled ten Chilean national parks and reserves between 2017 and 2018, spanning 2,090 km from Altos de Lircay National Park in central Chile (VII Maule Region, Chile) to Karukinka Natural Park in southern Chile (XII Magallanes Region, Chile) (Fig 1A). From these sites, we obtained 553 bark samples from trees belonging toN. pumilio, N. Antarctica, N. dombeyi and A. Araucana species. Raffinose and ethanol media enrichment [26] allowed us to recover yeast colonies in 77% of the samples. PotentialSaccharomyces strains were identified by sequencing the ITS and/orGSY1 and RPI1 RFLP [22,25]. From these, 160 S. eubayanus strains were identified from different individual trees (S1 Table, representing
28.9% of the samples), and in parallel, another set of 179S. uvarum isolates were recovered (representing 37.9% of the samples), together with dozens of non-Saccharomyces species
belonging to theLachancea, Kregervanrija, Kazachstania and Hanseniaspora genera. In gen-eral, we observed a pattern between yeasts and hosts, whereN. pumilio and N. antarctica con-tained mostlyS. eubayanus strains, while all but one isolate derived from N. dombeyi and A. araucana samples were identified as S. uvarum (S1 Table). The frequency of yeast isolates was higher towards southern regions, while a lower fraction of yeast colonies were obtained from Tierra del Fuego. FACS analysis revealed that all samples were diploids, except for CL609.1 and CL1005.1 which were found to be haploid and tetraploid, respectively (S1 Fig). Indeed, all strains were able to sporulate, with the exception of CL609.1. Overall, our results demonstrate the high frequency of theS. eubayanus species above latitude 33˚ in the western side of the Andes Mountains.
Population structure in
S. eubayanus
To investigate the genomic variation and population structure of theS. eubayanus isolates, we sequenced the genomes of 82 strains, randomly selected from the ten sampling sites. Further-more, we combined our dataset with all previously published genome from 23 strains from North America (9 strains), Argentina (10 strains) [25], China (1 strain) [24], New Zealand (1 strain) [21] and two lager genomes [18], allowing us to incorporate genomes obtained in other geographical regions (S2A TableandS2B Table). Overall, no strain isolated in this study rep-resents a close relative to the type strain (obtained from Argentina), suggesting that the Andes Mountains represents a natural barrier betweenS. eubayanus populations (S2B Table). On average, across the 82 genomes we obtained 39,024 SNPs per strain relative to the reference genome, and a SNP was found on average every ~300 bp. In parallel, we found on average 1,606 insertions and 1,677 deletions per isolate relative to the type strain (S2A Table). The phylogeny obtained suggests that Chilean strains displayed different ancestry and mostly fell into three major lineages: PB-1, PB-2 & PB-3 (Fig 2A). Furthermore, several strains fell outside the major PB lineages and might represent admixed strains (Fig 2A).
In order to study the genetic structure ofS. eubayanus, we used STRUCTURE, fineSTRUC-TURE clustering and principal component analysis (PCA). All analyses revealed a high degree of differentiation across the populations (Fig 2). STRUCTURE analysis indicated an optimum
k = 5 groups (ΔK5= 2,652,Fig 2B,S3 Table), whereas fineSTRUCTURE was able to depict
several subpopulations within the PB-1 lineage, and to a lower extent also in PB-3 and PB-2, respectively (S2 Fig), in agreement with our PCA analysis (Fig 2C). Moreover, three groups of strains showed a mixture of alleles inherited from multiple populations (SoAm 1–3), that together with the North American (NoAm), Holarctic and PA lineages shape the genetic struc-ture of S.eubayanus (Fig 2D and 2E).
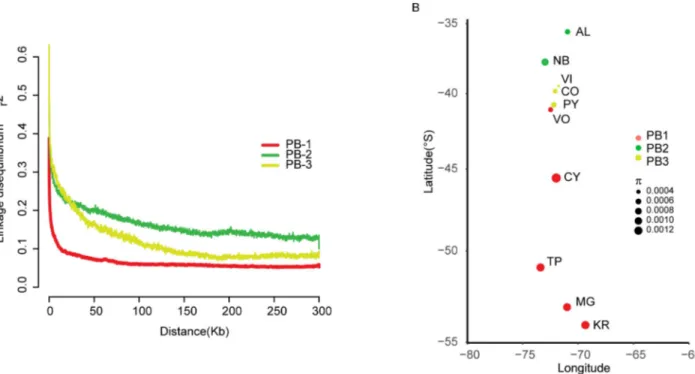
In order to detect evidence of recombination in the different lineages, we estimated linkage disequilibrium (LD) using only non-admixed strains. Estimates of LD based onr2values dif-fered between the three PB lineages (Fig 3A). Lineages showed a 50% LD decay of 2.9 kb, 29.1 kb and 22.5 kb in the PB-1, PB-2 and PB-3 populations, respectively, demonstrating a popula-tion-specific LD decay and greater LD levels in the PB-1 population. Moreover, the PB-1 level of recombination was similar to what is described in domesticatedS. cerevisiae populations [5,
7]. This could be explained by greater inbreeding or outbreeding rates in the lineage. Indeed, Fis values (Wright’s inbreeding coefficient) were significantly higher (p-value < 0.001, paired Fig 1. Geographic distribution and isolation frequency ofS. eubayanus strains. (A) Map of the world depicting the number of available S. eubayanus sequenced
genomes from around the world (white circles), together with the ten localities in Chile where the 82 strains sequenced in this study were isolated. Overall, a latitude range of 2,090 km was covered. Frequency of bark samples that yielded a (B) successful yeast isolation (full coloured) or no growth in YNB raffinose ethanol media (shaded colours), a (C)Saccharomyces (full coloured) or other non-Saccharomyces genera (shaded colours), and a (D) S. eubayanus (full coloured) or S. uvarum
(shaded colours) species.
Student t-test) in PB-1 (averageFis = 0.9482 CI = 0.9462–0.9503), compared to PB-2 and PB-3 (averageFis = 0.9017 (CI = 0.8974–0.906 & Fis = 0.8856 CI = 0.8795–0.8916, respectively) (S4A Table). Alternatively, lower LD levels for PB-2 and PB-3, could be due to the hidden pop-ulation substructure within these two lineages compared to PB-1, impacting the overall comparison.
Next, we calculated nucleotide diversity (π), genetic differentiation (FST), and neutrality test
statistics, such as Tajima’s D (S4A Table). In general, we observed a trend for higher genome-wide nucleotide diversity (π) in southern localities, and belonging to PB-1, compared to their northern counterparts belonging to PB-2 and PB-3 (Fig 3B). In this context, PB-3 isolates from Choshuenco and Villarrica, located further north had the lowest levels of genetic diver-sity. These results demonstrate a negative and significant (p-value = 0.047, Spearman correla-tion coefficient rs = 0.632) correlacorrela-tion between latitude and genetic diversity.
Tajima’s D scores differed between lineages. Specifically, Tajima’s D values for PB-2 & PB-3 were positive while this metric was near zero for PB-1, suggesting undetected population Fig 2. Phylogeny ofS. eubayanus. (A) Maximum likelihood tree depicting genetic relationships between 104 strains using 606,656 biallelic SNPs
(substitution model GTR+F+ASC) and manually rooted withS. uvarum as the outgroup. Green coloured branches indicate bootstrap support values greater
than 90%. Three PB lineages: PB-1 (red), PB-2 (green) and PB-3(yellow) and a single PA lineage (blue) were identified, together with admixed strains between the different lineages. Branch lengths correspond to genetic distance. Tree scale is substitutions per site. (B) Maximum likelihood tree of 104 strains together with the Bayesian clustering output generated with STRUCTURE. An optimum k = 5 groups is shown. The geographic origin of each strain is depicted as follows: Canada (CA), United States (UN), China (CN), Lager (LG), AR (Argentina), New Zeland (NZ), AL (Altos de Lircay), NB (Nahuelbuta), Villarrica (VI), Choshuenco (CO), Puyehue (PY), Osorno Volcano (VO), Coyhaique (CY), Torres del Paine (TP), Magallanes (MG) and Karukinka (KR).(C) Plot of the distribution of the genomic variation in 83 non-admixed strains based on the first two components, third and fourth of a PCA analysis performed using 80,203 unlinked SNPs. Colour codes used are congruent with clusters presented in panel A. Each dot represents a single strain. Distribution across Chile (D) and the rest of the world (E) for Patagonian lineages and admixed lineages. Colour codes correspond to different genetic lineages obtained with Structure. Coloured circles in (D) and (E) are representative of pure lineages (single colour) and admixed strains (two or three coloured-circles). Numbers in circles correspond to the number of sequenced strains. In (E) Patagonian lineages from Chile and Argentina are included.
https://doi.org/10.1371/journal.pgen.1008777.g002
Fig 3. Linkage disequilibrium and genetic diversity across lineages. (A) Linkage disequilibrium decay over distance (kb) expressed in terms of
correlation coefficient, r2. LD decay for each window was estimated as the pairwise average for all SNPs pairs separated by no more than 100 kb. The PB-1 lineage shows the lowest LD values compared to any other population in our collection. (B) Nucleotide diversity (π) in localities across Chile. Colours represent the different PB lineages as indicated.
substructure in the former case and no population decline for the latter (S4A Table,S3A Fig). We then assessed the degree of genetic differentiation and nucleotide diversity between the ten sampling sites per lineage (S3B Fig). We found moderate to high significantFSTvalues ranging
from 0.16 to 0.88 (S4B Table). A mantel test showed a significant correlation between the geo-graphic and the genetic distances (isolation by distance,p-value < 0.05) among sampling sites of the PB-1 lineage. The number of pairwise comparisons was insufficient to test for IBD for lineages PB-2 and PB-3. The positive IBD for PB-1 indicates limited effective dispersal within this lineage (S3C Fig).
Historical recombination events suggest a Patagonian genetic origin of
admixed strains
To determine how recombination events influenced the genomes of the isolates showing recent genetic admixture and the level of genetic exchange between populations, we explored their genome compositions and genetic origins. First, we generated similarity plots using 100 SNPs blocks and determined the closest genetic origin for each of the three groups of admixed strains from each population. This initial assessment of admixture allowed us to determine that strains isolated from Karukinka (SoAm-3) likely originated from the same admixture event between PB-1 and PB-3 lineages, as 92% of their bins were assigned to the same lineage (Fig 4A). A com-mon origin is also predicted for the North American admixed strains (NoAm) as previously reported [22,23,25], where a PB-1 origin contributes to the genome of all isolates.
To infer the most likely parental subpopulations, genetic contribution to the admixed genomes and putative date of admixture, each admixed individual/subpopulation was analysed using GLOBETROTTER. In particular, GLOBETROTTER indicated that the admixed popula-tion of Karukinka (SoAm-3) also originated from an admixture event between PB1-Karukinka and PB3-Puyehue individuals, which contributed to 43% and 57% of the current genomes, respectively. Similarly, a pairwise nucleotide divergence (Dxy) analysis largely resembled the results obtained using cluster analysis (Fig 4B). Finally, to verify recent admixture events between lineages, a TreeMix analysis recapitulated independent events between subpopula-tions while fitting 8 migration events, consistent with the admixture analysis previously per-formed and depicting hybridization involving in all cases the PB-1 lineage (Fig 4C).
Altogether, these results suggest recent outcrossing and admixture betweenS. eubayanus pop-ulations, where the PB-1 branch contributes to all the admixed genomes analysed in our study.
Evidence of ancestral gene flow and admixture events between lineages
To identify population founders and historical hybridization events we applied explicit tests of admixture using TreeMix and f4-statistics together with admixture models using admixture-graph. In this analysis, none of the strains coming from recent admixture events were consid-ered, and only strains belonging to the different lineages were used. The TreeMix topology without migrations (S4A FigandS4B Fig) resembles our phylogenetic tree and explained 99.61% of the variance of the data. Adding, one, to six migration events increased the variance explained by the model from 99.88% to 99.97%, respectively. An Ad hoc analysis of the second order rate of change in the log-likelihood as migration events were added indicated two or four migration edges as the most likely models (S5B Table). The model that included four migration events, indicated gene flow between PB-1 –HOL and PB-2 and HOL ancestral line-ages and the PA ancestor together with PB-2 (Fig 5A and 5B). Interestingly, gene flow between S. cerevisiae and the HOL lineage was found, suggesting additional signatures of ancestral hybridizations between both species, or a close sister species toS. cerevisiae (S4C Fig and S4D Fig).
Next, we evaluated gene flow amongS. eubayanus populations by calculating f4 statistics. As Treemix results suggested gene flow betweenS. eubayanus populations with different Sac-charomyces sp, we did not use S. uvarum or S. cerevisae as outgroups. Instead, we calculated f4 statistics using onlyS. eubayanus populations and we tested whether f4 values agreed with S. eubayanus admixture models based on the phylogenetic tree topology, this is (PA,(HOL,(PB2, (PB1,PB3). We found a large discrepancy between calculated f4 values with the expected f4 val-ues of a non-admixture model, suggesting the presence of admixture events betweenS. eubayanus populations (Fig 5C and 5D).
Next, we incorporated the three admixture events suggested by Treemix which improved the fit to f4 values (Model 2,S4E Fig,S5C Table), yet by adding one additional admixture event (PB-1—PA) we obtained Model 3 which had the lowest minimal error (0.000045,Fig 5E Fig 4. Parental lineages in admixed genomes. (A) Genome-wide ancestry for admixed strains. Bins of 100 SNPs were assigned in the admixed strains to the
populations PB-1 (red), PB-2 (green), PB-3 (yellow) or PA (blue) based on sequence similarity. Chromosomes are indicated in the Y axis from I to XVI, while in the X-axis strains are depicted. Two colours in the same row (strain) suggest admixed genomes. (B) Pairwise divergence of Karukinka admixed (ADM-KAR) population and other Chilean admixed strains from parental lineages. Red, green, yellow, and light blue dots indicate sequence divergence of the admixed individual/population to their putative parental subpopulations predicted by GLOBETROTTER. For this analysis admixed genomes were divided into bins of 100 SNPs (C) Phylogenetic network inferred by Treemix in the admixed isolates evidencing recent hybridization events. Eight migration edges between populations were allowed and are shown with arrows indicating the direction toward the recipient group and coloured according to the ancestry percentage received from the donor. The scale bar shows ten times the average standard error of the entries in the sample covariance matrix.
and 5F). In Model 3 ancestral populations of PB-1 and PB-2 had independent events of admix-ture with both, PA and HOL ancestral populations. Alternative models that could explain gene flow of the Patagonia B populations to either PA or HOL using fewer admixture events did not show a better fit (S5D Table). Altogether, our results demonstrate extensive gene flow and admixture between lineages. Furthermore, the current lineages do not correspond to the out-come of recent admixture events between any of the other lineages, in agreement with migra-tion edges inferred by Treemix.
Pangenome and gene content variation
To compare the genome content, we generatedde novo assemblies and constructed the pan-genome across all isolates (S5E Table). We identified 5,497 non redundant pangenomic ORFs in the species. Out of these, 5,233 ORFs are core systematically present in all of the isolates, while 264 are dispensable (S5F Table), being only found in subsets of strains. A PCA analysis of the presence/absence profile of core genes was used to visualize potential overlap between genome content similarities and SNPs distance (S5A Fig). In partial concordance with the phylogenetic tree, the branch harbouring the Chinese isolate, which also contained two North American isolates, represented the most divergent lineage, suggesting a recent migration event between Asia and America.
Overall, we were able to identify nine ORFs present in a group of nine closely related iso-lates belonging to the PB-2 lineage, representing a candidate lateral gene transfer (LGT) event from other specie(s). Interestingly, six of the strains were isolated from the same location, and these genes were assembled within a region of 7.3 kb on a single contig for each of the six iso-lates (S. eubayanus Region A,S5B Fig). The sequences of these contigs could not be found in the NCBI non-redundant database, with the exception of a 7 kb region, upstream to the group of ORFs, which matches the subtelomeric end of chromosome I. Without a match in another species, we were not able to confidently assign these genes to an LGT event. However, their subtelomeric localisation, together with their assembly on a single continuous region in a sub-set of isolates represent hallmarks of LGT identified in otherSaccharomyces species [5,27]. Subsequently, SMART (Simple Modular Architecture Research Tool) was used to identify known PFAM protein domains in these regions. We found several putative proteins, with domains such as: arginase domain, a membrane transport protein domain, a Fungal specific transcription factor domain, a Gal4-like dimerization domain and a transmembrane one (S5C FigandS5G Table). In addition to these high-confidence hits, SMART identified the potential presence of a glucosidase domain and a homing endonuclease domain in four and two ORFs, respectively (S5C FigandS5G Table).
Furthermore, we also identified 64 private ORFs in the Chinese/North American group of strains, where at least 27 (S5H Table) correspond to orthologs of other genes found in the lagerS. eubayanus genome (showing an average sequence divergence of 12.4%). These features closely resemble those introgressions found fromS. paradoxus into specific S. cerevisiae line-ages [5]. However, no potential donor species was found and hence we cannot completely rule out different evolutionary origins, such incomplete lineage sorting and/or balancing selection.
Fig 5. Admixture between ancestralS. eubayanus populations. (A) B) The residual matrix from the tree in A. (C) and (E)
Admixture graphs of Model 1 (no admixture) and Model 3. Continuous lines indicate direct ancestry; numbers at these lines denote scaled drift (f2-statistic). Dotted lines indicate admixture; numbers at these edges show the percentage of ancestry contribution. (D) and (F) Goodness-of-fit of the graphs in C and E. Green and red dots indicate f4 values expected from the model. Red colour indicates deviance of the expected f4 value from the calculated f4 value (+/- stderr).
Phenotypic diversity and fermentation capacity among
S. eubayanus
isolates
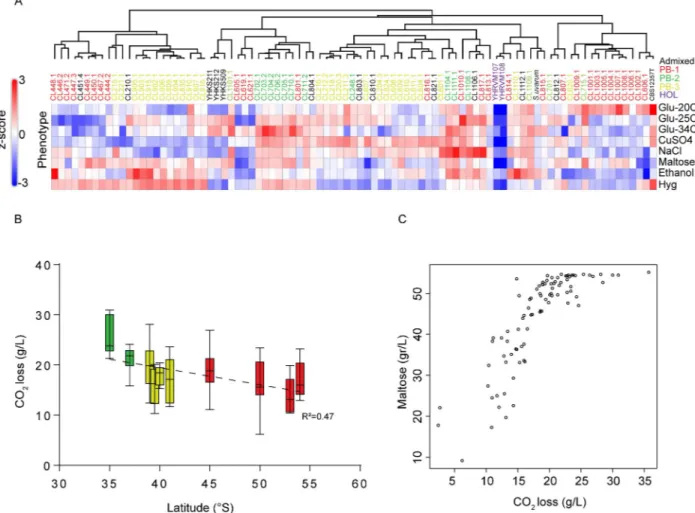
S. eubayanus phenotypic diversity was assessed in a set of 89 isolates from North America (N = 5), and South America: Altos de Lircay (N = 9), Nahuelbuta (N = 10), Villarrica (N = 10), Choshuenco (N = 10), Puyehue (N = 6), Osorno Volcano (N = 6), Coyhaique (N = 9), Torres del Paine (N = 9), Magallanes (N = 5), Karukinka (N = 9), Argentina (N = 1) (Fig 1A,S6A Table). A clustered heat map of the phenotypic correlations between yeast isolates across all traits forμmax (corresponding to the maximum specific growth rateS6B Table,Fig 6A) showed that North American Holarctic strains clustered separately with lowμmax and maxOD scores (maximum OD growth recorded) across traits, while the CBS12357Tstrain clustered together with PB-1 strains from Torres del Paine. This clustering was further sup-ported by the principal component analysis, both of which produced the main groups split by localities, rather than lineages, where only PB-2 isolates grouped together (S6 Fig). Specifically, only for certain phenotypes did we find differences among localities (S6C Table).
Subsequently, given the importance ofS. eubayanus in lager brewing, we then evaluated the fermentation performance of the same set of strains previously phenotyped and used theS. pastorianus W34/70 control strain from lager as positive fermentation control. The conditions included 12˚P wort at 12˚C in 50 mL (micro-fermentations batches) and CO2loss was
recorded every day and metabolite consumption was estimated at the end of the fermentation process. In all cases, the lager control showed better fermentation performance compared to allS. eubayanus isolates (q-value < 0.05,S7A Table), yet several strains showed high CO2
release levels, demonstrating the beer fermentation potential of some strains. Overall, we observed that isolates obtained at lower latitudes (Central region) released significantly greater CO2levels than individuals obtained at higher latitudes (extreme South,S7B Table, Pearson
r = 0.566,p-value < 0.001,Fig 6B). Furthermore, we found that fermentation performance was directly correlated with maltose sugar consumption (Pearson r = 0.52,p-value < 6 x 10⁻⁸, S7C Table,Fig 6C), and ethanol production (Pearson r = 0.56,p-value < 2 x 10⁻⁶).
Discussion
Our results, and those of other authors (see [19,22]), strongly suggest thatS. eubayanus prefer-entially associates withNothofagus trees, particularly N. pumilio, the most cold-adapted mem-ber of this tree genus [28,29]. Under this scenario, the biogeographical history ofS. eubayanus should logically and strongly correlate with the history ofNothofagus dispersal across the globe. Interestingly, the isolation frequency ofS. eubayanus was correlated with latitude. PB-1 is located at higher latitudes (and lower altitudes) and the isolation frequency of this lineage was lower than that of the other two major lineages, PB-2 and PB-3, which were easily recov-ered from the environment and were specifically associated with high altitudeN. pumilio trees (Fig 1). The lower frequency of isolates found in samples from Tierra del Fuego could be due to the extreme environmental conditions found in this part of the continent, where average temperatures are below 5˚C throughout most of the year [30]. However, the widespread distri-bution and higher abundance ofN. pumilio in Tierra del Fuego compared to northern areas may facilitate the survival, range distribution, and habitat colonization ofS. eubayanus [31], thus increasing its population size and genetic diversity. The isolation frequency ofS. eubaya-nus in Patagonia was three times higher than that reported in China and North America, where a similar number of bark samples and sampling sites were surveyed [23–25]. Our results are also in agreement with those reported forS. eubayanus in Argentina, where high isolation rates inN. pumilio trees were also found [20]. The genusNothofagus originated during the late Cretaceous-Early Tertiary interchange (ca. 135 MYA); between Southeast Asia and Australia,
from a “fagalean” complex in Southeast Asia [28,32]. At the time, Antarctica was in a more northern position connecting South America, Tasmania, Australia and New Zealand, and had a warm-humid climate (”mesothermal conditions”, sensu [28]). Subsequently, a step-wise wave of dispersion-colonization ofNothofagus in a westward direction reached South Amer-ica. This scenario is consistent with a colonization of theS. eubayanus and S. uvarum ancestor across the South Hemisphere [23,32].
The phylogenomic analysis presented here of wildS. eubayanus (Fig 2) reveals a higher genetic diversity for the PB South American lineages than that reported forS. eubayanus in the Northern Hemisphere [23,25]. Indeed, our results resemble those obtained in the sister species forS. uvarum, where similar sequence divergence among S. uvarum populations was described [13], whereas in ChineseS. cerevisiae, a much higher genetic diversity is observed compared to other regions of the world [33]. Interestingly, based on the levels of genetic diversity and het-erozygosity, our results support the idea that PB-1S. eubayanus from Tierra del Fuego is the most represented population in Patagonia, and likely within the species (Fig 2D). This lineage shows high levels of hybridization/introgression into northern populations. The higher nucle-otide diversity of PB-1 was supported by a trend of greater genetic diversity among individuals Fig 6. Phenotypic diversity inS. eubayanus. (A) Heat map depicting the phenotypic diversity in S. eubayanus obtained from eight different
conditions assessed in microcultures. Strains are grouped by hierarchical clustering and names & colours indicate the lineage. The heat maps were elaborated based on z-scores within each phenotype. (B) CO2loss levels represent the fermentative capacity of wild isolates obtained from microfermentations. Error bars denote the standard deviation (C) Maltose consumption was directly correlated with CO2loss and latitude of the origin of the isolate.
sampled from Coyhaique, Torres del Paine, Magallanes and Karukinka sites (Fig 3B), where the dispersal ofN. pumilio is also greater than in more northern regions. However, since the three different lineages were geographically segregated, it is not possible to attribute increased genetic diversity exclusively to latitude or to the nature of PB-1, as all samples isolated at lati-tudes higher than 45˚S were consistently assigned to PB-1. Nevertheless, our dense sampling procedure, together with other findings, suggest that other lineages are not present in the extreme south, therefore, we cannot determine whether the observed increment of genetic diversity with latitude is a general pattern [20,23]. A subgroup of PB-1 isolates is found at lower latitudes, which means that PB-1, PB-2 and PB-3 are sympatric in northern regions. Fur-thermore, we found discrepancies between our genetic diversity estimates and previous reports [25], probably because only non-admixed isolates were used in our study, while previous data-sets have utilized admixed genomes, inflating the estimated genetic diversity.
This scenario is also consistent with the idea thatS. eubayanus cryotolerance evolved recently, asN. pumilio (its preferred environment) became secondarily adapted to cold during the orogenesis of the Andes [28,29]. Also, it is now accepted that the distribution of Nothofa-gus (and subsequently S. eubayanus) was already established in Patagonia before the onset of the last glacial maximum (ca 20,000 years ago), when ice sheets covered most landmasses south of 43º. After this glacial period, there was massive floristic recolonization and ecological succession [29,34]. Our results are consistent with this second scenario (colonization from peripheral glacial refugia from the South) since we found lower genetic diversity in popula-tions located in central Chile (Altos de Lircay & Nahuelbuta) compared to populapopula-tions found in southern Chile (Coyhaique, Torres del Paine, Magallanes and Karukinka). Interestingly, a different pattern is observed in the eastern side of the Andes (Argentina), where a lower num-ber of peripheral glacial refugia occurred and most of the diversity would originate from Val-leys refugia in northern sites [34]. Indeed, in Argentina there is greaterS. eubayanus genetic diversity north of 43˚, where different populations congregate in a single geographic location [23].
Our STRUCTURE analyses provide evidence of contact and admixture between PB-1 and the other two PB lineages (Fig 2B). Overall, all of the admixed strains from Chile, New Zealand and North America contained regions from the PB-1 lineage, that together with our popula-tion genetics analysis and admixture model between populapopula-tions, suggest that PB-1 could be the most widespread lineage reported to date, including admixture with the Holarctic lineage. Indeed, higherFis values are found in the PB-1 cluster, compared to PB-2 and PB-3, suggesting that meiosis and inbreeding are more frequent in PB-1. Our admixture analysis demonstrates recurrent hybridization between ancestral lineages, supporting a scenario in which gene flow among Patagonian and Holarctic ancestral populations took place, and that is consistent with the co-occurrence of these populations in the past (Fig 5). Similar evidence of admixture in other yeast species, such asS. cerevisiae, S. uvarum, and S. paradoxus was previously reported [13–15]. Interestingly, we also detected evidence of ancestral gene flow betweenS. cerevisiae (or a close sister species) and theS. eubayanus HOL lineage. This demonstrates a pervasive contact betweenSaccharomyces populations and constant admixture, likely facilitated by their dispersal by insect’s in nutrient-rich periods of the year [16].
In summary, our results provide compelling evidence of the successful colonization and distribution ofS. eubayanus in Patagonia, in the cold conditions of the southern hemisphere, representing most of the current extensive genetic diversity found in this species. The majority of theS. eubayanus strains collected around the world belong to the Patagonian cluster. This Out-of-Patagonia colonization has extended to the Northern Hemisphere, including a recently-found subset in China, and Oceania. Finally, our data concerningS. eubayanus, together with previous evidence inS. uvarum [13], leads us to propose that the ancestor of
both species adapted to the environmental conditions in the Southern Hemisphere. However, the currently available data is insufficient to draw further conclusions regarding this claim, warranting future studies and especially experimental evidence for inferring local adaptation (e.g., fitness and common garden experiments, see [35]).
Materials and methods
Sample areas and yeast isolation
Bark samples from ‘lenga’ (Nothofagus pumilio), coigu¨e (N.dombeyi) and ‘ñirre’ (N. Antarctica) andAraucaria araucana were obtained aseptically from ten sampling sites in Chile (collection date,Fig 1): Sampling was performed as previously described [36]. Isolated colonies were stored in glycerol 20% v/v and stored at -80˚C in the Molecular Genetics Laboratory yeast col-lection at Universidad de Santiago de Chile. Details on the localities and the yeast isolation procedures are available inS1 Text.
Saccharomyces eubayanus identification and FACS analysis
We amplified and sequenced the internal transcribed spacer region (ITS) to identify colonies to the genus level [37].Saccharomyces species identification was conducted using the polymor-phic markerGSY1 and RIP1 through amplification and enzyme restriction (see details in [22]). In many cases, species identification was confirmed by Sanger-sequencing of the ITS region, which was attained using a BLASTN against the Genbank database under 100% identity as threshold. DNA content was analysed as previously described [5].
Sequencing, Reads processing and Mapping
One isolate per tree was considered for DNA sequencing. DNA was obtained using a Qiagen Genomic-tip 20/G kit (Qiagen, Hilden, Germany). The library prep reaction used was a 100x miniaturized version of the Illumina Nextera method. Samples were sequenced on a NextSeq 500/550 High Output Kit v2.5 (300 Cycles) flow cell. Reads were processed with fastp 0.19.4 (-l 37–3) [38,39]. Reads were aligned against theSaccharomyces eubayanus CBS12357Treference genome [38] using BWA-mem [40].
Variant calling
Mapping files were tagged for duplicates using Picard tools 2.18.14 (http://broadinstitute. github.io/picard/). Variant calling and filtering was done with GATK version 4.0.10.1 [41]. For all datasets, we only considered SNPs that had no missing data using vcftools option–max-missing 1. Furthermore, prior to making a dataset without option–max-missing SNPs, for gene flow analy-ses we excluded individuals that had more than 5% of missing sites, which included the lager strains, admixed strain yHKS212, and PB strains from Argentina. The effect of each variant was assessed and annotated with SnpEff version 4.3t [42], using an updated version ofS. eubayanus gene annotations [38]
Phylogeny and population structure analyses
To perform phylogeny on our SNP dataset, a VCF file containing 606,656 bialllelic SNPs was converted to phylip format and used as input for IQ-TREE [43] to generate a maximum likeli-hood phylogeny with the ultrafast bootstrap option and ascertain bias correction (-st DNA -o 1105.1_Nahuelbuta -m GTR+ASC -nt 8 -bb 1000)[44]. The number of parsimony informative sites was 156,051. Trees were visualized in the iTOL website (http://itol.embl.de). For STRUC-TURE analysis, a thinned VCF file was generated with vcftools 0.1.15 (—thin 1000)[45],
containing 9,885 similarly-spaced SNPs, while including onlyS. eubayanus strains. Structure was run five times (K ranging from 3 to 7), with 10,000 burn-in and 100,000 replications for each run. Optimal K values were obtained using structure-selector (http://lmme.qdio.ac.cn/ StructureSelector/) [46] according to the Evanno method [47]. The resulting plots were obtained using CLUMPAK [48] and visualized using structure plot (http://omicsspeaks.com/ strplot2/) [49]. We performed clustering analyses of the same samples by using SMARTPCA without outlier removal [50]. For fineSTRUCTURE analysis [51], a non-thinned VCF file was phased using BEAGLE 3.0.4 [52]. We used a constant recombination rate between consecutive SNPs based onS. cerevisae average recombination rate (0.4 cM/kbp, [53]). Chromosomal painting was performed with Chromopainter V2, and its output was further analysed with fineSTRUCTURE (-x 100000 -y 100000 -z 1000).
Analyses of admixture
Historical and recent admixture between populations ofS. eubayanus was tested with Treemix [54] and ADMIXTOOLS (S2 Text) [55]. For Treemix we analysed onlyS. eubayanus individu-als that did not show any sign of recent admixture according to STRUCTURE results, plus the S. uvarum and a S. cerevisiae individual were kept as outgroups. In addition, we pruned out SNPs that were in linkage disequilibrium using PLINK (—indep-pairwise 50 10 0.2). We dis-sected the fiveS. eubayanus populations into subpopulations according to geographical locality and clusters obtained with fineSTRUCTURE as criteria. Treemix was first run ten times for each value of m (migration events) ranging from 1 to 6 (-noss–k 500) and two optimal m val-ues (2 and 4) were estimated using the optM R package (https://cran.r-project.org/web/ packages/OptM/index.html) (S3 Table). Treemix was subsequently run 100 times (2 and 4 migrations, -noss–k 500) after which a consensus tree and bootstrap values were obtained using the BITE R package [56]. We calculated f4 statistics between PA, PB-1, PB-2, PB-3, and HOL populations using the r package admixr [57]. Admixture graph fitting of the calculated f4 statistics was done using the R package admixturegraph [58]. Seven models were tested which were ranked according to their minimal error values (S5D Table).
Population genetics
We estimatedπ and Tajima’s D using the R packages PopGenome 2.6.0 [59]. Values ofFst
were calculated with StAMPP 1.5.1 Weir and Cockerham’s unbiased estimator [60,61] to obtain 95% confidence intervals by performing 5,000 bootstraps. LD decay was estimated by calculating R2 values using vcftools (--geno-r2 -ld-window -bp 100000), which were imported into R to calculate a regression according to [62], for which the half decay was estimated (Ldmax/2).
The variants of theS. eubayanus strains showing recent genetic admixture were split to bins of 100 SNPs and each bin was assigned to target populations using adegenet’s hyb.pred func-tion [63]. GLOBETROTTER was run using the inputs generated for fineSTRUCTURE analy-ses (NULL IND = 0).
The R package hierfstat [64] was used to calculateFis, Hs, and Ho by using the basic.stats
function. To perform a Mantel test, first the Nei’s genetic distances between subpopulations (considering localities) was calculated with the R package StAMPP [61].
Pangenome
Isolates were assembled with Spades using k from 21 to 67. To detect the non-reference mate-rial we used the custom pipeline based on the method described in [5]. Potential lateral trans-ferred ORFs were identified by blast search against an in-house database of 57 yeasts
ORFeomes and to the currently available genomes from the yeast1000+ genome project (https://y1000plus.wei.wisc.edu/). SMART (Simple Modular Architecture Research Tool), used in GENOMIC mode, was used to identify known PFAM protein domains and homolo-gies [65] using all the optional features: Outlier homologues, PFAM domains, signal peptides and internal repeats.
Strains Phenotyping and Fermentations
The microcultivation phenotyping assay of theS. eubayanus strains was performed as previ-ously described [66]. Briefly, isolates were pre-cultivated in 200μL of YNB medium supple-mented with glucose 2% for 48h at 25˚C. For the experimental assay, strains were inoculated to an optical density (OD) of 0.03–0.1 (wavelenght 630 nm) in 200μL of media and incubated without agitation at 25˚C for 24 h (YNB control) and 48 h for other conditions in a Tecan Sun-rise absorbance microplate reader. OD was measured every 20 minutes using a 630 nm filter. Each experiment was performed in quadruplicate. Maximum growth rate, lag time and OD max for each strain were calculated using GrowthRates software with default parameters [67]. Fermentations were conducted using a 12˚P high-gravity wort at 12˚C in 50 mL (micro-fer-mentations) using a Munton’s Connoisseurs Pilsner Lager kit (Muntons plc, England). 50 mL of fresh wort were inoculated to a final concentration of 15× 106viable cells/mL and fermenta-tions were maintained for 14 days and weighed every day to calculate the CO2output. At the
end of the fermentation, metabolites were determined using HPLC.
Supporting information
S1 Fig. FACS analysis inS. eubayanus isolates. (A) Fluorescence values for each sample are shown in grey. (�red): haploid CL609.1; (�green): diploid CL1004.1; (�blue): tetraploid
CL1005.1. (B) Number of cell vs propidium iodide intensity is shown. Haploid (n), diploid (2n) and tetraploid (4n) examples are shown for the same strains as above (�).
(PDF)
S2 Fig. Co-ancestry matrix. A heatmap was obtained using fineSTRUCTURE chunkcounts.
Each row and column represent an isolate and the colour scale indicates genetic sharing (yellow = low sharing, blue = high sharing). The tree shows the clusters inferred from the coan-cestry matrix. Populations and subpopulations can be inferred from the presence of darker col-ours in the diagonal
(PDF)
S3 Fig. Tajima’s D and population differentiation values between lineages (FST). (A) Taji-ma’s D values along the genome for PB-1 (top), PB-2 (middle) and PB-3 (bottom) lineages. Tajima’s D were estimated using the R packages PopGenome 2.6.0. (B). Individual example of extremely low Tajima’s D values in Chromosome V for PB-1 and PB-2. The close-up denotes the genes located within the low Tajima’s D region suggesting a common genetic ancestry.(B) FSTbetween lineages. (C) Pairwise genetic distance between individuals versus geographic
dis-tance. Genetic distances were estimated using the Nei’s distance method. Geographic distances were estimated based on map coordinates in google maps (https://www.google.com/maps). A positive correlation between genetic distance and geographic distance was found.
(PDF)
S4 Fig. Admixture models and gene flow between lineages. (A) Phylogenetic network
obtained with Treemix allowing 0 (A) and 2 (C) migration events. Lines are coloured accord-ing to the migration weight which indicates the fraction of ancestry from the donor popula-tion. Arrows indicate the direction of the admixture event. The scale bar shows ten times the
average standard error of the entries in the sample covariance matrix. (B) and (D) Residual fit of the trees in A and C respectively. (E) Admixture graphs of all models tested. Seven admix-ture graphs models were tested for their goodness of fit to f4 statistics. Continuous edges indi-cate direct ancestry; numbers at these edges denote scaled drift (f2-statistic). Dotted edges indicate admixture; numbers at these edges show the percentage of ancestry contribution. Graphs were constructed using the R package admixturegraph and were exported as qpgraph format.
(PDF)
S5 Fig. Horizontal gene transfer event in PB-2. (A) Principal component analysis using only
non-admixed 83 isolates from all populations shows partial concordance with the phylogenetic tree. The first component clearly separates the Chinese/North American branch from the South American lineages. Second component identifies the PB-3 as the most separated lineage, suggesting a lower level of outbreeding, while a partial overlap can be identified between the other lineages. The middle positioning of PB-1 using the third component mirrors the shape of the un-rooted phylogenetic tree based on the sequence divergence (Fig 2). (B) Nine ORFs, within the denominate Region A, have been identified on a single contig in 9 isolates. Around 6 kb of the flanking regions of these ORFs correspond to the chromosome I subtelomere, while the region where the ORFs are located do not show any similarities with known regions. (C) In the aminoacidic sequence of the nine ORFs, several domains can be identified of inferred by homologies.
(PDF)
S6 Fig. Principal Component Analysis of growth rates obtained under eight different con-ditions across isolates.
(PDF)
S1 Text. Extended methods with details on the procedures utilised on each methods sub-section.
(DOCX)
S2 Text. Detailed explanation of the admixture analyses performed.
(DOCX)
S1 Table. Number of samples obtained from each National Park.
(XLSX)
S2 Table. Bioinformatics Summary statistics together with NCBI accession numbers. (A)
Bioinformatics Summary statistics and (B) Sequence identity matrix between strains. (XLSX)
S3 Table. Structure selector output.
(XLSX)
S4 Table. Population genetics summary statistics for each lineage & locality, Globetrotter analysis andFst values per lineages and localities. (A) Population genetics summary statistics for each lineage & locality, (B) Fst values.
(XLSX)
S5 Table. Admixture test and f4 statistics. (A) Globetrotter analysis, (B) Optimal migration
events for Treemix analysis, (C) f4 statistics, (D) Admixture graphs tested and their best error values, (E) de Novo assembly statistics, (F) Accessory genes inS. eubayanus and number of strains containing each gene, (G) Domains found in the candidate LGT in the PB-2 lineage,
(H) Accessory ORFs found in the HOL lineage. (XLSX)
S6 Table. Phenotype data forS. eubayanus strains. (A). Raw phenotypic values. (B) Phenoty-pe’s correlations and (C). Phenotype comparison across localities.
(XLSX)
S7 Table. Fermentation data forS. eubayanus strains. (A) CO2lost in all strains. (B) Dunn’s
multiple comparisons test across localities and (C) Physical Chemical parameters after wort fermentation.
(XLSX)
Acknowledgments
We would like to thank Valentina Abarca, Wladimir Mardones and Antonio Molina for tech-nical help and Yessica Pe´rez, Antonia Nespolo, Natalia Hassan and Vero´nica Briceño for help-ing us in the samplhelp-ing field trips recognishelp-ingNothofagus trees. We also thank Gilles Fischer for constructive feedback on the data analysis and the manuscript. We thank CONAF and WCS Chile for allowing us sampling yeasts across the country. Finally, we thank Ginkgobioworks for generating the sequence data, and Michael Handford (Universidad de Chile) for language support.
Author Contributions
Conceptualization: Roberto F. Nespolo, Francisco A. Cubillos. Data curation: Carlos A. Villarroel.
Formal analysis: Carlos A. Villarroel, Matteo De Chiara, Pablo Saenz-Agudelo, Francisco A.
Cubillos.
Funding acquisition: Roberto F. Nespolo, Dawn Thompson, Luis F. Larrondo, Gianni Liti,
Francisco A. Cubillos.
Investigation: Francisco A. Cubillos.
Methodology: Carlos A. Villarroel, Christian I. Oporto, Sebastia´n M. Tapia, Franco
Vega-Macaya, Kamila Urbina, Simone Mozzachiodi, Ekaterina Mikhalev.
Project administration: Francisco A. Cubillos. Supervision: Francisco A. Cubillos.
Writing – original draft: Roberto F. Nespolo, Carlos A. Villarroel, Francisco A. Cubillos. Writing – review & editing: Roberto F. Nespolo, Luis F. Larrondo, Pablo Saenz-Agudelo,
Gianni Liti, Francisco A. Cubillos.
References
1. Arnold ML. Evolution Through Genetic Exchange. Evolution through Genetic Exchange. 2007:1–252. https://doi.org/10.1093/acprof:oso/9780199229031.001.0001
2. Gladieux P, Wilson BA, Perraudeau F, Montoya LA, Kowbel D, Hann-Soden C, et al. Genomic sequencing reveals historical, demographic and selective factors associated with the diversification of the fire-associated fungus Neurospora discreta. Mol Ecol. 2015; 24(22):5657–75. Epub 2015/10/11. doi:10.1111/mec.13417. PMID:26453896.
3. Dujon BA, Louis EJ. Genome Diversity and Evolution in the Budding Yeasts (Saccharomycotina). Genetics. 2017; 206(2):717–50. doi:10.1534/genetics.116.199216. PMID:28592505.
4. Borneman AR, Pretorius IS. Genomic insights into the Saccharomyces sensu stricto complex. Genet-ics. 2015; 199(2):281–91. doi:10.1534/genetics.114.173633. PMID:25657346; PubMed Central PMCID: PMC4317643.
5. Peter J, De Chiara M, Friedrich A, Yue JX, Pflieger D, Bergstrom A, et al. Genome evolution across 1,011 Saccharomyces cerevisiae isolates. Nature. 2018; 556(7701):339–44. doi: 10.1038/s41586-018-0030-5. PMID:29643504.
6. Legras JL, Galeote V, Bigey F, Camarasa C, Marsit S, Nidelet T, et al. Adaptation of S. cerevisiae to Fermented Food Environments Reveals Remarkable Genome Plasticity and the Footprints of Domesti-cation. Mol Biol Evol. 2018; 35(7):1712–27. doi:10.1093/molbev/msy066. PMID:29746697; PubMed Central PMCID: PMC5995190.
7. Liti G, Carter DM, Moses AM, Warringer J, Parts L, James SA, et al. Population genomics of domestic and wild yeasts. Nature. 2009; 458(7236):337–41. Epub 2009/02/13. doi:10.1038/nature07743. PMID: 19212322; PubMed Central PMCID: PMC2659681.
8. Gallone B, Steensels J, Prahl T, Soriaga L, Saels V, Herrera-Malaver B, et al. Domestication and Diver-gence of Saccharomyces cerevisiae Beer Yeasts. Cell. 2016; 166(6):1397–410 e16. doi:10.1016/j.cell. 2016.08.020. PMID:27610566; PubMed Central PMCID: PMC5018251.
9. Goncalves M, Pontes A, Almeida P, Barbosa R, Serra M, Libkind D, et al. Distinct Domestication Trajec-tories in Top-Fermenting Beer Yeasts and Wine Yeasts. Curr Biol. 2016; 26(20):2750–61. doi:10.1016/ j.cub.2016.08.040. PMID:27720622.
10. Schacherer J, Shapiro JA, Ruderfer DM, Kruglyak L. Comprehensive polymorphism survey elucidates population structure of Saccharomyces cerevisiae. Nature. 2009; 458(7236):342–5. doi:10.1038/ nature07670. PMID:19212320; PubMed Central PMCID: PMC2782482.
11. Yue JX, Li J, Aigrain L, Hallin J, Persson K, Oliver K, et al. Contrasting evolutionary genome dynamics between domesticated and wild yeasts. Nat Genet. 2017. doi:10.1038/ng.3847. PMID:28416820.
12. Boynton PJ, Greig D. The ecology and evolution of non-domesticated Saccharomyces species. Yeast. 2014; 31(12):449–62.https://doi.org/10.1002/yea.3040PMID:25242436
13. Almeida P, Goncalves C, Teixeira S, Libkind D, Bontrager M, Masneuf-Pomarede I, et al. A Gondwanan imprint on global diversity and domestication of wine and cider yeast Saccharomyces uvarum. Nat Commun. 2014; 5:4044. doi:10.1038/ncomms5044. PMID:24887054.
14. Eberlein C, Henault M, Fijarczyk A, Charron G, Bouvier M, Kohn LM, et al. Hybridization is a recurrent evolutionary stimulus in wild yeast speciation. Nat Commun. 2019; 10(1):923. Epub 2019/02/26. doi: 10.1038/s41467-019-08809-7. PMID:30804385; PubMed Central PMCID: PMC6389940.
15. Tilakaratna V, Bensasson D. Habitat Predicts Levels of Genetic Admixture in Saccharomyces cerevi-siae. G3 (Bethesda, Md). 2017; 7(9):2919–29. doi:10.1534/g3.117.041806. PMID:28696926.
16. Goddard MR, Greig D. Saccharomyces cerevisiae: a nomadic yeast with no niche? FEMS Yeast Res. 2015; 15(3). Epub 2015/03/01. doi:10.1093/femsyr/fov009. PMID:25725024; PubMed Central PMCID: PMC4444983.
17. Krogerus K, Magalhaes F, Vidgren V, Gibson B. Novel brewing yeast hybrids: creation and application. Appl Microbiol Biotechnol. 2017; 101(1):65–78. doi:10.1007/s00253-016-8007-5. PMID:27885413; PubMed Central PMCID: PMC5203825.
18. Baker E, Wang B, Bellora N, Peris D, Hulfachor AB, Koshalek JA, et al. The Genome Sequence of Sac-charomyces eubayanus and the Domestication of Lager-Brewing Yeasts. Mol Biol Evol. 2015; 32 (11):2818–31. doi:10.1093/molbev/msv168. PMID:26269586; PubMed Central PMCID: PMC4651232.
19. Libkind D, Hittinger CT, Valerio E, Goncalves C, Dover J, Johnston M, et al. Microbe domestication and the identification of the wild genetic stock of lager-brewing yeast. Proc Natl Acad Sci U S A. 2011; 108 (35):14539–44. doi:10.1073/pnas.1105430108. PMID:21873232; PubMed Central PMCID: PMC3167505.
20. Eizaguirre JI, Peris D, Rodriguez ME, Lopes CA, De Los Rios P, Hittinger CT, et al. Phylogeography of the wild Lager-brewing ancestor (Saccharomyces eubayanus) in Patagonia. Environ Microbiol. 2018. doi:10.1111/1462-2920.14375. PMID:30105823.
21. Gayevskiy V, Goddard MR. Saccharomyces eubayanus and Saccharomyces arboricola reside in North Island native New Zealand forests. Environ Microbiol. 2016; 18(4):1137–47. doi:10.1111/1462-2920. 13107. PMID:26522264.
22. Peris D, Sylvester K, Libkind D, Goncalves P, Sampaio JP, Alexander WG, et al. Population structure and reticulate evolution of Saccharomyces eubayanus and its lager-brewing hybrids. Mol Ecol. 2014; 23(8):2031–45. doi:10.1111/mec.12702. PMID:24612382.
23. Langdon QK, Peris D, Eizaguirre JI, Opulente DA, Buh KV, Sylvester K, et al. Postglacial migration shaped the genomic diversity and global distribution of the wild ancestor of lager-brewing hybrids. PLoS Genet. 2020; 16(4):e1008680. doi:10.1371/journal.pgen.1008680. PMID:32251477.
24. Bing J, Han PJ, Liu WQ, Wang QM, Bai FY. Evidence for a Far East Asian origin of lager beer yeast. Curr Biol. 2014; 24(10):R380–1. doi:10.1016/j.cub.2014.04.031. PMID:24845661.
25. Peris D, Langdon QK, Moriarty RV, Sylvester K, Bontrager M, Charron G, et al. Complex Ancestries of Lager-Brewing Hybrids Were Shaped by Standing Variation in the Wild Yeast Saccharomyces eubaya-nus. PLoS Genet. 2016; 12(7):e1006155. doi:10.1371/journal.pgen.1006155. PMID:27385107; PubMed Central PMCID: PMC4934787.
26. Cubillos FA, Gibson B, Grijalva-Vallejos N, Krogerus K, Nikulin J. Bioprospecting for brewers: Exploiting natural diversity for naturally diverse beers. Yeast. 2019. doi:10.1002/yea.3380. PMID:30698853.
27. Novo M, Bigey F, Beyne E, Galeote V, Gavory F, Mallet S, et al. Eukaryote-to-eukaryote gene transfer events revealed by the genome sequence of the wine yeast Saccharomyces cerevisiae EC1118. Proc Natl Acad Sci U S A. 2009; 106(38):16333–8. doi:10.1073/pnas.0904673106. PMID:19805302; PubMed Central PMCID: PMC2740733.
28. Hinojosa LF, Gaxiola A, Pe´rez MF, Carvajal F, Campano MF, Quattrocchio M, et al. Non-congruent fos-sil and phylogenetic evidence on the evolution of climatic niche in the Gondwana genus Nothofagus. Journal of Biogeography. 2016; 43(3):555–67.https://doi.org/10.1111/jbi.12650
29. de Porras ME, Maldonado A, Abarzua AM, Cardenas ML, Francois JP, Martel-Cea A, et al. Postglacial vegetation, fire and climate dynamics at Central Chilean Patagonia (Lake Shaman, 44 degrees S). Qua-ternary Sci Rev. 2012; 50:71–85. doi:10.1016/j.quascirev.2012.06.015. WOS:000309434000006.
30. Ponce JF, Ferna´ ndez M. Climatic and Environmental History of Isla de los Estados, Argentina: Springer Netherlands; 2014.
31. Hildebrand-Vogel R, Godoy R, Vogel A. Subantarctic-Andean Nothofagus pumilio Forests: Distribution Area and Synsystematic Overview; Vegetation and Soils as Demonstrated by an Example of a South Chilean Stand. Vegetatio. 1990; 89(1):55–68.
32. Hill RS. Nothofagus: Evolution from a southern perspective. Trends Ecol Evol. 1992; 7(6):190–4. doi: 10.1016/0169-5347(92)90071-I. PMID:21236005.
33. Duan S-F, Han P-J, Wang Q-M, Liu W-Q, Shi J-Y, Li K, et al. The origin and adaptive evolution of domesticated populations of yeast from Far East Asia. Nature Communications. 2018; 9(1):2690. https://doi.org/10.1038/s41467-018-05106-7PMID:30002370
34. SE´ Rsic AN, Cosacov A, Cocucci AA, Johnson LA, Pozner R, Avila LJ, et al. Emerging phylogeographi-cal patterns of plants and terrestrial vertebrates from Patagonia. Biologiphylogeographi-cal Journal of the Linnean Soci-ety. 2011; 103(2):475–94.https://doi.org/10.1111/j.1095-8312.2011.01656.x
35. Kawecki TJ, Ebert D. Conceptual issues in local adaptation. Ecol Lett. 2004; 7(12):1225–41.https://doi. org/10.1111/j.1461-0248.2004.00684.x
36. Sampaio JP, Goncalves P. Natural populations of Saccharomyces kudriavzevii in Portugal are associ-ated with oak bark and are sympatric with S. cerevisiae and S. paradoxus. Appl Environ Microbiol. 2008; 74(7):2144–52. doi:10.1128/AEM.02396-07. PMID:18281431; PubMed Central PMCID: PMC2292605.
37. J White T, Bruns T, Lee S, Taylor J, A Innis M, H Gelfand D, et al. Amplification and Direct Sequencing of Fungal Ribosomal RNA Genes for Phylogenetics. 311990. p. 315–22.
38. Brickwedde A, Brouwers N, van den Broek M, Gallego Murillo JS, Fraiture JL, Pronk JT, et al. Structural, Physiological and Regulatory Analysis of Maltose Transporter Genes in Saccharomyces eubayanus CBS 12357(T). Front Microbiol. 2018; 9:1786. doi:10.3389/fmicb.2018.01786. PMID:30147677; PubMed Central PMCID: PMC6097016.
39. Chen S, Zhou Y, Chen Y, Gu J. fastp: an ultra-fast all-in-one FASTQ preprocessor. Bioinformatics. 2018; 34(17):i884–i90. Epub 2018/11/14. doi:10.1093/bioinformatics/bty560. PMID:30423086; PubMed Central PMCID: PMC6129281.
40. Li H. Aligning sequence reads, clone sequences and assembly contigs with BWA-MEM2013.
41. DePristo MA, Banks E, Poplin R, Garimella KV, Maguire JR, Hartl C, et al. A framework for variation dis-covery and genotyping using next-generation DNA sequencing data. Nat Genet. 2011; 43(5):491–8. Epub 2011/04/12. doi:10.1038/ng.806. PMID:21478889; PubMed Central PMCID: PMC3083463.
42. Cingolani P, Platts A, Wang le L, Coon M, Nguyen T, Wang L, et al. A program for annotating and pre-dicting the effects of single nucleotide polymorphisms, SnpEff: SNPs in the genome of Drosophila mela-nogaster strain w1118; iso-2; iso-3. Fly. 2012; 6(2):80–92. Epub 2012/06/26. doi:10.4161/fly.19695. PMID:22728672; PubMed Central PMCID: PMC3679285.
43. Nguyen LT, Schmidt HA, von Haeseler A, Minh BQ. IQ-TREE: a fast and effective stochastic algorithm for estimating maximum-likelihood phylogenies. Mol Biol Evol. 2015; 32(1):268–74. Epub 2014/11/06. doi:10.1093/molbev/msu300. PMID:25371430; PubMed Central PMCID: PMC4271533.
44. Hoang DT, Chernomor O, von Haeseler A, Minh BQ, Vinh LS. UFBoot2: Improving the Ultrafast Boot-strap Approximation. Mol Biol Evol. 2018; 35(2):518–22. Epub 2017/10/28. doi:10.1093/molbev/ msx281. PMID:29077904; PubMed Central PMCID: PMC5850222.
45. Danecek P, Auton A, Abecasis G, Albers CA, Banks E, DePristo MA, et al. The variant call format and VCFtools. Bioinformatics. 2011; 27(15):2156–8. Epub 2011/06/10. doi:10.1093/bioinformatics/btr330. PMID:21653522; PubMed Central PMCID: PMC3137218.
46. Li YL, Liu JX. StructureSelector: A web-based software to select and visualize the optimal number of clusters using multiple methods. Mol Ecol Resour. 2018; 18(1):176–7. Epub 2017/09/19. doi:10.1111/ 1755-0998.12719. PMID:28921901.
47. Evanno G, Regnaut S, Goudet J. Detecting the number of clusters of individuals using the software STRUCTURE: a simulation study. Mol Ecol. 2005; 14(8):2611–20. Epub 2005/06/23. doi:10.1111/j. 1365-294X.2005.02553.x. PMID:15969739.
48. Kopelman NM, Mayzel J, Jakobsson M, Rosenberg NA, Mayrose I. Clumpak: a program for identifying clustering modes and packaging population structure inferences across K. Mol Ecol Resour. 2015; 15 (5):1179–91. Epub 2015/02/17. doi:10.1111/1755-0998.12387. PMID:25684545; PubMed Central PMCID: PMC4534335.
49. Ramasamy RK, Ramasamy S, Bindroo BB, Naik VG. STRUCTURE PLOT: a program for drawing ele-gant STRUCTURE bar plots in user friendly interface. SpringerPlus. 2014; 3(1):431.https://doi.org/10. 1186/2193-1801-3-431PMID:25152854
50. Patterson N, Price AL, Reich D. Population structure and eigenanalysis. PLoS genetics. 2006; 2(12): e190–e. doi:10.1371/journal.pgen.0020190. PMID:17194218.
51. Lawson DJ, Hellenthal G, Myers S, Falush D. Inference of Population Structure using Dense Haplotype Data. PLOS Genetics. 2012; 8(1):e1002453.https://doi.org/10.1371/journal.pgen.1002453PMID: 22291602
52. Browning SR, Browning BL. Rapid and Accurate Haplotype Phasing and Missing-Data Inference for Whole-Genome Association Studies By Use of Localized Haplotype Clustering. The American Journal of Human Genetics. 2007; 81(5):1084–97.https://doi.org/10.1086/521987PMID:17924348
53. Cubillos FA, Billi E, Zorgo E, Parts L, Fargier P, Omholt S, et al. Assessing the complex architecture of polygenic traits in diverged yeast populations. Mol Ecol. 2011. Epub 2011/01/26. doi: 10.1111/j.1365-294X.2011.05005.x. PMID:21261765.
54. Pickrell JK, Pritchard JK. Inference of Population Splits and Mixtures from Genome-Wide Allele Fre-quency Data. PLOS Genetics. 2012; 8(11):e1002967.https://doi.org/10.1371/journal.pgen.1002967 PMID:23166502
55. Patterson N, Moorjani P, Luo Y, Mallick S, Rohland N, Zhan Y, et al. Ancient Admixture in Human His-tory. Genetics. 2012; 192(3):1065–93.https://doi.org/10.1534/genetics.112.145037PMID:22960212
56. Milanesi M, Capomaccio S, Vajana E, Bomba L, Garcia JF, Ajmone-Marsan P, et al. BITE: an R pack-age for biodiversity analyses. bioRxiv. 2017:181610.https://doi.org/10.1101/181610
57. Petr M, Vernot B, Kelso J. admixr—R package for reproducible analyses using ADMIXTOOLS. Bioinfor-matics. 2019; 35(17):3194–5.https://doi.org/10.1093/bioinformatics/btz030PMID:30668635
58. Leppa¨ la¨ K, Nielsen SV, Mailund T. admixturegraph: an R package for admixture graph manipulation and fitting. Bioinformatics. 2017; 33(11):1738–40.https://doi.org/10.1093/bioinformatics/btx048PMID: 28158333
59. Pfeifer B, Wittelsburger U, Ramos-Onsins SE, Lercher MJ. PopGenome: an efficient Swiss army knife for population genomic analyses in R. Mol Biol Evol. 2014; 31(7):1929–36. doi:10.1093/molbev/ msu136. PMID:24739305; PubMed Central PMCID: PMC4069620.
60. Weir BS, Cockerham CC. Estimating F-Statistics for the Analysis of Population Structure. Evolution. 1984; 38(6):1358–70. doi:10.1111/j.1558-5646.1984.tb05657.x. PMID:28563791.
61. Pembleton LW, Cogan NO, Forster JW. StAMPP: an R package for calculation of genetic differentiation and structure of mixed-ploidy level populations. Mol Ecol Resour. 2013; 13(5):946–52. Epub 2013/06/ 07. doi:10.1111/1755-0998.12129. PMID:23738873.
62. Hill WG, Weir BS. Variances and covariances of squared linkage disequilibria in finite populations. Theor Popul Biol. 1988; 33(1):54–78. Epub 1988/02/01.https://doi.org/10.1016/0040-5809(88)90004-4 PMID:3376052.
63. Jombart T. adegenet: a R package for the multivariate analysis of genetic markers. Bioinformatics. 2008; 24(11):1403–5. Epub 2008/04/10. doi:10.1093/bioinformatics/btn129. PMID:18397895.