HAL Id: hal-02870881
https://hal.archives-ouvertes.fr/hal-02870881
Submitted on 17 Jun 2020
HAL is a multi-disciplinary open access
archive for the deposit and dissemination of
sci-entific research documents, whether they are
pub-lished or not. The documents may come from
teaching and research institutions in France or
abroad, or from public or private research centers.
L’archive ouverte pluridisciplinaire HAL, est
destinée au dépôt et à la diffusion de documents
scientifiques de niveau recherche, publiés ou non,
émanant des établissements d’enseignement et de
recherche français ou étrangers, des laboratoires
publics ou privés.
tool based on a gravitational model: strategic decision
support in hospital catchment area planning
Anne Quesnel-Barbet, Julien Soula, Mathurin Gamichon, Ismahane Ben
Gayed, Francois Dufossez, Pierre Bazile, Eric-André Sauleau, Pierre Parrend,
Arnaud Hansske
To cite this version:
Anne Quesnel-Barbet, Julien Soula, Mathurin Gamichon, Ismahane Ben Gayed, Francois Dufossez,
et al.. PoleSat_2018: an optimized, automated, geomatics IT tool based on a gravitational model:
strategic decision support in hospital catchment area planning. SN Applied Sciences, Springer Verlag,
2020, 2 (5), �10.1007/s42452-020-2735-y�. �hal-02870881�
1
PoleSat_2018: an optimized, automated, geomatics IT tool based on
a gravitational model: strategic decision support in hospital
catchment area planning
Anne Quesnel-Barbeta,b1, Julien Soulac, Mathurin Gamichond, Ismahane Ben Gayedd, François Dufosseze,
Pierre Bazilef, Eric-André Sauleaug,h, Pierre Parrendh,i, Arnaud Hansskej
aCHU Lille-MRRC, Public Health Hub, F-59000 Lille, France. bUniv.Côte d’Azur, UPR, RETINES Lab, F-06000 Nice, France.
cUniv.Lille, CHU Lille, EA 2694 – Public Health, F-59000 Lille, France. dPolytech Lille, engineering School, F-59000 Lille, France.
eMedical Center (CH) Béthune, DIM, F-62131 Verquigneul, France.
fFrench Association for Geographic Information, F-94160 Saint-Mandé, France. gUniversity Medical Center, Public Health, F-67000 Strasbourg, France.
hUniv. Strasbourg, CNRS, CSDC UNESCO Unitwin, ICube Lab, F-67000, France. iECAM Strasbourg-Europe, F-67300 Schiltigheim, France.
jGHICL, CH Saint-Philibert, DIM, DSIO, F-59462 Lomme, France.
Author identification Anne Quesnel-Barbet: 0003-1038-7344; Julien Soula: orcid.org/0000-0003-0875-7713; François Dufossez: orcid.org/8349-2845; Pierre Bazile: orcid.org/ 0000-0001-9192-7503; Eric-André Sauleau: orcid.org/0000-0003-1178-1060; Pierre Parrend: orcid.org/0000-0002-1680-1182; Arnaud Hansske: orcid.org/0000-0001-7029-2318;
1 Anne Quesnel, CHU of Lille, MRRC, Pôle de Santé Publique, CS 70001, F-59037 Lille cedex, France. :
anne.quesnel@univ-cotedazur.fr, Phone +33-658-066-808. 1 2 3 4 5 6 7 8 9 10 11 12 13 14 15 16 17 18 19 20 21 22 23 24 25 26 27 28 29 30 31 32 33 34 35 36 37 38 39 40 41 42 43 44 45 46 47 48 49 50 51 52 53 54 55 56 57 58 59 60
Abstract
In France and elsewhere, decision-makers, healthcare professionals and health planners need to better understand and specify the provision of medical care. To this end, a hospital-based research project on a gravitational health planning modelling process was initiated in 2002. Since then, geomatics has emerged as a major scientific field for facing new challenges in medical informatics and health planning, thanks to the use of attractive interfaces, new methods and user-friendly IT technologies. Our initial 2002 model has recently been enhanced, optimized and automated as part of a spatial decision support system
(PoleSat_2018). These decisive improvements and optimizations were mainly based on Delaunay
triangulation, the replacement of human expertise with a heuristic dominance rule that provides a complete automated algorithm, and an online graphical user interface. Rapid, easy planning scenarios (by grouping and/or closing hospitals) give a quasi-instantaneous, strategic visualization of hospital catchment areas for decision-makers who are not experts in geomatics via ready-to-use maps and spreadsheets. This new implementation achieves our main objective, since the proposed deterministic method provides a completely automated, stable algorithm. A custom version of this tool is now being used by the French Ministry of Health for real planning issues. Consequently, PoleSat could be easily generalized as a prospective, strategic decision support tool for various health planning issues.
Article Highlights
PoleSat’s algorithm (based on a gravitational model) was developed in 2002 and optimized, automated and stabilized in 2016.
Easy-to-use, rapidly implemented health planning scenarios provide a quasi-instantaneous, strategic view of hospital catchment areas.
A custom version of PoleSat could be easily generalized as a prospective, strategic decision support tool for various health planning issues.
Keywords
Catchment area (health), Computer simulation, Diagnosis-related groups, Decision support systems (clinical), Gravitation, Marketing of health services
1 2 3 4 5 6 7 8 9 10 11 12 13 14 15 16 17 18 19 20 21 22 23 24 25 26 27 28 29 30 31 32 33 34 35 36 37 38 39 40 41 42 43 44 45 46 47 48 49 50 51 52 53 54 55 56 57 58 59 60
1. Introduction
As in other countries, decision-makers, healthcare professionals and planners in France need to understand, plan and specify the provision of medical care (in terms of hospital capacities, availability and supply) by assessing hospital attraction areas (i.e. catchment areas) and the patients’ travel patterns [1]. In 2002, we started to develop a new method and a specific analytical tool as part of a geography PhD thesis [2]. The four-step modelling process was based on the “shortest route” hypothesis, a refined version of Reilly’s law of retail gravitation, and a limited geographic area. In 2016, the method was optimized and then fully automated within a spatial decision support system [3, 4] and (using similar disease categories) extended to France as a whole.
Today, the demonstration version of the PoleSat_2018 IT tool comprises a web-based graphical user interface (GUI), an embedded, validated and optimized geometric algorithm, complete automation; and a modelling environment for the prospective simulation of health planning provision (e.g. hospital closures or mergers). PoleSat_2018 is based on easy-to-use technologies and includes two types of hospital
department; it can be used to test assumptions and provide immediate strategic spatial views [5]. The tool was designed primarily (but not exclusively) for health decision-makers who are not experts in geomatics. It has been available as a free-to-use, open-access demonstration tool since 2018 and as a private-access custom commercial version since June 2019.
Here, we report on a decisive improvement of the initial model and thus the creation of a truly operational tool. After summarizing the development of the initial method in a context of hospital systems research, we shall describe the new implementation of the PoleSat_2018 tool and present illustrative results in response to a number of issues, such as the positive and/or negative effects of closing or merging hospital hubs/services on the neighboring hospital hubs’ catchment areas and patient recruitment patterns. Our objectives were to (i) describe how we optimized and automated PoleSat's algorithm, (ii) show the settings for the connections between the algorithm and the GUI, and (iii) present and discuss the main modelling results that can be produced after a short processing time.
The manuscript is organized as follows. Firstly, section 1 provides the background to our research on hospital/healthcare systems research, public health, healthcare catchment areas, organization needs, geomatics, geographical concepts, systems approaches and interaction models. The following two sections describe the methodology in detail: section 2 covers the optimization and automation process (based on the
1 2 3 4 5 6 7 8 9 10 11 12 13 14 15 16 17 18 19 20 21 22 23 24 25 26 27 28 29 30 31 32 33 34 35 36 37 38 39 40 41 42 43 44 45 46 47 48 49 50 51 52 53 54 55 56 57 58 59 60
“dominance rule”) and our enhanced equation (based on Reilly’s law of retail gravitation), section 3 describes the GUI settings related to the optimized algorithm from section 1. Additional methods covering the hosting, the software architecture, and verification of the computation process are given in the “Online Resource 1”. Section 4 presents the material (the equipment and databases used), and section 5 presents the results obtained with “default simulation” and “advanced second-order simulations” GUI settings. In section 6, we discuss the tool, our results, the optimization of the algorithm, and perspectives for future research. Our conclusions are set out in section 7.
It should be noted that the present manuscript provides examples of what can be achieved using geo-informatics and theoretical modelling. The actual use of PoleSat_2018 for decision support in territorial planning will not be presented or discussed here. Only the custom (commercial) version uses simulation to address specific, “real world” planning issues (in December 2019, a poster on this topic was accepted for presentation at the MIE-2020 conference).
1.1.
Background, part 1: research on hospital systems and public
health
Public health research considers the health of the population rather than the health of an individual [6]. In France, multidisciplinary hospital systems research [7, 8] focuses not only on fighting diseases but also on developing new scientific methods, analyses and tools that address the specific needs of healthcare professionals [9-14, 2, 15, 16]. The French public health medicine can be practiced inside or outside a hospital setting: inside, the goal is to improve the hospital’s administrative and scientific activities by developing skills in biostatistics, the spatial analysis of diseases, bioinformatics, medical informatics, epidemiology, medical information, medical archives, care organization, clinical research, care safety, hygiene, and so on [17]. Outside the hospital, public health activities are performed by various national or regional healthcare administrations (government ministries, the national biomedicine agency, regional health agencies (Agence Régionale de Santé), occupational health services, etc.), with a view to organizing care services and facilities and developing health policies. Moreover, public health activities are performed in other public- and private-sector organizations [17-19].
The territorial organization of healthcare is an important topic for countries and organizations worldwide. Over the last few years, various countries have performed health resource planning [20-25, 1, 26-30] with analytical methods and tools that have been adapted for use with specific organizational
1 2 3 4 5 6 7 8 9 10 11 12 13 14 15 16 17 18 19 20 21 22 23 24 25 26 27 28 29 30 31 32 33 34 35 36 37 38 39 40 41 42 43 44 45 46 47 48 49 50 51 52 53 54 55 56 57 58 59 60
structures, scientific viewpoints and cultural habits [31]. Various methods and tools based on geomatics, systems approaches, simulation modelling or hierarchical modelling (i.e. predictive modelling) have been introduced in order to focus and hopefully solve health public problems, including death on waiting lists in cardiology, drug expenditure, mental disability, the collection of blood donations, and the provision of maternity services [15, 32-43].
In France, awareness of territorial and hospital planning issues in both public- and private-sector hospitals has been raised by (i) the nationwide introduction of regional care plans [15, 44], (ii) descriptive maps for care supply and the reduction of health inequalities, and (iii) prospective organizational modelling for groups of diseases or high-priority medical specialties, and telemedicine [45]. In 2016, new healthcare legislation required public-sector hospitals to be organized into groupements hospitaliers de territoires (GHTs/THGs, territorial hospital groupings) [44, 46]. The members of a GHT/THG must share [45] IT resources, financial resources, equipment, staff, and patients. These processes have often triggered controversies or protests with regard to the closure of maternity units [21, 22, 29, 47-49].
Consequently, geomatics has become an important digital tool for decision-making in the field of public health [14], such as studies of the urban environment and related health issues [50]. Furthermore, the emergence of geomatics has been coupled to the growth in open-source tools, services and databases, such as R statistical and graphing software [51, 52]. In recent years, French hospitals and decision-makers have increasingly focused on innovative methods and tools which for the prospective, critical management of health resources [31, 53]. Health geomatics (also known as health geo-informatics, and defined in the ISO/TC 211 series of standards as the "discipline concerned with the collection, distribution, storage, analysis, processing and presentation of geographic data or geographic information”) [54] is becoming a major scientific field in France, just as it is in Anglo-Saxon countries and French-speaking Canada [4, 13, 34, 55, 56]. Health geomatics thus helps healthcare professionals to understand how people interact in a given environment and how health policy and planning can be designed and implemented accordingly; it can therefore make decisive contributions to public policy decisions and the management of healthcare
institutions [4, 14, 30, 57-61]. The concept of spatial accessibility is of prime importance. A gravitational model of interaction (see section 1.2) can provide valid measures of spatial accessibility in both rural and urban areas [53, 62-65]. Enhanced gravitational models have attracted much interest for use in various health geomatics applications; they include two-step and three-step floating catchment area models [66-68], the compound gravity model, and the kernel density method [62].
1 2 3 4 5 6 7 8 9 10 11 12 13 14 15 16 17 18 19 20 21 22 23 24 25 26 27 28 29 30 31 32 33 34 35 36 37 38 39 40 41 42 43 44 45 46 47 48 49 50 51 52 53 54 55 56 57 58 59 60
1.2.
Background, part 2: geographical concepts, systemics in
healthcare, and the concept of interaction
The original model mentioned in the Introduction [2] must be considered in the context of a neo-positivist, radical, behavioral view of geography [69]. Knowledge about the organization of geographical space is gained through concepts of movement, networks, nodes, hierarchies, and areas [65, 70]. This “new” geography [71] has since generated novel systems analysis tools that provide a better understanding of geosystems (spatial organizations originating from the physical environment) and socio-economic systems (spatial organizations that arise from processes related to human activities, i.e. geographical structures). Spatial organization involves the analysis of not only structures but also dynamic, productive processes and mechanisms and the balance between physical and human systems.
As early as the 1960s, quantitative tools were used to analyze the spatial distribution of phenomena in terms of various characteristics: shapes, geometries, types of spatial models [72, 70], formal statistics, and mathematical models [73]. Thus, geography can be considered as "the science of distributions and models"; it highlights the importance of analyzing spatial organization2 by using systems theory [74] from which
spatial models3, structures, relationships and processes will be derived. These models may be dedicated to
studies of movement, morphologies and distances (i.e. concepts of interaction), movement and areas (i.e. the concepts of field and territory), and movement and time (i.e. the concept of diffusion). This movement led to the definition of geographical space as "a social product because it results from the work that society organizes to achieve its objectives; each society has its own space. Space is a social dimension" [75].
In parallel with the creation of the “new” geography movement in the 1960s, systems analysis by non-geographers has developed considerably since 1945. Results are made intelligible through modelling; according to Valéry, “We only think in models”. Furthermore, Lemoigne wrote that “A complex system needs modelling to build its intelligibility" [76].
2 The concept of “organization” expresses the existence of an order for (and interrelationships between) the parts or
elements composing a set.
3The pioneers of “new” geography include Hägerstrand, W Isard., Bailly (1984), Claval (1984), Gould (1985), Capel
(1981), Gregory (1985), Johnston (1987), Johnston and Claval (1984).
1 2 3 4 5 6 7 8 9 10 11 12 13 14 15 16 17 18 19 20 21 22 23 24 25 26 27 28 29 30 31 32 33 34 35 36 37 38 39 40 41 42 43 44 45 46 47 48 49 50 51 52 53 54 55 56 57 58 59 60
Modelling by analogy to Newton’s law of universal gravitation
Modelling based on gravitational models was first performed for topics in economics (e.g. marketing and retail trade, by Reilly [77, 78], and was then taken up and developed by Anglo-Saxon geographers [65, 70, 79]. In France, Reilly’s law of retail gravitation was applied to health planning in the 1990s. The scientific literature (and an unpublished report by Vigneron, 1994) (see p. 173 in [2]) [15, 80-82] demonstrated that "the general trend observed during movements" (of individuals, goods, etc.) is governed by the “shortest route” hypothesis (on foot, driving, etc.). Consequently, one must obligatorily confirm this hypothesis before applying a model based on Newton’s law of universal gravitation. Thus, both geographers and economists (see p. 174 in [2]) [83] built two applied models (in the former Nord-Pas-de-Calais and Languedoc-Roussillon regions) of organizations for decision support in health planning. These models express (i) the existence of an order and (ii) interrelationships between the parts or elements composing a set. In fact, the third model is the one that we implemented in 2002 (as mentioned in the Introduction). We enhanced the model and validated it [2] for a non-mountainous region of France with a high road density - justifying the use of Euclidean distance.
Below, we provide a brief introduction to Newton’s law of universal gravitation and Reilly's law of retail gravitation [70, 77, 78] (furthermore, a mathematical demonstration of Reilly’s law can be found in the 2002 PhD thesis; see p.176 in [2]), and then describe the three above-mentioned health models (based on a gravitational law) applied to the French territory.
Newton’s law of universal gravitation and Reilly’s law of retail gravitation.
By analogy with the laws of physics, Reilly adapted Newton's law of universal gravitation (i.e. gravitational force is proportional to the product of two interacting masses, and inversely proportional to the square of the distance between them; described by Eq. 1 below) (see p. 175 in [2]) and applied it to the analysis of retail trade flows (Eq. 2 below, adapted for hospitals) [70, 77].
𝑀𝑖𝑗= 𝑃𝑖𝑃𝑗 (𝑑𝑖,𝑗)−2 (1)
where 𝑖, 𝑗 are representative indices of two bodies i and j, 𝑀𝑖,𝑗 is the interaction between the bodies i
and j, 𝑃𝑖𝑃𝑗 are the bodies’ masses, and 𝑑𝑖,𝑗 is the distance between them.
𝑑𝑖 𝑥 = 𝑑𝑖,𝑗 (1+√𝑀𝑗 𝑀𝑖 )
(2)
1 2 3 4 5 6 7 8 9 10 11 12 13 14 15 16 17 18 19 20 21 22 23 24 25 26 27 28 29 30 31 32 33 34 35 36 37 38 39 40 41 42 43 44 45 46 47 48 49 50 51 52 53 54 55 56 57 58 59 60where 𝑑𝑖 𝑥 is the “point of equal attraction” (also referred to as the “balance point") between two
hospitals, 𝑖, 𝑗 are representative indices of hospitals i and j, 𝑑𝑖,𝑗 is the Euclidean distance between the two
hospitals, and 𝑀 is the hospital’s mass (represented by the number of hospital beds) at 𝑖 𝑜𝑟 𝑗.
Reilly’s law of retail gravitation: health planning applications in France.
A first model based on Reilly’s law was applied in the former Nord-Pas-de-Calais region of northern France (Vigneron, 1994 p. 173 in [2]) [84]. The model initially used data on activity in the region’s médecine, chirurgie, obstétrique (MCO, medicine, surgery and obstetrics) departments, as recorded in the French national hospital discharge database (programme de médicalisation des systèmes d’information, PMSI) for 1992 [85, 15]. The main objective of this project was to develop a new method for defining and updating the regional’s healthcare organization.
A second gravitational model was applied in the former Languedoc-Roussillon region [84] of southern France, with the objective of defining catchment area maps in a statistical correspondence analysis for all MCO specialties. However, this model of a mountainous region did not include the following factors: relief, infrastructure, and isochronous distance (travel times) [83].
The third gravitational model was implemented in the 2002 PhD thesis;in contrast to the first two models, it used a weighted version of Reilly’s law. The project had three main objectives: (i) to calculate the so-called “proximity catchment areas” for peripheral hospitals (other than university medical centers and similar establishments), (ii) to calculate catchment areas by medical specialty, rather than for pooled specialties, and (iii) to be applicable to both geographical areas with relief and those where the use of Euclidean distance is justified (i.e. on plains or on plateau areas with an average altitude of 200 m) see p. 32 in [83]. The version of Reilly's equation used the usual definitions of mass (the number of beds) and distance (Euclidean distance) but was modified by the adding of weighting from calculated populations using either a relative neighborhood graph (RNG) or a K-means algorithm (see p. 118-132 in [2]). This refined the model by better defining the area close to the hospital (i.e. the concept of “proximity” to the hospital) see p. 11, 301 in [2] and p. 5-16 in the supplementary data in [86]. Firstly, the refined model is mathematically robust, as demonstrated in phase one of the cartographic observation of real, database-based hospital catchment areas (see section 2.1.2). Secondly, the weighting coefficient took account of other factors, including both in-hospital variables and external environmental, health-related and social variables. The equations for
1 2 3 4 5 6 7 8 9 10 11 12 13 14 15 16 17 18 19 20 21 22 23 24 25 26 27 28 29 30 31 32 33 34 35 36 37 38 39 40 41 42 43 44 45 46 47 48 49 50 51 52 53 54 55 56 57 58 59 60
weighted populations (observed and theoretical) are given in section 2 (“Methods: optimization of the algorithm”).
Lastly, in the PhD 2002 thesis, our geographical research on hospital systems was based on an analysis of spatial practices by patients in the former Nord-Pas-de-Calais region of northern France (which is relatively poor, with a high unemployment rate and a relatively young population of around 4 million inhabitants [15, 84]), and on the development of a reference model of the target organizational structure [71]. This enhanced, prospective model was applied to blood cancer cases and total hip replacements. The scenarios simulated hospital creations, closures, and reorganizations. The resulting tool was semi-automated (human expertise was still needed) and was coded in MATLAB® [87, 86] (see p. 350, 354, 397, 410 in [2] and see section 2.1.3). Our four-step modelling process was developed and validated in the context of a research project on the planning of hospital activities. In the following section, we explain certain details of the modelling equations and then present the optimized model.
2. Methods: optimization of the algorithm
2.1.
An enhanced version of Reilly’s law of retail gravitation
2.1.1.
The problem and the hypothesis
Tools and processes for modelling hospital attraction have major value for healthcare planners; the impacts of a given project can therefore be analyzed prospectively. The objective of the 2002 PhD project (entitled “Geography of spatial utilization of the health services: a Newtonian modeling of hospital catchment areas”) was to design and build an efficient tool for the observation, simulation and prediction of hospital catchment areas in various medical fields. The study covered the former Nord-Pas-de-Calais region of France (comprising four million inhabitants) [15, 84] and was fed with data on oncology/hematology and traumatology-orthopedics care from the PMSI database [85]. Our geographical and mathematical model was based on the proven hypothesis: “use of healthcare is linked to the distance in km or in time”. This
"principle of least effort" was expected to hold for peripheral/general hospitals (i.e. hospitals that are not university medical centers).
2.1.2.
A four-phase model-building process
We developed a four-phase process for the spatial modelling of health services use (see p.149,172, 180 in [2] and the supplementary data in [86]). Phase one was a descriptive geographic study based on the catchment
1 2 3 4 5 6 7 8 9 10 11 12 13 14 15 16 17 18 19 20 21 22 23 24 25 26 27 28 29 30 31 32 33 34 35 36 37 38 39 40 41 42 43 44 45 46 47 48 49 50 51 52 53 54 55 56 57 58 59 60
area observed for patients with blood cancer and patients having undergone total hip replacement. After the starting hypothesis had been confirmed (see p.152 in [2]), phase two involved the implementation of a refined version of Reilly's law of retail gravitation. We used the usual weight parameter (i.e. the number of beds) and then added parameters based on the size of the calculated population in the study territory by using an RNG or K-means algorithm. In phase three, we compared the observed situations with those predicted in phase two by the theoretical model. This comparison was based on cartography and calculation of the coefficient of attraction (CoA). Phase four was dedicated to the spatial prediction of the catchment area by simulating reorganizational scenarios in which health services were opened, closed or aggregated (see the supplementary data in [86] and also p.195 in [2]).
Ultimately, the results of the comparison and simulation steps showed that our refined model was robust, reliable, and predictive. It provided us with better knowledge of the spatial use of specialist health services/hubs (e.g. blood cancer in the city of Calais and total hip replacement in the town of Hazebrouck) (see the supplementary data in [86] and also p.248-249, 402 in [2]).
2.1.3.
Details of the modelling process in phase two
In phase one, the modelling process revealed the hospitals’ real catchment areas, and the law of least effort was confirmed for non-university medical centers. In phase two, an enhanced (weighted) version of Reilly’s law of retail gravitation was built to model the expected attraction (Eq. 3) and the observed attraction (Eq. 4).
𝑑 (𝐻
𝑖, 𝑏
𝑒(𝑖,𝑗))
=
𝑑(𝐻𝑖, 𝐻𝑗(𝑥,𝑦)) 1+√𝑀𝑗∗P𝑒𝑗 𝑀𝑖 ∗P𝑒𝑖 (3)where 𝑑 (𝐻𝑖, 𝑏𝑒(𝑖,𝑗)) is the distance to the hospital 𝐻𝑖 at the point of equal attraction 𝑏𝑒(𝑖,𝑗), 𝑀𝑗, 𝑀𝑖
are the hospitals’ masses (i.e. the number of beds) and P𝑒𝑖 is the population of 𝐻𝑖 estimated using the RNG or
a K-means algorithm.
𝑑 (𝐻
𝑖, 𝑏
𝑜(𝑖,𝑗))
=
𝑑(𝐻𝑖, 𝐻𝑗(𝑥,𝑦))1+√𝑀𝑗∗P𝑜𝑗
𝑀𝑖 ∗P𝑜𝑖
(4)
A variant for the observed model involves P𝑜𝑖, the population of 𝐻𝑖 based on the observed
catchment areas for 𝐻𝑖, 𝐻𝑗 (by postal code areas in the PMSI database).
1 2 3 4 5 6 7 8 9 10 11 12 13 14 15 16 17 18 19 20 21 22 23 24 25 26 27 28 29 30 31 32 33 34 35 36 37 38 39 40 41 42 43 44 45 46 47 48 49 50 51 52 53 54 55 56 57 58 59 60
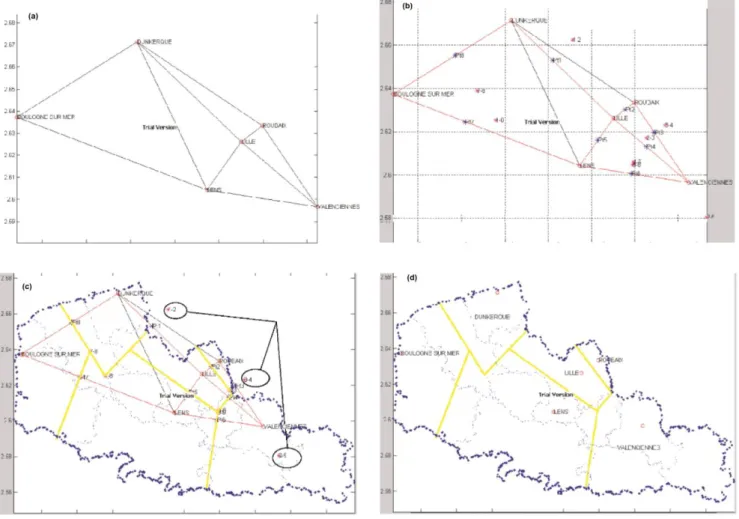
The algorithm was semi-automated (see p. 352 in [2]), and thus still required human expertise to calculate the expected catchment areas with different variants, as shown in Fig. 1 [87], (see p. 342-343, 347, and 359 in [2]). An online link to the demonstration model for expected catchment areas is available [88].
Fig. 1 An enhanced version of Reilly’s law of retail gravitation, with weighting applied to the
oncology/hematology activity in the former Nord-Pas-de-Calais region of France: (a) Delaunay triangulation (DT) of ten black segments and six hospital hubs; (b) a Gabriel graph showing eight red segments, balance points (in blue), and intersection points (in pink); (c) a plot of the perpendiculars (in yellow) and the expert assessment for three intersection points inside circles; (d) the estimated catchment areas (in yellow), P𝑒𝑖: K-means, six hospital hubs and seven hospital services
1 2 3 4 5 6 7 8 9 10 11 12 13 14 15 16 17 18 19 20 21 22 23 24 25 26 27 28 29 30 31 32 33 34 35 36 37 38 39 40 41 42 43 44 45 46 47 48 49 50 51 52 53 54 55 56 57 58 59 60
2.2.
Optimization of the algorithm, and automation based on the
dominance rule
In the present study, we fully optimized and automated the algorithm (Fig. 1 part c). These features were mainly based on a heuristic method4 [89]: the dominance rule [90].
2.2.1.
The dominance rule: step-by-step implementation
In step a depicted in Fig. 2, an Euclidean space [63] (in black) is defined; it includes a triangle (points A, B, and C, connected by red segments). Step b, contains all the blue perpendiculars and their intersections. Each plotted perpendicular divides the delimited space into two parts, and all the perpendiculars thus define the polygons. The red segments are not considered in the definition of polygons. Step c results in six differently colored polygons. In step d, the dominance ratio is calculated for the yellow polygon and the perpendiculars one to three. For perpendicular one, the A/B ratio means that A prevails over B because point A is on the same side as the yellow polygon, and so on. For the yellow polygon, one of the three ratios is finally selected as the most “dominant” one - i.e. the one that is not dominated by any other point. The process then
continues iteratively for the other five colored polygons seen in step c. In step e, either no one point dominates the others or several dominant points are selected: the fuchsia polygon in question will be assigned to the nearest point or the heaviest point. Lastly, the set of polygons assigned to a point will be merged into a single polygon to represent the point’s (i.e. hub’s) catchment area.
Fig. 2 Demonstration of the dominance rule, in five steps: (a) A Euclidean space (in black) includes a
triangle, with three points A, B, C and three red segments (lines between two points); (b) each perpendicular (in blue) divides the space into two parts; (c) six differently colored polygons are obtained; (d) the
dominance ratios for the yellow polygon: A/B (i.e. A prevails over B) perpendicular one, A/C
4A heuristic method is a problem-solving method that is not based on a formal model and does not necessarily lead to a
solution; it proceeds through successive evaluations and provisional hypotheses.
1 2 3 4 5 6 7 8 9 10 11 12 13 14 15 16 17 18 19 20 21 22 23 24 25 26 27 28 29 30 31 32 33 34 35 36 37 38 39 40 41 42 43 44 45 46 47 48 49 50 51 52 53 54 55 56 57 58 59 60
perpendicular three, C/B perpendicular two; (e) the dominance ratios for the fuchsia polygon: A/B perpendicular one, B/C perpendicular two, and C/A perpendicular three, resulting in a closed (endless) cycle: A/B/C/A
2.2.2.
The dominance rule: application at the regional and national levels
The optimized algorithm was automated in the following way:1. Only Delaunay triangulation (DT) is used [2, 91, 92] (see Fig. 3 part a).
2. A new function places the coordinates of the point of equal attraction (i.e. the balance points in Fig. 3) inside a matrix that maintains the "right order": i.e. the sequence in which the points of equal attraction are linked together and create the "right” polygon around a hospital “hub”.
3. The weighting (P𝑒𝑖: the territory’s population) is based on a nearest-neighbors algorithm (a
hierarchical, supervised learning algorithm) instead of a K-means algorithm (a non-hierarchical, unsupervised learning algorithm) [93].
4. In order to be able to apply our optimized algorithm at the national level (i.e. more broadly than the regional level), the studied territory is divided into two parts. The first part is an incomplete geometric proximity area referred to here as the “obvious area” (shown in purple around each hospital hub in Fig. 4). The second part corresponds to all the areas other than the purple obvious area, referred to as the “reduced area” (in gray, see Fig. 4 part c).
5. The dominance rule is used only on the reduced area (in gray in Fig. 4 part c) derived from calculation of the “obvious area” (in purple in Fig. 4 part a), in order to obtain all the final catchment areas attributed to each hospital hub (in Fig. 5 part d).
6. A dominance database is created for each of the 576 polygons (Fig. 3). It includes as many pairs of hospital hubs (points) as there are perpendiculars (46, see Fig. 3). The non-dominant hubs (referred to as wells), will be removed until the dominant hub is obtained for each polygon studied (1 to n). For a specific polygon with a cycle such as “A/B/C/A” (i.e. an endless loop, as in Fig. 2, step e), another dominance criterion must be used to allocate the said polygon to the "closest" or the "heaviest" hospital hub.
1 2 3 4 5 6 7 8 9 10 11 12 13 14 15 16 17 18 19 20 21 22 23 24 25 26 27 28 29 30 31 32 33 34 35 36 37 38 39 40 41 42 43 44 45 46 47 48 49 50 51 52 53 54 55 56 57 58 59 60
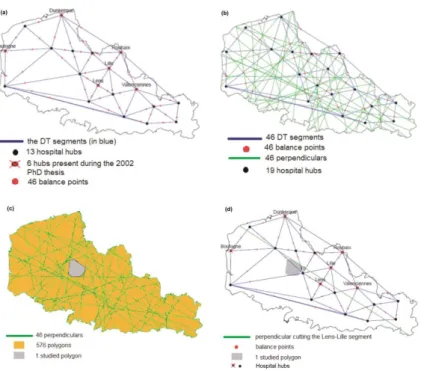
Fig. 3 The dominance rule, as applied in four steps: (a) the former Nord-Pas-de-Calais region, containing 46
DT segments (in blue); (b) 46 perpendiculars divide up the space (in green); (c) 576 resulting polygons (orange and gray); (d) a graphical dominance ratio for the gray polygon and the plotted perpendicular on the “Lens-Lille” segment: the Lens hub prevails over Lille hub. This polygon will have 46 dominance ratios (balance point numbers)
2.2.3.
The obvious areas, the reduced area, and the dominance rules for the
catchment area map
As shown in Fig. 4 step a, the gray polygons represent the real geometric shape and the unrefined hospital catchment areas. In Fig. 4 step b, the gray polygons are transected by perpendiculars (in green); only the “internal” parts (representing the obvious areas (in purple) are kept; the remaining polygons are “gray residues” or the polygons that are not inside the unrefined hospital catchment areas (in white). In Fig. 4 step c, the reduced area (in gray) is obtained by pooling all the gray and white polygons.
1 2 3 4 5 6 7 8 9 10 11 12 13 14 15 16 17 18 19 20 21 22 23 24 25 26 27 28 29 30 31 32 33 34 35 36 37 38 39 40 41 42 43 44 45 46 47 48 49 50 51 52 53 54 55 56 57 58 59 60
Fig. 4 Obvious areas, in three steps: (a) the real geometric shape/unrefined hospital catchment areas (in
gray); (b) the “obvious areas” (an incomplete geometric proximity area, in purple), e.g. the polygon indicated by an arrow; (c) the reduced area (in gray) formed by pooling all the gray and white polygons from step b
Below, Fig. 5 step d shows the expected catchment area map with “unrefined boundary” polygons of different colors. It is important to note that the set of symbols used for hospital catchment areas on all output maps is selected automatically by the PoleSat program running in R, without taking account of cartographic semiology rules. Furthermore, a randomly numbered circle (a non-administrative ID number) is assigned to each hospital hub or group of hospital hubs (defined as a referring hub).
It should also be noted that in Fig. 5 the results were validated by graphically (i) checking the contiguous shapes of the observed catchment area around the single hospital hub (steps e, f) and (ii) comparing the expected catchment area map with an “unrefined boundary” (step d) and observed catchment areas (steps e, f) using an additional anonymous database of oncology/hematology patients in the former Nord-Pas-de-Calais region. These checks were performed with a Shiny® application and several R packages (shiny, maptools, rgdal, sp, rsconnect, rlang and data.table) [94]; it should be noted that in the Shiny® interface [94], Fig. 5 steps e and f can be generated by selecting the following parameters: “public”, “CH de Dunkerque”, and the three highest percentage classes (30-50, 50-75, and 75-100), in order to better observe the contiguous areas for each hub.
Fig. 5 Step d: the expected catchment area map; steps e and f: the graphical validation steps
1 2 3 4 5 6 7 8 9 10 11 12 13 14 15 16 17 18 19 20 21 22 23 24 25 26 27 28 29 30 31 32 33 34 35 36 37 38 39 40 41 42 43 44 45 46 47 48 49 50 51 52 53 54 55 56 57 58 59 60
3. Methods: GUI settings and the optimized algorithm
3.1.
The reduced area and the steps prior to application of a
dominance rule (P6, P7)
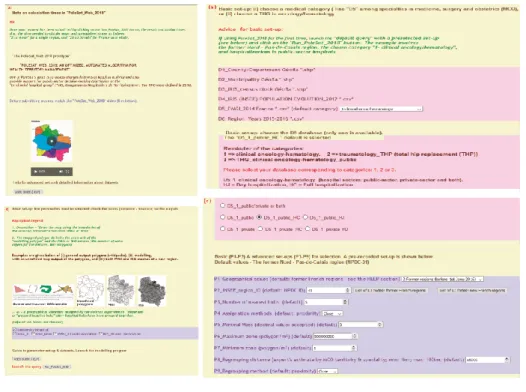
Before the dominance rule is applied to the resulting reduced area (in gray), it can be seen that some gray polygons in Fig. 4 step c have a very large surface area. In such a case, the area is divided into sixteen parts. These parts would be poorly assigned if the GUI’s default setting value, “500,000,000 m²” (P6) is used (Fig. 6); the GUI is accessible. URL: https://thymine.univ-lille2.fr/polesat2018/; username: demo3; password: polesat4. Hence, small, insignificant polygons are deleted to avoid errors; the default parameter value is “1 m²” (P7). The resulting polygons are now relatively small.
Fig. 6 GUI part a (top left), GUI part b (top right), GUI part c (bottom right), and GUI part d (bottom left);
the GUI’s URL: https://thymine.univ-lille2.fr/polesat2018/; username: demo3; password: polesat4
3.2.
The reduced area and application of the dominance rule in
three parts
Part one - Selection of the hubs nearest to each polygon to be closed inFig. 4 step c; by default the parameter is set to 5 (P3). Part two - Creation of a B-box (a rectangle containing a set of points) from the five nearest hubs and each delimited “obvious area” (in purple) in Fig. 4 step b and step c. Part three -
1 2 3 4 5 6 7 8 9 10 11 12 13 14 15 16 17 18 19 20 21 22 23 24 25 26 27 28 29 30 31 32 33 34 35 36 37 38 39 40 41 42 43 44 45 46 47 48 49 50 51 52 53 54 55 56 57 58 59 60
Application of the dominance rule using the proximity option (presented as “Close”, the default option in the GUI) or the weight option (presented as “Heavy”) (P4, P9; see section 3.3). Each polygon (resulting from application of the dominance rule to the reduced area in gray) in the B-box will be attributed to a hospital hub (the same hub or different hubs). The B-box is reiterated for each polygon. Once the dominance rule has been fully applied, the dominant hub receives all its attributed polygons.
3.3.
The iterative grouping processes (P4, P9)
3.3.1.
Grouping by proximity: “Close”
The closest hospital hub couples are selected (i.e. with a distance below the value set in the model) and merged. The hospital hub with the greatest weight is retained, and the hospitals’ geographic coordinates are averaged.
3.3.2.
Grouping by weight: “Heavy”
In order to find the “heaviest” hubs, the hubs are ranked in decreasing order of weight. Once the heaviest hub has been determined, it is merged with other hubs or single hospitals located within a defined distance radius. The names and coordinates of the heaviest hubs and single hospitals are recorded.
3.4.
The optimized algorithm’s graphical workflow
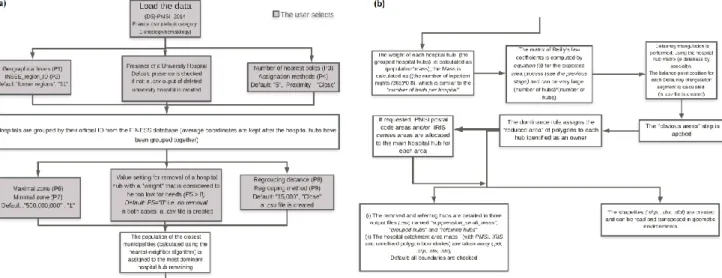
A summary workflow in several hierarchical steps is given in Fig. 7. As a consequence, modification of the GUI’s default and advanced settings in PoleSat_2018 allows users/experts to model hospital catchment areas by calling its algorithm.
Fig. 7 A detailed graphical workflow for the optimized algorithm, linked to the GUI’s settings
1 2 3 4 5 6 7 8 9 10 11 12 13 14 15 16 17 18 19 20 21 22 23 24 25 26 27 28 29 30 31 32 33 34 35 36 37 38 39 40 41 42 43 44 45 46 47 48 49 50 51 52 53 54 55 56 57 58 59 60
Also see for more details Figs. 6 in section 3.1; sections 5.2.1 and 5.2.2, the PoleSat_2018 user guide in [95], and the supplementary file “Online Resource 1”.
4. Materials - databases
4.1.
Medical and geographic databases
4.1.1.
The databases used by PoleSat_2018
The demonstration version of PoleSat_2018 requires several national databases, most of which are derived from (i) the 2014 PMSI database [85, 96], which corresponds to an anonymized summary of aggregate hospital activity (i.e. hospital stays) based on two medical specialties: traumatology/orthopedics (which includes total hip replacement) and oncology/hematology (which includes blood cancer); and (ii) the fichier national des etablissements sanitaires et sociaux (FINESS, a database of geographic identifiers for health establishments) [97], from which the establishment’s geographic location was retrieved.
The GUI’s default request covers 8,711 hospital stays for only one region [44, 84] (according to the “D5_1_public_HC” sub-dataset of full hospitalization in oncology/hematology). The user can only select the PMSI databases and sub-datasets (private, public coupled to full or day hospitalization) and
administrative correspondence tables but cannot see or download the PMSI databases; further descriptions are given inside the GUI (see Fig. 6) and its reference data [95, 98].
The input PMSI file structure inside the GUI contains the following variables of relevance: the hospital’s geographic identifier, the hospital’s official ID, the type of hospital stay, an anonymous output summary number, the number of nights in hospital, the hospital’s official name, the code for the French region prior to the reorganization, the county code, the hospital category label and ID, the FINESS cartographic coordinates, and the code for the French region after to the regions’ reorganization.
4.1.2.
The database related to the validation step
A more detailed PMSI database was used during optimization to validate phase one (Fig. 5). This covered the real spatial movements of patients attracted by each hospital hub at the PMSI-aggregated geographical level; hence, it is not considered to be an anonymous database; that why it is not included in PoleSat_2018 (server) and cannot be accessed through the Shiny® online demonstration of the validation step [94].
1 2 3 4 5 6 7 8 9 10 11 12 13 14 15 16 17 18 19 20 21 22 23 24 25 26 27 28 29 30 31 32 33 34 35 36 37 38 39 40 41 42 43 44 45 46 47 48 49 50 51 52 53 54 55 56 57 58 59 60
5. Results
Below, we first present the GUI and then show the modelling results in oncology/hematology for (i) a “default simulation” (basic modelling) process and (ii) an “advanced second-order simulations” modelling process for the former Nord-Pas-de-Calais region [84].
5.1.
The GUI’s features (PoleSat_2018)
The GUI in Fig. 6 was designed for both basic users and advanced users. Basic users are shown a video before they submit the default query with preset parameters. For advanced users, set-up assistance is included in the GUI’s help file, and so the settings can be fine-tuned to reflect the expert users’ needs and their knowledge of territorial planning issues (see section 3.4) [95, 99].
5.1.1.
The GUI’s main features
(i) A method for geometric and geographic analysis, (ii) modelling of hospital hub catchment areas with regard to hospital hub aggregations/closures (by medical specialty), (iii) several geographic levels, including former and new French regions, GHTs/THGs [44, 84], and the whole of France, (iv) short processing times for French regions (including analyses at the GHT/THG level) and longer processing times for France as a whole (less than an hour), (v) immediate access to individual results: unrefined maps, maps showing PMSI boundaries or ilots regroupés pour l'information statistique (IRIS) census area boundaries, numerical results, and the output result files at the end of the computation process (in a .zip file).
5.2.
Simulations
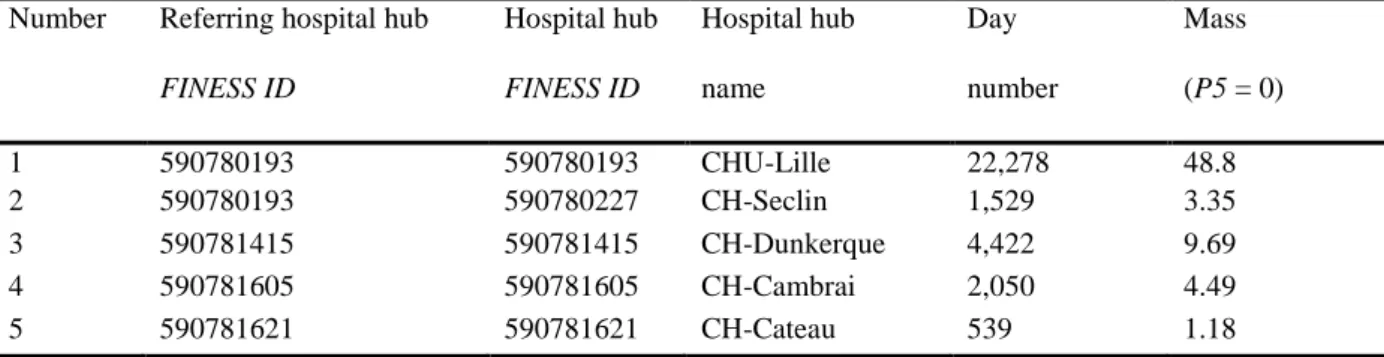
5.2.1. The default simulation (basic modelling): hospital groupings
The default simulation process (basic modelling) is shown in Fig. 8 and Table 1; it includes 28 hospital supply hubs, a grouping of eight hospital hubs (by assignation to referring hospital hubs), and a final number of twenty referring hubs. The output maps were displayed with "PMSI" and "IRIS" map boundaries. The main GUI settings are: P1: former regions; P2: 31 (the region code given by the Institut national de la statistique et des études économiques (INSEE, the French national institute of statistics and economic studies); P5: 0; P8: 15 km, with vs. without one or more university medical centers.
1 2 3 4 5 6 7 8 9 10 11 12 13 14 15 16 17 18 19 20 21 22 23 24 25 26 27 28 29 30 31 32 33 34 35 36 37 38 39 40 41 42 43 44 45 46 47 48 49 50 51 52 53 54 55 56 57 58 59 60
Fig. 8 The default simulation (basic modelling) process with hospital hub groupings (left (a) panel: the
unrefined map; right (b) panel: the revised map with IRIS census area boundaries in black); the GUI settings are: P1: former French regions, P2: 31, P5: 0, P8: 15 km, with the presence of one or more university medical centers
Table 1 Assignation of Seclin General Hospital to the Lille University Medical Center grouping (region ID
=31), in an extract of the default simulation (basic modelling) process (a grouping of eight single or grouped hospital hubs)
5.2.2.
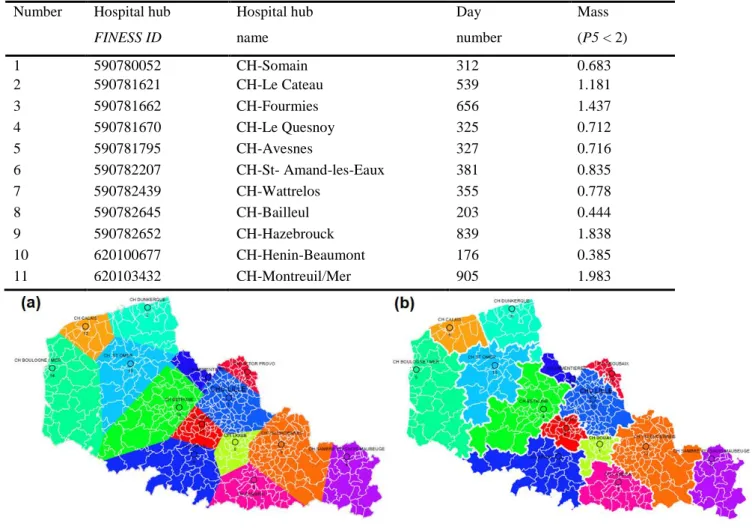
The advanced second-order simulations: hospital removals and
groupings
The advanced second-order simulations in Fig. 9 and Table 2 (comprising 28 hospital supply hubs) is based on the first part of the process (the removal of 11 hospital hubs with a mass < 2) and the second part of the process (the grouping of three remaining hospital hubs within a radius of 15 km into 14 final single hubs or grouped hospital hubs). The output maps are displayed with PMSI and IRIS map limits. The main GUI settings are: P1: former French regions; P2: 31; P5: 2 (i.e. select hubs with mass < 2); P8: 15 km, with vs. without one or more university medical centers.
Number Referring hospital hub FINESS ID Hospital hub FINESS ID Hospital hub name Day number Mass (P5 = 0) 1 590780193 590780193 CHU-Lille 22,278 48.8 2 590780193 590780227 CH-Seclin 1,529 3.35 3 590781415 590781415 CH-Dunkerque 4,422 9.69 4 590781605 590781605 CH-Cambrai 2,050 4.49 5 590781621 590781621 CH-Cateau 539 1.18 1 2 3 4 5 6 7 8 9 10 11 12 13 14 15 16 17 18 19 20 21 22 23 24 25 26 27 28 29 30 31 32 33 34 35 36 37 38 39 40 41 42 43 44 45 46 47 48 49 50 51 52 53 54 55 56 57 58 59 60
Table 2 The removal of eleven hospital single hubs in the advanced second-order simulations. Region ID
=31, in the first part of the process
Fig. 9 The advanced, second-order simulations (the second part of the process), with the closure and
grouping of hospital hubs (left (a) panel: the unrefined map; right (b) panel: the revised map with PMSI area boundaries in white); GUI settings: P1: former French regions, P2: 31, P5: 2 (i.e. select hubs with mass < 2), P8: 15 km, with the presence of one or more university medical centers
6. Discussion
6.1.
PoleSat_2018’s main outputs
6.1.1.
The resources produced (maps and tables)
The demonstration version’s user-friendly GUI and use of an optimized algorithm with R software (Fig. 6) provide a quasi-instantaneous, strategic visualization for people who are not experts in geomatics (thanks to ready-to-use maps and spreadsheets), in-depth views and analyses as part of a geographic information Number Hospital hub
FINESS ID Hospital hub name Day number Mass (P5 < 2) 1 590780052 CH-Somain 312 0.683 2 590781621 CH-Le Cateau 539 1.181 3 590781662 CH-Fourmies 656 1.437 4 590781670 CH-Le Quesnoy 325 0.712 5 590781795 CH-Avesnes 327 0.716 6 590782207 CH-St- Amand-les-Eaux 381 0.835 7 590782439 CH-Wattrelos 355 0.778 8 590782645 CH-Bailleul 203 0.444 9 590782652 CH-Hazebrouck 839 1.838 10 620100677 CH-Henin-Beaumont 176 0.385 11 620103432 CH-Montreuil/Mer 905 1.983 1 2 3 4 5 6 7 8 9 10 11 12 13 14 15 16 17 18 19 20 21 22 23 24 25 26 27 28 29 30 31 32 33 34 35 36 37 38 39 40 41 42 43 44 45 46 47 48 49 50 51 52 53 54 55 56 57 58 59 60
system (thanks to a .zip file containing other files in a format suitable for use in geomatics), and improved graphical presentations (redrawn, corrected maps and legends). The computation time depends on the geometry of the territory studied, and so may be shorter or longer than that quoted in our results (around 50 minutes for the whole of France).
6.1.2.
Default and advanced simulations
Hospital catchment areas can be simulated by aggregating hospital hubs (the default simulation) or by closing and aggregating hospital hubs (advanced second-order simulations). Launching the default simulation for the former Nord-Pas-de-Calais region produced the maps and spreadsheets for verification and adjustment (see Fig. 8 and Table 1). If the closure of a hospital hub is preferable after the default simulation output values have been checked (as in our “advanced second-order simulations” examples), several hospital hubs will be removed by setting the hospital hub mass P5 to 2 (i.e. the algorithm will remove all hospital hubs with a mass < 2) and requiring the remaining hospital hubs to satisfy the P8 condition (15 km), (i.e. hospital hubs with minimum masses will be grouped together and assigned to referring hubs) see Figs. 6 and 9, and Table 2. Consequently, the closure and/or aggregation of hospital hubs and sectors of activity would only be officially adopted by experts after an in-depth analysis of the objective, detailed, clearly analyzed results (ready-to-use maps and tabular data).
It should be emphasized that the simulation for each chosen medical specialty was performed for the former Nord-Pas-de-Calais region; the resulting polygon shapes and hospital hub catchment area boundaries would be different if the simulation is performed for the new French region (the Hauts-de-France region: see section 5.2) [99, 100].
6.1.3.
Summary
The analytical level must be chosen as a function of the decision-maker’s initial problem and with full knowledge of the background situation: i.e. this knowledge may be based on public health problems, past healthcare planning, and the healthcare establishment’s distribution (health care supply and demand, demographic factors, etc.).
Other results can be obtained easily by changing the settings (the new French regions, the GHTs/THGs, the whole of France or just part of the country, the presence or absence of university medical centers). If no grouping of an initial hospital hub supply situation is required (i.e. "a negative grouping"), P8
1 2 3 4 5 6 7 8 9 10 11 12 13 14 15 16 17 18 19 20 21 22 23 24 25 26 27 28 29 30 31 32 33 34 35 36 37 38 39 40 41 42 43 44 45 46 47 48 49 50 51 52 53 54 55 56 57 58 59 60
is set to the minimum value of 1 km. If a simulation with a "positive grouping" only is required, P8 can be set to 25 km, etc.
These modelling scenarios show that PoleSat_2018 is a flexible modelling tool with to be relevant in several planning topics; consequently, with the help of the ready-to-use outputs (map and table), other simulations of closing or merging hubs (by specialty) can be easily imagined by changing parameters according to the needs of health planners.
6.2.
Optimization of the algorithm
Given that the field of health geography was not well known among hospital-based researchers in France, we have had to stimulate interest PoleSat by highlighting the value of our prospective model for planning. It was not until long after 2002 that the changing context of hospital systems research prompted the uptake and optimization of our model with its full automation (in 2016) and integration into a web-based GUI (in 2018).
6.2.1.
A summary of the algorithm’s novel features and limitations
In the 2002 PhD thesis, the observed patient distances and other statistical indices (see p. 155-171, p. 308-329 in [2]) presented at regional and local levels for oncology/hematology were calculated on an aggregated database coupled with area-patient IDs (see p. 343 in [2]). However, the key idea behind a new prospective tool was modelling the observed hospital catchment area for a given medical specialty and without being dependant on detailed patient data. This is how a novel, four-step, complete modelling process was applied to the former Nord-Pas-de-Calais region with two specialties: blood cancer (an infrequent disease with burdensome treatments) and total hip replacement (a more common but still burdensome orthopedic procedure).
The enhanced version of Reilly’s law of retail gravitation: for a geographer, it was obvious to adapt Reilly’s law by weighting it for the population in the study territory. Consequently, the model is more robust, more reliable, and more predictive. The weighting was easier to calculate with the K-means algorithm than with the RNG and because it was performed with a good level of statistical power on a large number of hospital hubs (those performing total hip replacements) (see p. 407, 423 in [2]).
The comparison in phase three was essential for validating the model, and so our enhanced model served as a prospective, digital, support tool for detecting and explaining other causal factors for hospital attraction when high negative values (<1, such as 0.640) or high positive values (>1, such as 1.304) were found (see p.359 in [2], and p. 17 in the supplementary data in [86]).
1 2 3 4 5 6 7 8 9 10 11 12 13 14 15 16 17 18 19 20 21 22 23 24 25 26 27 28 29 30 31 32 33 34 35 36 37 38 39 40 41 42 43 44 45 46 47 48 49 50 51 52 53 54 55 56 57 58 59 60
Lastly, we validated our model because we observed (i) (in phase one) proximity-based catchment areas for all the peripheral hospital hubs (i.e. all establishments other than university hospitals (see p. 354-361 & p. 389-398 in [2], and see the supplementary data p. 8-16 in [86]), and (ii) we calculated the level of agreement between the calculated and observed models for blood cancer and total hip replacement.
Hospital-based research and public health needs addressed by the new method and model. The research underlying the 2002 PhD thesis took place at a time when very few forward-looking spatial analysis models had been applied to healthcare. Despite greater needs for health data analysis with available,
accessible datasets, digital mapping and spatial analysis were poorly developed in the French hospital sector. In contrast, theoretical models had been applied in many other fields (economics, urban planning, marketing, etc.). At the same time, the French hospital-based researchers wanted to provide healthcare professionals and decision-makers with more effective, scientific tools [45].
The model’s main limitations in 2002. The use of Euclidean distance was initially justified (see p. 67 in [2], [83]) but was not suitable enough for mountainous areas; isochronous distances based on road travel times would have been preferable. Other causal factors - including those related to our border region – could have been considered. The models were semi-automated, and based on MATLAB® [87]; (see section 2.1.3). Due to limited access to databases, the four-step modelling process was only applied to the former Nord-Pas-de-Calais region.
6.2.2.
The optimized algorithm, automation, and the GUI
Advantages and novel features
A new version of PoleSat_2018 has been implemented with the same two medical specialties (for easier comparison with the 2002 PhD thesis [2, 88]) and extended to the French national level.
1. Differences in the equation used in phase two of the process. To completely automate the process, we had to choose one of the two algorithms used to weight the population. Initially, the RNG (rather than K-means algorithms) was chosen as the weighting method, by linking points in a stepwise process.
2. Differences with regard to automation of the modelling process –phase two. The implementation processes. The initial algorithm [87, 88] appeared to be simple but many questions and problems had to be overcome when choosing DT and the algorithm for processing at different geographic levels. Only DT is used in the optimized algorithm; in contrast, a Gabriel graph was used after an initial DT step in the 2002 version (see the demonstration in [88] and p. 113-115 in [2]). This change was made for two reasons.
1 2 3 4 5 6 7 8 9 10 11 12 13 14 15 16 17 18 19 20 21 22 23 24 25 26 27 28 29 30 31 32 33 34 35 36 37 38 39 40 41 42 43 44 45 46 47 48 49 50 51 52 53 54 55 56 57 58 59 60
Firstly, a hospital hub is linked to at least three other hubs. This contrasts with the Gabriel graph [101, 102] in which the hospital hub is sometimes connected to only one other hub (the algorithm needs to determine hospital catchment areas but this is impossible with a single connected hub). Secondly, the presence of fewer interconnected hubs poses a problem for application of the dominance rule. For France, more than 1,000 DT segments and perpendiculars were obtained. With tens of thousands of polygons as a result, the calculation would require too much time and memory. Reducing the space taken into account (using the dominance rule on the reduced areas) was thus unavoidable. Consequently, the “obvious area” method was used to divide up the whole of France without creating artificial boundaries (i.e. regional territories or after division of the space into polygons) that would have made catchment areas obsolete. To this end, it was necessary to check and place the balance points and hospital hub positions in the right order to obtain the right purple polygons Fig. 4, steps a to c. This was made possible by sorting the numbered hubs. An added constraint concerned the inclusion of hospital hubs inside or outside the “obvious area”.
3. The validation step and visual comparison (phases one and three). Firstly, our observations of contiguous shapes around the hub and a visual comparison of the expected and observed catchment areas are acceptable relative to the areas observed in Fig. 5 step d, step e and step f (notably relative to contiguous areas around hubs, as in the contiguous area for Dunkerque Hospital shown inside the circle in Fig. 5 step e) and validated the algorithm. Secondly, and as in the 2002 PhD thesis, some exceptions were found, i.e. where the observed attraction was greater than expected for the proximity (Fig. 5 step f) in specific situations (with a small number of hematologists and a high degree of specialization for certain rare diseases in our region). Consequently, empirical limitations were applied (see p. 218, 413 in [2]), such as threshold values below 10%-15% for the number of hospital stays and below 5% for patients associated with hospital stays (in oncology/hematology services). Our Shiny® application provides a visual check on exceptions: greater attraction than would be expected locally, or attraction in noncontiguous areas (i.e. outside the proximal area) [94].
4. Geography and geometry. The results for non-planar, noncontiguous areas (i.e. areas with mountains and lakes) will requiring careful interpretation in future research, until a specific adaptation can be developed.
5. The GUI. In 2017, a new online, web-based GUI replaced the original Tcl/Tk graphic interface running on a Linux system. PoleSat_2018 now allows experts to easily model hospital catchment areas by calling an algorithm programmed in R. PoleSat_2018’s algorithm enables the easy, rapid computer
1 2 3 4 5 6 7 8 9 10 11 12 13 14 15 16 17 18 19 20 21 22 23 24 25 26 27 28 29 30 31 32 33 34 35 36 37 38 39 40 41 42 43 44 45 46 47 48 49 50 51 52 53 54 55 56 57 58 59 60
modelling of hospital aggregation and/or closures. On average, health resource planning scenarios are obtained in less than three minutes (for the former Nord-Pas-de-Calais region) or less than 45-50 min (for France as a whole); this provides a quasi-instantaneous, strategic visualization of hospital hub catchment areas.
Limitations
1. Limitations of the algorithm. We did not have enough time to implement the “isochronous
distance” as an alternative to Euclidean distance (justified on p. 32 in [83]start automating phase three, with calculation of the CoA.
2. Limitations of the GUI. Feedback on the demonstration version suggested that it was relatively easy to use with 9 parameters. Hence, the custom version only displays four relevant (P1, P2, P5 and P8) pertinent parameters for specialist users; the other parameters are hidden and are always used in background by the algorithm.
3. Limitations of the databases. The databases were extracted from the 2014 PMSI database [85] (see the Acknowledgments) and filtered, aggregated in order to obtain hospital stay/day datasets for only the two chosen activities per establishment. At this level of aggregation, the data is considered to have been
anonymized; so the dataset can be disseminated and reused in an outside system. However, our data samples did not belong to us; we were not authorized to disseminate them to other people or institutions.
It should be noted that our access to a detailed database (including spatial patient IDs) was limited to the former Nord-Pas-de-Calais region. The implementation of phase one was separate from our main program (running in R), which is related to the current modelling process called by the GUI.
6.3.
Perspectives
The study territory was recently extended from one region to the whole of France; this is likely to broaden the algorithm's applications and enable scientific improvements in the future. Furthermore, the databases have been integrated into the GUI, and public and private databases have been gathered together. Since dissemination of the demonstration version of PoleSat_2018 is managed by the company Altense Consulting, this tool could be directly promoted in the scientific literature or indirectly promoted through usage.
Despite greater restrictions on access to health data in France since 2016 [46, 103, 104] (due to French legislation and the European general data protection regulation (GDPR)), the usage of the custom
1 2 3 4 5 6 7 8 9 10 11 12 13 14 15 16 17 18 19 20 21 22 23 24 25 26 27 28 29 30 31 32 33 34 35 36 37 38 39 40 41 42 43 44 45 46 47 48 49 50 51 52 53 54 55 56 57 58 59 60
version of PoleSat suggests that access to aggregated, anonymous input data will not be a problem for users outside government ministries.
In the near future, tests are likely to be extended to other PMSI domains (MCO, follow-up and rehabilitation care, psychiatry, home care etc.) [44] for longer periods (rather than a single year), and will include other large, embedded, reusable medical datasets.
By using authorized aggregated datasets and specialist knowledge on healthcare issues, scientists will be able to carry out retrospective studies. For example, it will be possible to check whether PoleSat’s algorithm is able to find current hospital catchment areas after hospitals have been opened, closed and/or reorganized in real scenarios.
Lastly, there will be novel opportunities for testing hypotheses in the custom version of PoleSat, which circumvents the PoleSat_2018 GUI's current limitations. In fact, the GUI does not currently include options for creating hospital services/hubs, closing services/hubs or transferring an activity from one service/hub to another. Hence, starting from a given (input) standard database, one creates two additional datasets with values that are modified to simulate (for example) (i) “hub removal” and (ii) “hub removal with transfer” of its activity from one hub to another. Once the modelling results for each scenario have been obtained, they allow new “population and/or hospital activity” indicators to be calculated in PoleSat’s “output.csv” files (in December 2019, a poster on this topic was accepted for the MIE-2020 conference).
The PoleSat algorithm can be generalized to other fields. Developments in engineering science, computer science and medical imaging are under consideration: (i) the integration of PoleSat into a biostatistics, informatics and complex systems platform for assessing the connection count and scalability, and (ii) integration of the observed catchment areas (phase one) and automation of the CoA (phase three). The current structure of the required input files (see section 4.1.1) will ultimately enable the database owner to upload other types of health database (i.e. other than PMSI databases), as confirmed by the French Ministry of Health after an initial test. In other words, addition development will not be performed as part of the PoleSat program because the file structure is appropriate and can be generalized to other types of health database (described in the poster accepted for the MIE-2020 conference).
7. Conclusion
Our main objective has been achieved, since the proposed deterministic, non-probabilistic method [105] (based on obvious areas and application of a dominance rule) enabled complete automation and stabilization
1 2 3 4 5 6 7 8 9 10 11 12 13 14 15 16 17 18 19 20 21 22 23 24 25 26 27 28 29 30 31 32 33 34 35 36 37 38 39 40 41 42 43 44 45 46 47 48 49 50 51 52 53 54 55 56 57 58 59 60