HAL Id: hal-03018722
https://hal-cnrs.archives-ouvertes.fr/hal-03018722
Submitted on 23 Nov 2020
HAL is a multi-disciplinary open access
archive for the deposit and dissemination of sci-entific research documents, whether they are pub-lished or not. The documents may come from teaching and research institutions in France or abroad, or from public or private research centers.
L’archive ouverte pluridisciplinaire HAL, est destinée au dépôt et à la diffusion de documents scientifiques de niveau recherche, publiés ou non, émanant des établissements d’enseignement et de recherche français ou étrangers, des laboratoires publics ou privés.
What is the nature of the reach-and-grasp deficit in
glaucoma?
Xavier Corveleyn, Quentin Lenoble, Jean Francois Rouland, Muriel Boucart
To cite this version:
Xavier Corveleyn, Quentin Lenoble, Jean Francois Rouland, Muriel Boucart. What is the nature of the reach-and-grasp deficit in glaucoma?. Journal of Glaucoma, Lippincott, Williams & Wilkins, 2020, �10.1097/IJG.0000000000001555�. �hal-03018722�
1 Xavier Corveleyn 2 Quentin Lenoble 3 Jean-François Rouland 4 Muriel Boucart 5
What is the nature of the reach-and-grasp deficit in glaucoma? 6
7
1. Université Côte d’Azur, LAPCOS, EA 7278, Nice, France 8
2. MSHS Sud-Est - Maison des Sciences de l’Homme et de la Société Sud-Est 9
3. Univ. Lille, CNRS, CHU Lille, UMR 9193 - SCALab - Sciences Cognitives et 10
Sciences Affectives, F-59000, Lille, France 11
4. Univ. Lille, Inserm, CHU Lille, U1172 - LilNCog - Lille Neuroscience & Cognition, 12
F-59000 Lille, France 13
5. Centre Hospitalier Universitaire de Lille, Hôpital Huriez, service 14
d’ophtalmologie, Lille, France 15 16 17 Figures: 5 18 Tables: 5 19 20 Corresponding Author: 21 xavier.corveleyn@univ-cotedazur.fr 22
Laboratoire d'Anthropologie et de Psychologie Cognitives et Sociales 23
Campus Saint Jean d'Angely / SJA3 / MSHS Sud-Est 24 3, Bd François Mitterrand 25 06357 Nice Cedex 4 26 27 28 29
30
Funding : Société Française du Glaucome, 2015 (SFG) 31
Précis 32
In a reach-and-grasp task, patients with glaucoma exhibited a motor disorder, even when they 33
had time to explore their environment. The motor performance of glaucoma patients should 34
be taken into account in rehabilitation. 35
36
Abstract 37
Purpose: Vision plays an important role in planning and executing manual prehension 38
(reaching and grasping). We assess the impact of glaucoma on motor production, as a 39
function of the visual exploration time available to the patients. 40
Methods: We compared performance in two reach and grasp tasks determined by whether or 41
not the participants (16 glaucoma patients, 14 age-matched and 18 young controls) had time 42
to explore the objects before reaching and grasping a target object defined by its color. 43
Results: Differences were observed between glaucoma patients and age-matched controls on 44
movement duration and peak velocity (reaching phase) only when participants were not 45
provided time to look at the objects before the movement (immediate condition). 46
Conclusions: Glaucoma patients exhibited a motor disorder (grasping phase) only when they 47
had no time to explore their environment before performing the reach-and-grasp task. The 48
motor abnormalities in reaching phase observed in glaucoma patient in previous studies seem 49
to result from difficulties in target identification rather than from visuo-motor deficits. From a 50
clinical point of view, motor performances of glaucoma patients could be modulated by task, 51
especially by temporal constraints of task. 52
53
Key Words 54
Glaucoma ; reach and grasp ; identification ; kinematics ; temporal constraints 55
56
Introduction 57
Glaucoma is an ocular disease that produces irreversible retinal ganglion cell and optic 58
nerve fiber loss.1 Visual deficit in glaucoma starts in the peripheral visual field and progresses 59
towards the center. Most studies of glaucomatous vision loss assess relatively simple aspects 60
of visual processing that are encoded in the retina (e.g. sensitivity to luminance increments as 61
in typical perimetry or flickering gratings as in frequency-doubling technology perimetry), 62
because glaucoma is considered primarily as a retinal ganglion cell disease.2,3 Several studies 63
have reported that advanced glaucoma also leads to difficulties with daily life activities such 64
as driving, fear of falling and reading, and the feeling of a reduced quality of life.4–6 Indeed, 65
both peripheral7,8, and central vision are needed for activities such as reading,9,10 driving, 66
facial recognition,11 reaching for and grasping objects12,13 or accomplishing natural actions.5 67
In the case of motor action, the visual system provides critical information about the location, 68
size, and shape of to-be-grasped objects which is used for planning the action. The activation 69
of the motor command leads to hand acceleration towards the object (the "reach" phase). 70
When approaching the object, the hand decelerates and the grip aperture is adapted to the 71
object’s size (the "grasp" phase). At this phase, vision provides corrective information to 72
improve the grasp.14–18 A visual deficit can disrupt the performance of a voluntary motor 73
action, as shown in previous studies.12,13,19 For instance, some studies have shown 74
impairments in initial movement planning and control in patients with glaucoma20 and in age-75
related macular degeneration,12,13 or in grasping components in patients with amblyopia.21 76
Kotecha et al. (2009) reported atypical kinematic characteristics in patients with glaucoma 77
compared to normally sighted people: slower reaction time, longer overall movement 78
duration, low-velocity phase (suggesting a deficit in the grasping phase). The same results 79
were found when healthy participants performed reach-and-grasp tasks with an artificially 80
reduced visual field: longer overall movement duration, slower maximum velocity and higher 81
maximum grip aperture.7 82
However, research on motor control suggests the existence of inverse models.22,23 83
These inverse models suggest that planning of motor commands requires processing of all 84
relevant sensory information. Once the motor command is executed, the motor action can 85
achieve its objective without visual feedback even if, for control subjects, movements are 86
more accurate and precise when visual feedback is available.24 In line with these models, we 87
hypothesize that increased time to explore a scene may result in decreased difficulty with a 88
motor action for glaucoma patients. In other words, deficits in the motor performance of 89
patients with visual impairment that have been reported in previous studies20 might be due to 90
the fact that they were not given enough time to analyze the environment prior to motor 91
production rather than the result of motor system deficits itself. Indeed, in these studies, 92
participants were presented with the target object at the very moment they had to grasp it, 93
while in daily life, patients have time to look at an object before grasping it. Therefore, 94
laboratory studies mix two components: (1) the effect of central visual impairment on motor 95
production and (2) the effect of visual impairment on the time for perception of the spatial 96
properties of the object (e.g., spatial location, distance and width), leading to a deficit in 97
motor production. This distinction is important. For instance, motor production deficits in 98
patients with age-related macular degeneration (AMD) seem due to visual impairment, not to 99
motor production itself.25 Therefore, patients with AMD just need more time to accomplish 100
their daily life actions26 instead of actual rehabilitation of their motor system production. In 101
the present study, we assess the impact of glaucoma on the two components. The kinematics 102
of the reach-and-grasp motor action was compared in two different conditions: one in which 103
participants saw the object only at the moment they had to grasp it, thus measuring the effect 104
of a deficit in the analysis of the object’s metrics on motor production, (i.e., with temporal 105
constraints for visual exploration); and one in which they had time to observe the object 106
before grasping it, thus measuring the effect of visual impairment on motor production (i.e., 107
with no temporal constraints for visual exploration). We hypothesized that deficits in the 108
kinematic parameters of glaucoma patients should be observed in the task with temporal 109
constraints for visual exploration (immediate condition) rather than in the task with no 110
temporal constraints for visual exploration (delayed condition). Indeed, in the first task, the 111
participant needs to explore the environment quickly in order to initiate the action as soon as 112
possible. Therefore, owing to glaucoma, the visual information is not entirely processed and 113
the visual feedback, in order to adjust his (or her) action, is greater compared to the delayed 114
condition. In the delayed condition, the observation time before grasping the object allows the 115
planning of a motor command and the execution of the motor action at the appropriate 116
moment. Therefore, visual feedback is less important for accomplishing a motor action 117
compared to the immediate condition. We also investigated the relationship between each 118
kinematic parameter and visual acuity to better understand the links between visual acuity of 119
pathology in motor performance. Indeed, kinematic parameters are known to be influenced by 120 visual acuity.12,20,27 121 122 Methods 123 Participants 124
Sixteen patients with primary open angle glaucoma (POAG) were recruited in the 125
ophthalmology department of Claude Huriez Hospital, Lille, France. All participants 126
underwent SITA-standard 30-2 perimetry with a Humphrey Visual Field Analyzer II (HFA, 127
Carl Zeiss Meditec, Dublin, CA, USA), had glaucoma-related visual field (VF) defects and a 128
mean deviation (MD) worse or equal to -6 dB (SITA-standard 30-2: MD = -16.4 ± SD = 5.76; 129
range: 8.6 - 27). They had to have a monocular visual acuity of 6/12 or more in the tested eye 130
(best eye included in the recruitment criteria). If both eyes had equal acuity, one eye was 131
randomly selected. 132
There were 14 volunteers with normal visual acuity among the age-matched 133
participants. They were either relatives of participants with glaucoma or patients who had 134
undergone successful cataract surgery, with normal visual acuity ranging from 20/25 to 20/20. 135
Age-matched participants were recruited in the ophthalmology department of Claude Huriez 136
Hospital, Lille, France. Controls were tested monocularly on their preferred eye. A young 137
adult group included 18 healthy students (in medicine, neuroscience and psychology) with 138
normal vision (visual acuity = 20/20). Young people were included as controls to dissociate 139
the effect of ageing from the effect of pathology. All participants had one eye patched (the eye 140
with lower acuity for patients). Demographic data are provided in Table 1. Clinical data are 141
provided in Table 2. 142
143
/ Insert table 1 here /
144
/ Insert table 2 here /
145 146
A mini-mental state examination (MMSE)28 was administered to the older 147
participants. Participants with a history of neurological disease, psychiatric disease, cognitive 148
impairment (MMSE < 25/30) or other ocular diseases (cataract, AMD) that might 149
compromise oculomotor function were excluded. A physical therapist tested the participants 150
for normal motion of the right arm and hand. All participants were right-handed. The study 151
was approved by the ethics committee of Lille University. In accordance with the tenets of the 152
Declaration of Helsinki, written informed consent was obtained from all participants. 153
Apparatus and material
155
Participants sat in front of a table (120x80 cm) and placed their thumb and index close 156
to a starting point located 10 cm from the edge of the table (see Figure 1). Five cylinders 157
(height: 10.5 cm, diameter: 5.5 cm) located on the table in a semi-circle (radius: 25 cm from 158
the starting point) at 0° (center), 30° and 60° to the left and the right of the center cylinder 159
were used as stimuli. The participants’ head was positioned 60 cm from the central cylinder. 160
All cylinders positioned on the table were the same color (wood color). Before each trial, they 161
were (re)positioned in these five precise locations by the experimenter. In front of the table, a 162
curved screen (180° degrees of eccentricity) displayed the different steps of each trial 163
(fixation cross, five colored cylinders at five spatial locations, Figure 1). Participants 164
performed two tasks in a random order: one with a temporal constraint for visual exploration 165
(immediate condition) and one with no temporal constraint for visual exploration (delayed 166
condition). Each condition involved 25 trials determined by five colors (blue; red; yellow; 167
white; black) * five spatial locations (60° right; 30° right; 0°; 30° left; 60° left). A schematic 168
representation of both tasks is shown in Figure 2. Before the experiment, each color cylinder 169
was displayed and the participants had to recognize each color. All participants were able to 170
name the colors of the five cylinders. 171
172
/Insert figure 1 here /
173 174
/Insert figure 2 here /
175 176
In the task with a temporal constraint for visual exploration (immediate condition), 177
participants placed their thumb and index on the starting point and looked at the fixation cross 178
displayed on the curved screen. Simultaneously, the name of a color was given by a 179
loudspeaker 2000 ms +/- 500 ms and five colored cylinders were displayed on the curved 180
screen in five different spatial locations (0° center, 30° left and right and 60° left and right). 181
The colored cylinders and the spatial locations on the screen were changed randomly between 182
participants and trials. Participants explored the displayed colored cylinders. As soon as they 183
recognized the spatial location of the given color, the participants were instructed to reach and 184
grasp as quickly and accurately as possible the cylinder on the table with the corresponding 185
color. They were asked to lift it approximately 10 cm, put it on the table and return to the 186
starting point. 187
188
In the task with no temporal constraint for visual exploration (delayed condition), the 189
same procedure was used, except that participants were not to reach and grasp the cylinder as 190
soon as they recognized the target color but only after an auditory cue. Participants placed 191
their thumb and index on the starting point and then fixated the cross displayed on the curved 192
screen. Simultaneously, a color was given by a loudspeaker 2000 ms +/- 500 ms and colored 193
cylinders were displayed on the curved screen in five spatial locations (0°, 30° left and right 194
and 60° left and right). The colored cylinders and spatial locations on the screen were changed 195
randomly between participants and trials. Participants explored the displayed colored 196
cylinders. Unlike in the immediate condition, participants had to wait for an auditory cue to 197
reach and grasp the cylinder corresponding to the given color as quickly and accurately as 198
possible. This cue occurred 2000 ms +/- 500 ms after the color was given. The time between 199
the color name and the auditory cue allowed the exploration of the displayed cylinders. In this 200
condition, the participants had time to identify the target cylinder and to prepare their reach-201
and-grasp movement. As soon as they heard the auditory cue, they had to reach and grasp the 202
cylinder as quickly and accurately as possible, lift it approximately 10 cm, put it on the table 203
and return to the starting point. 204
205
Data Recording and Analysis 206
A magnetic tracking system (Polhemus Liberty 240/8-8 System, Colchester, VT) was 207
used to record the participants’ movements in a X, Y and Z coordinates system. The 208
kinematics of the reach-and-grasp movements and cylinder displacements were measured by 209
eight markers that were placed on the index (base and tip), the thumb (tip), and the wrist 210
(scaphoid and pisiform) of the participants. One additional marker was placed on each of the 211
five cylinders. The spatial environment (table and cylinder) was calibrated before each 212
session, allowing the system to reach a temporal and spatial resolution accuracy lower than 213
0.2 mm at a 240 Hz sampling rate. 214
All parameters were computed with a custom program (MatLab®; MathWorks®, 215
Natick) based on the 3D coordinates of the reflective marker placed on the wrist, index and 216
thumb of the participants and on the five markers on the cylinders. The kinematic outcome 217
measures were computed on the basis of the wrist marker. Temporal and kinematic 218
parameters of the (x, y, z) coordinates of the wrist marker were computed from tangential 219
velocity profiles, after filtering the data using a second-order Butterworth dual-pass filter (cut-220
off frequency: 15 Hz). Movement onset was defined as the first velocity value reaching 0.3 221
cm/s. 222
223
The following kinematic parameters of the reach-and-grasp trajectories were 224
calculated (Figure 3): 225
1. "Movement duration" corresponding to the time between movement onset and 226
movement end (defined as the moment when participants reached the cylinder). 227
2. "Peak velocity" corresponding to the maximum velocity reached by the wrist during 228
movement. 229
3. "Acceleration interval" corresponding to the time between the onset of hand 230
movement and the “peak velocity” moment. 231
4. "Deceleration interval" corresponding to the time between “peak velocity” moment 232
and the end of the movement. 233
5. "Maximum grip aperture" (MGA) corresponding to the maximum distance between 234
thumb and index during movement. 235
6. "Time to maximum grip aperture" corresponding to the time between the onset of 236
hand movement and the time of maximum grip aperture. 237
238
/Insert figure 3 here /
239 240
Trials were excluded from the data analysis when a participant responded erroneously. 241
1.6% of the trials, homogenously distributed across the conditions, were discarded. For each 242
task, a 2x3 analysis of variance was conducted with each group {Glaucoma patients; Age-243
matched Controls; Young Controls} as the between-participants factor and angle condition 244
{0°; 30° right; 30° left; 60° right; 60° left} as the within-participants factor. Local 245
comparisons were performed using a post-hoc Bonferroni test with threshold corrections, in 246
order to account for multiple group factor comparisons and possible interactions between 247
Group and Angle. For the sake of clarity, principal effect of angle and post-hoc are not 248
presented because we had no hypothesis on this factor. Spearman correlations for glaucoma 249
patients were computed between each kinematic parameter, visual acuity, MD 30-2 and 250
duration of pathology. Finally, comparisons of the results of the immediate condition vs 251
delayed condition for each glaucoma patient were conducted. Results are presented in Tables 252
3, 4 and 5. 253
Results 255
256
Task with temporal constraints for visual exploration (immediate condition)
257
1. Movement duration
258
A group effect was observed on movement durations (F(2, 45) = 36.5; p < 0.001; 2 =
259
0.6). The movement duration of glaucoma patients (Xmean = 1179 ms; SD = 250 ms) was
260
significantly longer than that of age-matched participants (Xmean = 1001.8 ms; SD = 169.6 ms;
261
p < 0.014) and young participants (Xmean = 680.2 ms; SD = 106.5 ms; p < 0.001). The
262
movement duration of age-matched participants was significantly longer than that of young 263 participants (p < 0.001). 264 265 2. Peak velocity 266
A group effect was observed on peak velocity (F(2, 45) = 11.6; p < 0.001; η²= 0.27).
267
Peak velocity of glaucoma patients (Xmean = 32.4 cm/s; SD = 10.2 cm/s) was significantly
268
faster than peak velocity of age-matched participants (Xmean = 24.4 cm/s; SD = 7.4 cm/s; p =
269
0.002) and young participants (Xmean = 22.8 cm/s; SD = 2.4 cm/s; p < 0.001). No significant
270
difference was found between age-matched and young participants. 271
272
An interaction was found between group and angle on peak velocity (F(8, 180) = 2.17; p
273
= 0.032; η² = 0.016; Figure 4). The Bonferroni post-hoc comparison revealed that peak 274
velocity for glaucoma patients was faster than peak velocity for age-matched participants and 275
young participants, only at 60° eccentricity on the left (respectively p = 0.05 and p = 0.002) 276
and right angles (respectively p = 0.007 and p < 0.001). 277
/ Insert figure 4 here /
279 280
3. Acceleration interval
281
A group effect was observed on the acceleration interval (F(2, 45) = 12.7; p < 0.001; η²=
282
0.27). The acceleration interval of glaucoma patients (Xmean = 358.4 ms; SD = 107 ms; p <
283
0.001) and age-matched participants (Xmean = 378.2 ms; SD = 82.7 ms; p < 0.001) was
284
significantly longer than that of young participants (Xmean = 269.4 ms; SD = 55 ms).
285 286
No interaction was found between group and angle on acceleration intervals. 287
288
4. Deceleration interval
289
A group effect was observed on the deceleration interval (F(2, 45) = 28; p < 0.001; η²=
290
0.52). No difference was observed between glaucoma patients and age-matched participants. 291
The deceleration interval of both glaucoma patients (Xmean = 860.4 ms; SD = 230 ms; p <
292
0.001) and age-matched participants (Xmean = 760.4 ms; SD = 139 ms; p < 0.001) was
293
significantly longer than that of young participants (Xmean = 458.6 ms; SD = 129.8 ms).
294 295
An interaction was found between group and angle on the deceleration interval (F(8, 180)
296
= 4.53; p < 0.001; η²= 0.014). The Bonferroni post-hoc comparison revealed differences for 297
glaucoma patients and age-matched participants in comparison to young participants (p < 298
0.001) for all angles (except young versus age-matched participants for 60° right (p = 0.02) 299
and 60° left (p = 0.003)). 300
5. Maximum grip aperture
302
No group effect was observed on maximum grip aperture. Maximum grip aperture of 303
glaucoma patients (Xmean = 8.96 cm; SD = 1.82 cm) was not significantly different from the
304
maximum grip aperture of age-matched participants (Xmean = 8.88 cm; SD = 1.04 cm) and
305
young participants (Xmean = 9.47 cm; SD = 1.09 cm).
306 307
An interaction was found between group and angle on maximum grip aperture (F(8, 180)
308
= 1.21; p = 0.03; η² = 0.017). The Bonferroni post-hoc comparison revealed a difference 309
between 60° right (Xmean = 8.62 cm; SD = 2.38 cm) and 60° left (Xmean = 9.31 cm; SD = 1.87
310
cm) for glaucoma patients only (p = 0.034). 311
312
6. Time to maximum grip aperture
313
A group effect was observed on time to maximum grip aperture (F(2, 45) = 23.7; p <
314
0.001; η²= 0.42). The time to maximum grip aperture of glaucoma patients (Xmean = 716.4 ms;
315
SD = 191 ms; p < 0.001) and age-matched participants (Xmean = 665.4; SD = 98 cm; p>0.001)
316
was significantly shorter than that of young participants (Xmean = 463.6 cm; SD = 102.1 cm).
317 318
No interaction was found between group and angle on time to maximum grip aperture. 319
320
/ Insert Table 3 here /
321 322
Finally, correlations were found between visual acuity for glaucoma patients and 323
movement duration, deceleration interval and time to MGA (for 60° left condition only), 324
suggesting a link between deficit intensity and deficit of movement kinematic parameters 325
(Table 3 and Figure 5). 326
327
/ Insert Figure 5 here /
328 329
To summarize (Table 4), in the immediate condition, participants with glaucoma had 330
significantly longer movement duration and higher peak velocity than age-matched and young 331
participants. This result indicates an effect of glaucoma on the reaching phase of the 332
movement. Interestingly, peak velocity for glaucoma patients was higher for cylinders located 333
in the peripheral field of vision (60° left and right angle), thus suggesting that the deficit in 334
movement kinematics is related to the visual field deficit. 335
336
/Insert Table 4 here /
337
/Insert Table 5 here /
338 339
Task with no temporal constraints for visual exploration (delayed condition)
340
1. Movement duration
341
A group effect was observed on movement durations (F(2, 45) = 41.4; p < 0.001; 2 =
342
0.63). The movement duration of glaucoma patients (Xmean = 1251.4 ms; SD = 242.2 ms) was
343
significantly longer than that of age-matched participants (Xmean = 1066 ms; SD = 175 ms; p =
344
0.02) and young participants (Xmean = 716 ms; SD = 110.8 ms; p < 0.001). The movement
345
duration of age-matched participants was significantly longer than that of young participants, 346
p < 0.001) 347
An interaction was found between Group and Angle on movement duration (F(8, 180) =
349
2.99; p = 0.004; 2 = 0.006). No significant differences were observed between the movement 350
duration of glaucoma patients and age-matched participants for all angles. The movement 351
duration of glaucoma patients and age-matched participants was significantly longer than that 352
of young participants (p < 0.01 for all angles, except age-matched versus young participants at 353 60° left (p = 0.007)). 354 355 2. Peak velocity 356
A group effect was observed on peak velocity (F(2, 45) = 5.06; p = 0.01; η²= 0.108).
357
Peak velocity of both glaucoma patients (Xmean = 39.2 cm/s; SD = 11.7 cm/s) and age-matched
358
participants (Xmean = 40.1 cm/s; SD = 10.7 cm/s) was significantly faster than that of young
359
participants (Xmean = 32.9 cm/s; SD = 5.3 cm/s; respectively p = 0.05 and p = 0.02).
360 361
No interaction was found between group and angle on peak velocity. 362
363
3. Acceleration interval
364
A group effect was observed on the acceleration interval (F(2, 45) = 6.03; p = 0.005; η²=
365
0.157). The acceleration interval of glaucoma patients (Xmean = 390.8 ms; SD = 100.6 ms; p =
366
0.06 (trend)) and age-matched participants (Xmean = 413 ms; SD = 109.6 ms; p = 0.006) was
367
significantly longer than that of young participants (Xmean = 327 ms; SD = 42.1 ms).
368 369
An interaction was found between group and angle on acceleration intervals (F(8, 180) =
370
3.34; p = 0.001; η² = 0.036). The Bonferroni post-hoc comparison revealed a difference 371
between age-matched and young participants at 30° left angle (p = 0.004). 372
373
4. Deceleration interval
374
A group effect was observed on the deceleration interval (F(2, 45) = 59.2; p < 0.001; η²=
375
0.704). The deceleration interval of glaucoma patients (Xmean = 860.4 ms; SD = 162.8 ms; p <
376
0.001) was longer than that of age-matched participants (Xmean = 651.6 ms; SD = 138 ms; p <
377
0.001) and young participants (Xmean = 389.4 ms; SD = 95.7 ms). The deceleration interval of
378
age-matched participants was longer than that of young participants (p < 0.001). 379
380
No interaction was observed between group and angle. 381
382
5. Maximum grip aperture
383
A group effect was observed on maximum grip aperture (F(2, 45) = 3.5; p < 0.04; η²=
384
0.13). The maximum grip aperture of glaucoma patients (Xmean = 8.7 cm; SD = 1.4 cm) was
385
not significantly different from that of age-matched participants (Xmean = 8.8 cm; SD = 1cm).
386
A tendency was observed between the maximum grip aperture of glaucoma patients and that 387
of young participants (p = 0.079). (Xmean = 9.6 cm; SD = 1 cm, p = 0.08).
388 389
No interaction was found between group and angle on maximum grip aperture. 390
391
6. Time to maximum grip aperture
A group effect was observed on time to maximum grip aperture (F(2, 45) = 19.2; p <
393
0.001; η² = 0.29). A Bonferroni post-hoc comparison revealed a significant interaction 394
between the time to maximum grip aperture of both glaucoma patients (Xmean = 804.2 ms; SD
395
= 253.2 ms) and age-matched participants (Xmean = 727; SD = 148 cm) with young
396
participants (Xmean = 496.8 cm; SD = 86.1 cm, p < 0.001).
397 398
No interaction was found between group and angle on time to maximum grip aperture. 399
400
Finally, no correlation was found between visual acuity and kinematics parameters for 401
glaucoma patients. 402
403
To summarize (Table 5), in the delayed condition, glaucoma patients had significantly 404
longer movement duration and deceleration interval than age-matched and young participants. 405
This result indicates an effect of glaucoma on the grasping phase of the movement. 406
Interestingly, the deceleration deficit in glaucoma patients was not affected by the location of 407
the cylinder, suggesting that it does not depend on the location of the visual field deficit. 408
409
Comparison between the immediate versus delayed conditions for each glaucoma
410
patient
411
No statistical difference was observed between immediate and delayed tasks for each 412
glaucoma patient on movement durations, deceleration interval, maximum grip aperture and 413
time to maximum grip aperture. 414
A statistical difference was observed between immediate and delayed task for 416
glaucoma patient on peak velocity (F(1, 14) = 6.04; p = 0.032; η² = 0.07) and acceleration
417
interval (F(1, 14) = 4,87; p = 0.05; η²= 0.023). Glaucoma patient had faster peak velocity in
418
delayed task (Xmean = 39.2 cm/s; SD = 11.7 cm/s) than in immediate task (Xmean = 32.4 cm/s;
419
SD = 10.2 cm/s). Glaucoma patient had longer acceleration interval in delayed task (Xmean =
420
390.8 ms; SD = 100.6 ms) than in immediate task (Xmean = 358.4 ms; SD = 107 ms).
421 422
Discussion 423
The present study was designed to investigate whether abnormalities in reach-and-424
grasp tasks observed in previous studies in glaucoma patients resulted from difficulties in the 425
perception of the relevant metric parameters to reach and grasp a target object (immediate 426
condition: no time for visual exploration) or in motor production (delayed condition: time for 427
visual exploration). Glaucoma patients and age-matched participants differed significantly in 428
movement duration and peak velocity when participants had a temporal constraint for visual 429
exploration (immediate condition). Glaucoma patients exhibited faster peak velocity, which is 430
related to the reaching phase of the motor action execution.29,30 Comparison of the immediate 431
condition (Xmean = 32.4 cm/s; SD = 10.2 cm/s) versus the delayed condition (Xmean = 39.2
432
cm/s; SD = 11.7 cm/s) for each glaucoma patient confirm statistical difference on peak 433
velocity. Moreover, a positive correlation was found for the immediate condition between the 434
visual acuity of glaucoma patients and both movement duration and deceleration interval for 435
all angles and time to MGA at 60° left angle. These results are consistent with previous 436
studies showing a longer movement duration and correlations between visual acuity and both 437
movement duration and peak velocity in glaucoma patients.20 However, Kotecha and al. 438
(2009) reported a negative correlation between visual acuity and peak velocity. One 439
explanation could be that the participants’ strategy consists in faster peak velocity to avoid the 440
acceleration interval (and movement duration) as “normal”. Consistent with this explanation, 441
we found no difference in terms of acceleration interval between glaucoma patients and age-442
matched participants, unlike Kotecha et al. (2009). Methodological differences could account 443
for this change in strategy. In our study, the cylinders had the same size (5.5 cm) and 444
locations (25 cm) from the starting point at 0 (center), 30° and 60° to the left and to the right 445
of the central cylinder. In the studies by Kotecha et al., the cylinder changed in size (24 or 48 446
mm) and spatial location (200 mm or 400 mm) at each trial. Therefore, in their study, the 447
participants had to adjust the maximum opening of their hand to the size of the object, 448
whereas this adaptation was not required in our study because all cylinders had the same size 449
and distance. Participants can use the “same” motor command to adjust their maximum grip 450
aperture at each trial.22,23 Interestingly, peak velocity differed between glaucoma patients and 451
age-matched participants, especially at 60° eccentricity left and right. Even though the 452
participants were in a natural situation where they could move their head freely, the deficit in 453
the peripheral visual field of glaucoma patients affected their kinematic parameters, especially 454
for an object located in the peripheral visual field. 455
As mentioned in the introduction, two interpretations might account for these 456
differences: (1) the kinematic difference of patients’ motor execution might result from the 457
effect of visual impairment on motor production; or (2) the effect of visual impairment on 458
identification (i.e., the spatial location and/or the width of the target) might lead to a motor 459
deficit. To dissociate these hypotheses, a second task (the delayed condition) was proposed to 460
the same participants. In this task, participants had time to explore and identify the target and 461
the distractors before reaching and grasping the target. In the delayed condition, a significant 462
difference was found in kinematic parameters between glaucoma patients and aging controls. 463
These deficits were found in deceleration intervals, which correspond to the grasp phase and 464
online control of action.20,31,32 These result became clear in the light of the comparison 465
between the performance in the immediate condition versus the delayed condition for each 466
glaucoma patient. The comparison revealed no statistical difference for the deceleration 467
interval (Xmean = 860.4 ; SD = 230 ms for immediate condition and Xmean = 860.4 ms; SD 468
= 162.8 ms for delayed condition). Hence, time to exploration is not helpful for glaucoma 469
patient. The difference in the delayed condition on deceleration interval between glaucoma 470
patient (Xmean = 860.4 ms; SD = 162.8 ms) and age-matched participant (Xmean = 651.6 471
ms; SD = 138 ms) results from increase performance (i.e. faster deceleration interval) for 472
age-matched participant between the delayed condition (Xmean = 651.6 ms; SD = 138 ms) 473
and the immediate condition (Xmean = 760.4 ms; SD = 139 ms) indicating that time to visual 474
exploration is helpful for age-matched participant but not for glaucoma patient. 475
Like patients with AMD,25 glaucoma patients exhibited motor deficit only when they 476
had no time to explore the visual scene (immediate condition). The deficit is specific to the 477
reach phase. The motor abnormalities in reaching phase observed in glaucoma patient in 478
previous studies seem to result from difficulties in target identification rather than from visuo-479
motor deficits. Further studies are needed in binocular viewing conditions with various 480
natural objects to confirm and clarify these results and extend them to daily life activities. 481
482
Conclusion and limitations 483
Glaucoma patients exhibited a motor disorder (reaching phase) in our study, only 484
when they had no time to explore their environment before performing the reach-and-grasp 485
task. From a clinical point of view, motor performance of glaucoma patients could be 486
modulated by task, especially by temporal constraints of task. 487
References
1. World Health Organization. Action plan for the prevention of avoidable blindness and visual impairment, 2009-2013. Published online 2010.
2. Glovinsky Y, Quigley HA, Dunkelberger GR. Retinal ganglion cell loss is size dependent in experimental glaucoma.
Invest Ophthalmol Vis Sci. 1991;32(3):484-491.
3. Quigley HA, Dunkelberger GR, Green WR. Chronic Human Glaucoma Causing Selectively Greater Loss of Large Optic Nerve Fibers. Ophthalmology. 1988;95(3):357-363. doi:10.1016/S0161-6420(88)33176-3
4. Crabb DP, Smith ND, Glen FC, Burton R, Garway-Heath DF. How does glaucoma look?: patient perception of visual field loss. Ophthalmology. 2013;120(6):1120-1126. doi:10.1016/j.ophtha.2012.11.043
5. Dive S, Rouland JF, Lenoble Q, Szaffarczyk S, McKendrick AM, Boucart M. Impact of Peripheral Field Loss on the Execution of Natural Actions: A Study With Glaucomatous Patients and Normally Sighted People.
doi:info:doi/10.1097/IJG.0000000000000402
6. Ramulu PY, West SK, Munoz B, Jampel HD, Friedman DS. Driving Cessation and Driving Limitation in Glaucoma: The Salisbury Eye Evaluation Project. Ophthalmology. 2009;116(10):1846-1853. doi:10.1016/j.ophtha.2009.03.033
7. González-Alvarez C, Subramanian A, Pardhan S. Reaching and grasping with restricted peripheral vision. Ophthalmic
Physiol Opt J Br Coll Ophthalmic Opt Optom. 2007;27:265-274. doi:10.1111/j.1475-1313.2007.00476.x
8. Sivak B, MacKenzie CL. Integration of visual information and motor output in reaching and grasping: The contributions of peripheral and central vision. Neuropsychologia. 1990;28(10):1095-1116. doi:10.1016/0028-3932(90)90143-C
9. Ergun E, Maár N, Radner W, Barbazetto I, Schmidt-Erfurth U, Stur M. Scotoma size and reading speed in patients with subfoveal occult choroidal neovascularization in age-related macular degeneration. Ophthalmology.
2003;110(1):65-69. doi:10.1016/S0161-6420(02)01566-X
10. Rubin GS. Vision rehabilitation for patients with age-related macular degeneration. Eye. 2001;15(3):430-435. doi:10.1038/eye.2001.148
11. Tejeria L, Harper RA, Artes PH, Dickinson CM. Face recognition in age related macular degeneration: perceived disability, measured disability, and performance with a bioptic device. Br J Ophthalmol. 2002;86(9):1019-1026.
12. Pardhan S, Gonzalez-Alvarez C, Subramanian A. How does the presence and duration of central visual impairment affect reaching and grasping movements? Ophthalmic Physiol Opt. 2011;31(3):233-239. doi:10.1111/j.1475-1313.2010.00819.x
13. Timberlake GT, Omoscharka E, Quaney BM, Grose SA, Maino JH. Effect of bilateral macular scotomas from age-related macular degeneration on reach-to-grasp hand movement. Invest Ophthalmol Vis Sci. 2011;52(5):2540-2550. doi:10.1167/iovs.10-6062
14. Connolly JD, Goodale MA. The role of visual feedback of hand position in the control of manual prehension. Exp
Brain Res. 1999;125(3):281-286.
15. Jeannerod M. Intersegmental Coordination During Reaching at Natural Visual Objects. In: Long J, Baddeley A, eds.
Attention and Performance IX. Lawrence Erlbaum Associates; 1981:153-169.
16. Lee Y-L, Crabtree CE, Norman JF, Bingham GP. Poor shape perception is the reason reaches-to-grasp are visually guided online. Percept Psychophys. 2008;70(6):1032-1046. doi:10.3758/PP.70.6.1032
17. Ma-Wyatt A, McKee SP. Visual information throughout a reach determines endpoint precision. Exp Brain Res. 2007;179(1):55-64. doi:10.1007/s00221-006-0767-1
18. Saunders JA, Knill DC. Humans use continuous visual feedback from the hand to control fast reaching movements.
Exp Brain Res. 2003;152(3):341-352. doi:10.1007/s00221-003-1525-2
19. Pardhan S, Gonzalez-Alvarez C, Subramanian A, Chung STL. How Do Flanking Objects Affect Reaching and Grasping Behavior in Participants with Macular Disorders? Invest Ophthalmol Vis Sci. 2012;53(10):6687-6694. doi:10.1167/iovs.12-9821
20. Kotecha A, O’Leary N, Melmoth D, Grant S, Crabb DP. The functional consequences of glaucoma for eye-hand coordination. Invest Ophthalmol Vis Sci. 2009;50(1):203-213. doi:10.1167/iovs.08-2496
21. Grant S, Melmoth DR, Morgan MJ, Finlay AL. Prehension Deficits in Amblyopia. Invest Ophthalmol Vis Sci. 2007;48(3):1139-1148. doi:10.1167/iovs.06-0976
22. Sabes PN. The planning and control of reaching movements. Curr Opin Neurobiol. 2000;10(6):740-746.
23. Wolpert DM, Kawato M. Multiple paired forward and inverse models for motor control. Neural Netw Off J Int Neural
Netw Soc. 1998;11(7-8):1317-1329.
24. Khan MA, Franks IM, Elliott D, et al. Inferring online and offline processing of visual feedback in target-directed movements from kinematic data. Neurosci Biobehav Rev. 2006;30(8):1106-1121.
doi:10.1016/j.neubiorev.2006.05.002
25. Corveleyn X, Lenoble Q, Szaffarczyk S, Tran THC, Boucart M. What Is the Nature of the Reach and Grasp Deficit in Wet Age-related Macular Degeneration? Optom Vis Sci Off Publ Am Acad Optom. 2018;95(3):171-182.
doi:10.1097/OPX.0000000000001189
26. Boucart M, Delerue C, Thibaut M, Szaffarczyk S, Hayhoe M, Tran THC. Impact of Wet Macular Degeneration on the Execution of Natural Actions. Invest Ophthalmol Vis Sci. 2015;56(11):6832-6838. doi:10.1167/iovs.15-16758
27. Pardhan S, Scarfe A, Bourne R, Timmis M. A Comparison of Reach-to-Grasp and Transport-to-Place Performance in Participants With Age-Related Macular Degeneration and Glaucoma. Invest Ophthalmol Vis Sci. 2017;58(3):1560-1569. doi:10.1167/iovs.16-20273
28. Folstein MF, Folstein SE, McHugh PR. “Mini-mental state”. A practical method for grading the cognitive state of patients for the clinician. J Psychiatr Res. 1975;12(3):189-198.
29. Chieffi S, Gentilucci M. Coordination between the transport and the grasp components during prehension movements.
Exp Brain Res. 1993;94(3):471-477.
30. Hommel B. Action control according to TEC (theory of event coding). Psychol Res PRPF. 2009;73(4):512-526. doi:10.1007/s00426-009-0234-2
31. Desmurget M, Epstein CM, Turner RS, Prablanc C, Alexander GE, Grafton ST. Role of the posterior parietal cortex in updating reaching movements to a visual target. Nat Neurosci. 1999;2(6):563-567. doi:10.1038/9219
Figure Legends
Figure 1. Schematic representation of experimental design. R = Red ; B = Blue ; Y = Yellow ; G = Green ; W = White.
Figure 2. Schematic representation of both tasks. The major difference is the separation of the visual exploration phase and the reach-and-grasp phase in the task, with no temporal constraint for visual exploration compared to mixing these two phases (visual exploration and reach-and-grasp) in the task with temporal constraints for visual exploration.
Figure 3. Plot of thumb and object velocity (left axis, dashed line) and grip aperture (right axis, solid line) versus time for one trial of immediate condition. MGA: Maximum Grip Aperture.
Figure 4. Peak velocity in function of angle for glaucoma patients (square), age-matched (diamond) and young participants (round) for immediate condition. Bars correspond to standard error.
Figure 5. Mean deceleration interval (all angles) in function of visual acuity (left panel) and MD 30-2 for tested eyes (right panel) for glaucoma patients.
Table 1
Table 1. Demographic data of glaucoma patients, age-matched controls and young control participants. Standard deviation indicated between brackets. Aged-matched had VA ranging from 20/25 to 20/20. Glaucoma patient Age-matched Young Control Age 62.9 (7.74) 62.1 (10.4) 25.9 (4.09) Gender 10 female 11 female 13 female Tested eye 7 right 7 right 11 right
MD 30-2 -16.4 (5.76) NA NA VA LogMAR (0.09) 0.11 NA NA MMSE 28.6 (1.46) 28.9 (0.73) 29.7 (0.461)
Table 2 Number/Age/ Gender MMSE Tested Eye VA LogMAR MD 30-2 (tested eye) MD 30-2 1/62/F 30 RE 0 -21.9 -26.17 2/67/F 28 RE 0.1 -8.6 -9.1 3/74/F 28 RE 0.1 -22.5 -22.8 4/62/F 30 RE 0.1 -9.1 -26.5 5/60/F 30 RE 0 -16.2 -11.2 6/60/M 30 RE 0.2 -16.1 -8.6 7/46/M 28 RE 0.1 -15.6 -17.4 8/69/F 29 LE 0.1 -9.04 -10.9 9/74/F 25 LE 0.1 -20 -17.5 10/62/F 29 LE 0.2 -16.1 -20.6 11/68/F 29 LE 0.2 -9.8 -14.5 12/67/F 26 LE 0 -15.4 -11.2 13/59/M 30 LE 0 -25.6 -28.9 14/68/M 29 LE 0.2 -27 -27.4 15/59/M 28 LE 0.3 -14.1 -17.8 16/49/M 28 LE 0 -15.3 -17.6
Table 2. Demographic and clinical data of patients with glaucoma. LE = left eye, RE = right eye, MMSE = Mini-mental state examination.
Table 3
60° left 30° left 0° 30° right 60° right Movement duration 0.78 0.46 0.64 0.53 0.59 Peak Velocity 0.3 0.07 0.01 0.05 0.145 Acceleration interval 0.4 0.08 0.15 0.02 0.34 Deceleration interval 0.8 0.58 0.57 0.6 0.57 MGA 0.02 0.12 0.11 0.13 0,03 Time to MGA 0.7 0.39 0.36 0.23 0.16
Table 3. Spearman correlations between visual acuity and each kinematic parameter in immediate condition for glaucoma patients. Correlations in bold are statistically significative. MGA = Maximum grip aperture.
Table 4 Mouvement Duration in ms Peak velocity in cm/s Acceleration interval in ms Deceleration interval in ms MGA in mm Time to MGA in ms Glaucoma patient 1179 (250) 32.4 (10.2) 358.4 (107) 860.4 (230) 8,96 (1.82) 716,4 (191) Age-matched 1001,8 (169.6) 24.4 (7.4) 378.2 (82.7) 760,4 (139) 8,88 (1.04) 665,4 (98.02) Young control 680.2 (106.5 ) 22.8 (2.4) 269.4 (55) 458.6 (129.8) 9.47 (1.09) 463.6 (102.1) Group effect p < 0.001* p < 0.001* p < 0.01 p < 0.001 p = 0.28 p < 0.001 Group *Angle effect p = 0.013+ p = 0.032* p = 0.59 p < 0.001 P = 0.03 p = 0.45
Table 4. For each kinematic parameter, mean and standard deviation for glaucoma patients, age-matched and young participants with statistical results as a function of Group and of Angle*Group in the immediate condition. Significant effects are in bold font. * indicates difference between glaucoma patients and age-matched participants in post-hoc test (p < 0.05). + indicates tendential difference between glaucoma patients and age-matched participants in post-hoc test (p < 0.1). ms: millisecond, mm: millimeter, cm/s: centimeter per second.
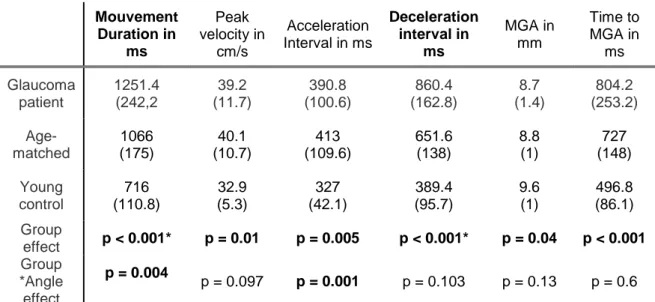
Table 5 Mouvement Duration in ms Peak velocity in cm/s Acceleration Interval in ms Deceleration interval in ms MGA in mm Time to MGA in ms Glaucoma patient 1251.4 (242,2 39.2 (11.7) 390.8 (100.6) 860.4 (162.8) 8.7 (1.4) 804.2 (253.2) Age-matched 1066 (175) 40.1 (10.7) 413 (109.6) 651.6 (138) 8.8 (1) 727 (148) Young control 716 (110.8) 32.9 (5.3) 327 (42.1) 389.4 (95.7) 9.6 (1) 496.8 (86.1) Group effect p < 0.001* p = 0.01 p = 0.005 p < 0.001* p = 0.04 p < 0.001 Group *Angle effect p = 0.004 p = 0.097 p = 0.001 p = 0.103 p = 0.13 p = 0.6
Table 5. For each kinematic parameter, mean and standard deviation for glaucoma patients, age-matched and young participants with statistical results as a function of Group and of Angle*Group in the delayed condition. Significant effects are in bold font. * indicates difference between glaucoma patients and age-matched participants in post-hoc test (p < 0.05). ms: millisecond, mm: millimeter, cm/s: centimeter per second.