A Computational Tool for Evaluating Urban Vitality Using
Kendall Square Development Proposals as a Case Study
by
Waleed F. Gowharji B.S. Aerospace Engineering
Embry-Riddle Aeronautical University, 2008
M.S. Mechanical Engineering
Embry-Riddle Aeronautical University, 2011 Submitted to the Program in Media Arts and Sciences,
School of Architecture and Planning,
In Partial Fulfillment of the Requirements for the Degree of Master of Science in Media Arts and Sciences
at the
MASSACHUSETTS INSTITUTE OF TECHNOLOGY SEPTEMBER 2016
C
2016 Massachusetts Institute of Technology, 2016. All rights reserved.Signature of Author E Certified by Accepted by MASSACHUSETTS INSTITUTE OF TECHNOLOGY
[IEC
12
2016
LIBRARIES
ARCHIVES
Signature redacted
aleed F. Gowharji Media Arts and SciencesI
/
I I
August 30, 2016ignature redacted_
Kent Larson Principal Research Scientist of Media Arts and Sciences Thesis Supervisor
_S
ignature redacted
Pattie Maes Academic head, Program in Media Arts and Sciences
A Computational Tool for Evaluating Urban Vitality Using Kendall
Square Development Proposals as a Case Study
Waleed F. Gowharji
Submitted to the Program in Media Arts and Sciences, School of Architecture and Planning,
in Partial Fulfillment of the Requirements for the Degree of Master of Science in Media Arts and Sciences
Abstract
Kendall Square, home to MIT, a world-class university and a district known globally for its reputation as an epicenter of ideas and innovation, has recently seen a new wave of development seeking to turn it into a place for people. Typically, multiple developers and private investors will bid on developing the area. The competitive nature of this process suggests that involved parties have varying and potentially conflicting objectives. For example, the soaring office and residential rents in Kendall Square make it attractive to private developers looking for monetary gains. Furthermore, in an area with an already high employment density, the addition of more office and commercial spaces could increase the stress on the public transportation system that is struggling to keep up with current demand. This becomes a design problem with no optimal solution. The question becomes, how do we design districts to be more livable for people? In this research we propose a computational evaluation decision support platform to facilitate collaborations between stakeholders in their interactions within the contexts of urban planning. Whether planned interventions or new developments, the aim of this research is to give stakeholders the ability to weigh the implications from these interventions on the vitality of districts. Chapter 1 lays the foundation of the theoretical contributions put forth by Jane Jacobs regarding urban vitality. Chapter 2 discusses the four-diversity conditions for urban vitality and early attempts to validate these conditions. Chapter 3 presents an overview of the urban elements of both Kendall Square and Harvard Square as a case study. In chapter 4 we apply Jacobs' vitality conditions to both case studies. We find that Harvard Square is balanced in terms of Jacobs' conditions, while Kendall Square suffered form an imbalance in residential density. Chapter 5 presents the computational evaluation platform "CityMatrix" and uses the Volpe and MIT development sites as examples of urban interventions. We find that the current plan, approximately 16,000 employees and 3,500 residents is not enough to increase the population density to make Kendall Square a more vital district. Lastly, chapter 6 provides a conclusion and future steps for this research.
Thesis Supervisor: Kent Larson
A Computational Tool for Evaluating Urban Vitality Using Kendall
Square Development Proposals as a Case Study
by
Waleed F. Gowharji
The following has served as a reader on this thesis:
Signature redacted
Sandy Pentland Professor of Media Arts and Sciences Reader:
A Computational Tool for Evaluating Urban Vitality Using Kendall
Square Development Proposals as a Case Study
by
Waleed F. Gowharji
The following has served as a reader on this thesis:
/
Signature redacted
Reader:
Olivier de Weck Professor of Aeronautics and Astronautics And Engineering Systems
Acknowledgments
I am extremely grateful to the faculty at the MIT Media Lab as well as my colleagues in the
Changing Places group who have been supportive of my research. This work is a statement to those who guided me with their knowledge and support.
I wish to thank my advisor, Kent Larson, for his guidance throughout the process of writing this
thesis. His continuous support of my research has been instrumental to me continuing this work. Without his domain knowledge, support and enthusiasm, my research would not be complete.
I would also like to extend my gratitude to my thesis readers, Sandy Pentland and Olivier de
Weck for their support and comments.
I would also like to thank the administrative staff at the Media Lab for making this experience
feel so positive. I am truly grateful for the support of Katharine Paras, Keira Horowitz, and Mary Heckbert. Thank you for helping me through the hard times and the amazing lunches.
This thesis would not be possible without the support of the King Abdulaziz City of Science and Technology (KACST), the Center for Complex Engineering Systems (CCES), and the Saudi Arabian Cultural Mission (SACM). To my mentors at CCES, Dr. Anas Alfaris and Adnan AlSaati, thank you.
To my parents Nita and Fathi, I owe my success in life to you both. Your love and support through the years has brought me to where I am today. I dedicate this thesis to you. To my sisters, Nour and Lena, thank you for being there for me when I needed you the most. To the love of my life, Natalia, thank you for being so patient with me.
Lastly, I would like to thank Yan "Ryan" Zhang for the support and late nights in the lab. Your proficiency in Rhino and Grasshopper is unparalleled. Your CityMatrix Platform proved to be the perfect complement to this research.
Table of Contents
TABLE OF FIGURES 13 LIST OF TABLES 16 LIST OF VARIABLES 17 UNITS 17 INTRODUCTION 18BACKGROUND & RELATED WORKS 25
OVERVIEW 25
JACOBS' THEORIES 26
CONTEXTUALIZING JACOBS' THEORIES 30
EARLY ATTEMPTS 30
RECENT ATTEMPTS 31
JACOBS'S FOUR CONDITIONS FOR URBAN VITALITY 33
MIXED-LAND USE 33
SMALL BLOCKS 33
AGED BUILDINGS 34
DENSITY 35
VACUUMS 36
URBAN COMPUTATIONAL PLATFORMS 37
CASESTUDY 41
KENDALL SQUARE PROFILE 41
HARVARD SQUARE PROFILE 44
COMPUTATIONAL MODEL 50
OVERVIEW 50
VARIABLE DISCUSSION 50
LAND USE VARIABLES 50
BLOCK SIZE VARIABLES 54
CONCENTRATION AND DENSITY VARIABLES 56 SUMMARY OF RESULTS & DISCUSSION 57
COMPUTATIONAL EVALUATION PLATFORM & MODEL 61
OVERVIEW METHODOLOGY
KENDALL SQUARE CASE STUDY CURATED INTERVENTION
ABSTRACTION AND IMPLEMENTATION
LEGO BLOCK DEFINITION
LEGO BLOCK SCALE AND TABLE SETUP
EVALUATION METRICS
COMPUTATIONAL EVALUATION RESULTS & DISCUSSION
61 63 63 64 68 68 69 73 75
BASELINE SCENARIO 75
ADDING MIT DEVELOPMENT SITE SCENARIO 78
VOLPE+MIT SCENARIO 80
DESIRED SCENARIO 83
CONCLUSION 87
BIBLIOGRAPHY 90
Table of Figures
FIGURE 1: KING ABDULLAH FINANCIAL DISTRICT IN RIYADH UNDER CONSTRUCTION IN RIYADH, SAUDI ARABIA. THE DISTRICT BOASTS THREE TIMES AS MUCH PRIME REAL ESTATE THAN
RIYADH IN ITS ENTIRETY (ARAB NEWS, 2016). 19
FIGURE 2: WHAT MAKES A PLACE GREAT? GREAT PLACES OFFER A PLETHORA OF ACTIVITIES AND DIFFERENT TYPES OF BUILDING USES, AS WELL AS GREAT ACCESSIBILITY, AND
DIVERSITY OF RESIDENTS AND DWELLERS (MOSKERINTZ, 2014). 21
FIGURE 3: THE SECOND GENERATION CITYSCOPE PLATFORM USED FOR SHARED, INTERACTIVE COMPUTATION IN AN URBAN PLANNING ENVIRONMENT (LARSON, REINHART, ALFARIS, &
AL-WABIL, 2014). 22
FIGURE 4: DURING SUMMERTIME IN NEW YORK, FREE YOGA CLASSES ARE OFFERED AS PART OF A MULTITUDE OF RECREATIONAL ACTIVITIES (HABTAT NEW YORK, 2016). 27 FIGURE 5: LARGE BLOCK, SUCH AS THOSE FOUND IN NEW YORK IMPEDE FOOT TRAFFIC AND
INTERACTION FREQUENCY (JACOBS, 1961). 28
FIGURE 6: CONVERSELY, SMALL BLOCKS OFFER MULTIPLE AVENUES THROUGH WHICH
PEDESTRIANS CAN SOCIALLY RUN INTO ONE ANOTHER (JACOBS, 1961). 29 FIGURE 7: RICHARD FLORIDA THAT A VERTICAL DRIVE FOR DENSITY IS NOT THE SOLUTION TO
FOSTERING URBAN VITALITY. RATHER, A CARFUL MIX OF DIVERSE RESIDENTS AND
WORKERS LIVING IN A WALKABLE ENVIRONMENT IS KEY (YEUNG, 2016). 35 FIGURE 8: SUMMARY OF THE MOST IMPORTANT VARIABLES THAT IMPACTS EACH OF THE
CONDITIONS JACOBS REFERRED TO IN THE DEATHAND LIFE OF GREATAMERICAN CITIES (DE NADAI, STAIANO, LARCHER, SEBE, QUERCIA, & LEPRI, 2106). 36 FIGURE 9: CITY SCOPE CAN BE USED TO SIMULATE A WIDE VARIETY OF URBAN INTERVENTIONS,
SUCH AS THE INTRODUCTION OF SHARED-USE AUTONOMOUS VEHICLES, NEW ROADWAY AND PATHWAY DESIGNS, OR THE IMPACT OF NEW DEVELOPMENTS ON PEDESTRIAN AND VEHICLE MOVEMENT (LARSON, REINHART, ALFARIS, & AL-WABIL, 2014). 38 FIGURE 10: CITYSCOPE USED GIS DATA AND ALGORITHMS TO CREATE A VOXELIZED,
3-DIMENSIONAL REPRESENTATION OF AN EXISTING URBAN AREA IN KENDALL SQUARE, MASSACHUSETTS (LARSON, REINHART, ALFARIS, & AL-WABIL, 2014). 39 FIGURE 11: CITYSCOPE MARKII SCOUT TABLE, USING STATIC PROJECTION MAPPING ONTO A
CANVAS FOR LAND USE PLANNING, ALLOWING RAPID PROTOTYPING WITH REAL-TIME EVALUATION (LARSON, REINHART, ALFARIS, & AL-WABIL, 2014). 40
FIGURE 12: GEOGRAPHICAL LAYOUT OF KENDALL SQUARE IS BOUNDED TO THE NORTH BY
BROADWAY AND MAIN STREET, THE CHARLES RIVER TO THE EAST, AND THE BOSTON & ALBANY RAILROAD TRACKS TO THE WEST (CAMBRIDGE COMMUNITY DEVELOPMENT
DEPARTMENT, 2013). 41
FIGURE 13: THE BREAK DOWN OF KENDALL SQUARE (AND SURROUNDING AREA) BY LAND USE
FIGURE 14: LIST OF ALL LAND USE CATEGORIES IN KENDALL SQUARE (CAMBRIDGE COMMUNITY
DEVELOPMENT DEPRTMENT, 2015). 43
FIGURE 15: ZONING DISTRICTS WERE USED TO IDENTIFY THE MAXIMUM HEIGHT FOR BUILDINGS IN KENDALL SQUARE, WHICH WILL LATER BE USED TO CALCULATE USED TO CALCULATE "BUILDING TYPES" (CAMBRIDGE COMMUNITY DEVELOPMENT DEPRTMENT, 2015). 44
FIGURE 16: GEOGRAPHICAL LAYOUT OF HARVARD SQUARE. AT THE CENTER IS HARVARD SQUARE STATION, ONE OF THE BUSIEST ON THE RED LINE WITH BUS LINKS BOTH UNDERGROUND NEAR THE TRAINS, AND ALONG MASSACHUSETTS AVENUE NEXT TO
HARVARD YARD AND THE CAMBRIDGE COMMON (CAMBRIDGE COMMUNITY
DEVELOPMENT DEPARTMENT, 2013). 45
FIGURE 17: THE BREAK DOWN OF HARVARD SQUARE (AND SURROUNDING AREA) BY LAND USE
CATEGORY (CAMBRIDGE COMMUNITY DEVELOPMENT DEPRTMENT, 2015). 47
FIGURE 18: ZONING DISTRICTS WERE USED TO IDENTIFY THE MAXIMUM HEIGHT FOR BUILDINGS IN HARVARD SQUARE, WHICH WILL LATER BE USED TO CALCULATE "BUILDING TYPES"
(CAMBRIDGE COMMUNITY DEVELOPMENT DEPRTMENT, 2015). 48
FIGURE 19: THE RESULTS OF THE VITALITY VARIABLES AS PRESCRIBED BY JACOBS FOR BOTH KENDALL AND HARVARD SQUARE. CLEARLY VISIBLE FROM THE RADAR CHART, HARVARD SQUARE IS MORE BALANCED IN TERMS OF THE DIVERSITY CONDITIONS SPELLED OUT BY JACOBS. IN CONTRAST, KENDALL SQUARE IS LESS UNIFORM. THE IDEAL CASE WOULD
SHOW A MORE CIRCULAR COVERAGE. KENDALL SQUARE (BLUE) AND HARVARD SQUARE
(RED). 59
FIGURE 20: SUMMARY PLOT SHOWING THE MOST IMPORTANT VARIABLES AND PROPOSED BY DE NADAI ET AL. FOR BOTH KENDALL SQUARE (BLUE) AND HARVARD SQUARE (RED). THE RESULTS INDICATE THAT HARVARD SQUARE PERFORMS BETTER THAN KENDALL SQUARE IN SOME ASPECTS WHILE KENDALL SQUARE OUTPERFORMS HARVARD SQUARE IN OTHERS.
60 FIGURE 21: OVERVIEW OF THE CITYMATRIX- AN URBAN VITALITY COMPUTATIONAL
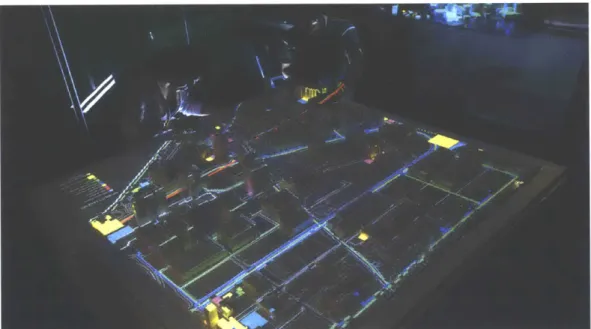
EVALUATION TOOL. THERE ARE THREE MAIN PHYSICAL COMPONENTS TO THE PLATFORM:
THE LEGO TABLE, OVERHEAD PROJECTION, AND CAMERA (FOR READING LEGO TAGS) 62 FIGURE 22:THE OUT LINE OF KENDALL SQUARE ALONG WITH NEIGHBORING DISTRICTS. 63 FIGURE 23: MIT RECEIVED APPROVAL FROM THE CAMBRIDGE PLANNING BOARD TO BUILD SIX
NEW BUILDING ON MAIN STREET AND BROADWAY (LOGAN, WILL KENDALL SQUARE
FINALLY FEEL LIKE A REAL NEIGHBORHOOD?, 2016). 64
FIGURE 24: THE PLANS SHOW THAT IN TOTAL, THERE WILL BE AN ADDITIONAL 1.15 MILLION SQUARE FEET OF OFFICE SPACE, AND "PERHAPS 2,000 RESIDENTIAL UNITS" TO THE MIT DEVELOPMENT SITE (BLUE) AND 620,00 SQUARE FEET OF RESIDENTIAL AND OFFICE SPACE
FOR THE VOLPE SITE (RED) (MIT, 2016). 65
FIGURE 25: THE SIMULATION PLATFORM UTILIZES QR CODES THAT REPRESENT RESIDENTIAL, EDUCATIONAL, COMMERCIAL, OFFICE PUBLIC SPACES, OPEN SPACES, AND PARKING. 69 FIGURE 26: ABSTRACTING THE DEVELOPMENT AREA ON THE CITY SCOPE TABLE IS THE FIRST
WITH LEGO BRICKS. THE HIGHLIGHTED REGIONS IN RED ARE THE ACTIVE AREAS THE
SIMULATION WILL BASE THE VITALITY METRICS FROM. 70 FIGURE 27: KENDALL SQUARE ABSTRACTION INCLUDING THE EXISTING LAND USE 71 FIGURE 28: OVERVIEW OF THE SIMULATION PLATFORM INCLUDING THE INPUTS: ACTIVE
SIMULATION AREA, DENSITY SCALAR & COMMERCIAL AREA SCALAR AND OUTPUTS:
VITALITY INDICATORS. THE VOLPE DEVELOPMENT SITE IS HIGHLIGHTED IN RED AND THE
MIT DEVELOPMENT SITE IS HIGHLIGHTED IN BLUE. 72
FIGURE 29: CITYMATRIX CAPTURES VITALITY METRICS RELATED TO RESIDENTIAL AND
EMPLOYMENT DENSITY, HOUSING DIVERSITY, CLOSENESS TO PARKS AND 3R PLACES. 75 FIGURE 30: SIMULATION OUTPUT REFLECTING THE BASELINE AND PROPOSED DEVELOPMENT
SITES IN KENDALL SQUARE. THE RADIAL CHART SHOWS THE CURRENT VITALITY SCORE (ORANGE) AND BASELINE SCORE (WHITE). FINALLY, A LIST OF RECOMMENDED 3RD PLACES,
APPROXIMATED USING THE CURRENT POPULATION NUMBER. 77
FIGURE 31: COMPUTATIONAL EVALUATION OUTPUTS REFLECTING THE 3 RESIDENTIAL INTERVENTIONS AND 8 OFFICE/COMMERCIAL INTERVENTIONS PROPOSED FOR THE MIT SITE. THE RESULTS INDICATE THAT THESE PLANS ARE NOT ENOUGH TO INCREASE THE RESIDENTIAL DENSITY OF KENDALL SQUARE; A VARIABLE THAT JACOBS CLAIMS TO BE
CRUCIAL TO URBAN VITALITY. 79
FIGURE 32: A FINAL INCREASE TO THE NUMBER OF OPEN SPACES AND RESIDENTIAL (LUXURY AND AFFORDABLE) INCREASES THE CONTRIBUTION OF HOUSING DIVERSITY AND
PROXIMITY TO PARKS TO THE OVERALL VITALITY SCORE. THE RADIAL CHART CLEARLY SHOWS THAT CAREFULLY SCRIPTED INTERVENTIONS CAN ADD TO THE OVERALL VITALITY SCORE (THE BASELINE CASE IS WHITE, WHILE HE ACTIVE SCORE IS ORANGE, AND THE
PREVIOUS OUTPUT IS BLUE). 82
FIGURE 33: A FINAL INCREASE TO THE NUMBER OF OPEN SPACES AND RESIDENTIAL (LUXURY AND AFFORDABLE) INCREASES THE CONTRIBUTION OF HOUSING DIVERSITY AND
PROXIMITY TO PARKS TO THE OVERALL VITALITY SCORE. THE RADAR CHART CLEARLY SHOWS THAT CAREFULLY SCRIPTED INTERVENTIONS ADD TO THE OVERALL VITALITY
KENDALL (THE BASELINE CASE IS WHITE, WHILE HE ACTIVE SCORE IS ORANGE, AND THE
List of Tables
TABLE 1: DISTRICT SIZE (DE NADAI, STAIANO, LARCHER, SEBE, QUERCIA, & LEPRI, 2106)...32
TABLE 2: KENDALL SQUARE MARKET PROFILE SUMMARY ... 42
TABLE 3: HARVARD SQUARE MARKET PROFILE SUMMARY ... 45
TABLE 4:ZONING DISTRICTS FOR KENDALL SQUARE ... 49
TABLE 5: ZONING DISTRICTS FOR HARVARD SQUARE ... 49
TABLE 6: SUMMARY OF MODEL OUTPUTS FOR KENDALL & HARVARD SQUARE ... 58
TABLE 7: KENDALL AND VOLPE DEVELOPMENT PLANS (FAROOQ, 2016)...66
TABLE 8: KENDALL AND VOLPE DEVELOPMENT PLANS (FAROOQ, 2016)...66
TABLE 9: AMENITY THRESHOLD SUGGESTION PER POPULATION (KAUFMAN, 2014)...67
List of variables
Variable Name Variable description
Pij Percentage of land use
n Number of land uses
LUM Land use mix
SP Small Parks
dist(x,y) Distance between two centroids closest(x,Y) Proximity of x to list of Y RNR Residential to non-residential
nonRes Non residential units
Res Residential units
Housing types Housing types
hc,i Number of buildings in height category c
zc Number of floors of height category c Commercial Commercial Places
Nightlife Nightlife Places
Nightlife Density Nightlife Density
3rd Places Third Places
Block Area Block Area
Intersection Density Intersection Density Population Density Population Density Employment Density Employment Density Internal Internal apartments Daily places density Daily places density Non daily places density Non daily places density Places Number of places in district i
Area Area in m2
Units
Introduction
Recently, the Kingdom of Saudi Arabia announced its' "Saudi Vision 2030", which aims
at a complete transformation of the Saudi economy in the coming years. In the document, Deputy Crown Prince Mohammed bin Salman makes an effort at salvaging the King Abdullah
Financial District (KAFD), which was designed to diversify the economy beyond oil as well as
creating jobs, see figure 1. Amongst its design flaws, KAFD was initiated "without consideration
of its economic feasibility" and remains unconvincing to investors and potential tenants. The
goal aims to transform the district into a special business zone with competitive regulations, visa
exemption for foreigners working there, and a direct connection to Riyadh's King Khalid
International Airport, see figure 1. The report also mentioned re-appropriating some of the
already built areas and changing "the real estate mix, increasing the allocation for residential
accommodation, services and hospitality (Arab News, 2016). "
Since its conception, which began in 2006, the district has been plagued by lack of
enthusiasm for the development, which offers 42 buildings of prime real estate in the heart of the
Saudi capital-similar in scale to London's Canary Wharf. As was the case with Canary Wharf,
new office districts often take time to come to fruition. Canary Wharf faced similar skepticism
before becoming the success it is today. It is yet to be seen whether KAFD will live up to the
idea it was meant to be: "a sober Saudi alternative to Dubai's exuberant International Financial
Center." One of the main contributing issues is that the new financial district boasts three times
as much high-end office space as the rest of Riyadh. This combined with a slump in Saudi
Arabia's economic growth-fueled by the glut in the oil market-means that businesses cannot
; I~-7
*Me I,
Figure 1: King Abdullah Financial District in Riyadh under construction in Riyadh, Saudi Arabia. The district boasts three times as much prime real estate than Riyadh in its entirety (Arab News, 2016).
As is the case in the Saudi Context, despite grand efforts, planning in Europe isn't panning out as expected, either. The Association of European School of Planning-an annual convention-has called for new approaches toward rethinking concepts of planning. Global urbanization carries multiple complexities along with unintended consequences and unanticipated outcomes, regardless of context. Given the stochastic nature of future events, planning in a linear fashion is certainly planning for failure (Flint, 2015). These approaches are based on the understanding that urban planning is facing challenges, "not only related to the self-organizing and self steering character of urban reality and the way that the city is undergoing transformations at different scales, but also related to the massive spread of technology, a phenomenon that should be acknowledged in planning procedures and methods (Horelli, Kannen Kuvat, & Johansson, 2013)."
Horelli et al. claim that transformations which urban fabrics undergo are not the direct results of the planning process itself, rather, they are emergent outcomes of contingent
fluctuations of external and internal pressures within the city, including the self-organization of
different groups and networks (Horelli, Kannen Kuvat, & Johansson, 2013). Therefore it is
crucial to include local actors, such as citizens, politicians, administrators, entrepreneurs and
their networks, to design viable urban solutions for everyday urban life. These methods should
allow key actors to analyze, develop, implement and monitor physical, functional and
participatory structures at a district level (Fulton, 1996) (Jacobs, 1961).
So then, what are the constituents of living urban space that facilitate human activity?
How do we quantify the vibrancy of activities that happen in districts? And how can we use this
knowledge in order to design tools that allow planners to engage local actors to design vibrant,
viable urban solutions for everyday urban life? Figure 2 below shows a break down of "what
makes a great place?" Under the four main categories, uses & activities; comfort & image;
access & linkages; sociability; the key attributes that shape "great places" are uses & activities
and access & linkages. These attributes characterize a place as being "fun, active, vital, special, useful, walkable, proximal and convenient." They are measured by metrics such as "business
ownership, land-use patterns, property values, mode splits and pedestrian activity (Moskerintz,
Figure 2: What makes a place great? Great places offer a plethora of activities and different types of building uses, as well as great accessibility, and diversity of residents and dwellers (Moskerintz, 2014).
In this research, the goal is to develop a simulation platform based on empirically grounded mathematical models that will ultimately enable players to quantify, compare and change vitality measures of urban districts through curated interventions. The platform utilizes insights and metrics derived by renowned urban sociologist Jane Jacobs, in the Life and Death of
Great American Cities, to score urban vitality & vibrancy measures. Although, considered as on
of the most influential books in city planning, until recently, the claims made by Jacobs have gone unsubstantiated (De Nadai, Staiano, Larcher, Sebe, Quercia, & Lepri, 2106). However, through works presented by Sung and De Nadai, the claims, theories and axioms presented by Jacobs have been empirically validated using data from multiple cities.
The Changing Places group at the MIT media lab develop simulation systems to predict and quantify the potential impact of disruptive interventions within new and existing cities. The
DSS places special emphasis on augmented reality (through a blend of hardware, software.
human interface design, cloud computation, and variants of so-called big data) that facilitates non-expert stakeholder collaboration within complex urban environments (Larson, Reinhart, Alfaris, & Al-Wabil, 2014). The resulting "CityScope" platform can be used for shared, interactive computation in an urban planning environment, see figure 3. The work presented herein is an extension of this urban DSS platform that leverages previously published works by Jacobs and others. The aim is to use DSSs as a means of answering fundamental research questions posed by urban planners, sociologists and economists, such as "what creates urban
Ii fe?"
Figure 3: The second generation CityScope platform t ISCed 1or s r1 t in t
~cte
computation in an urban planningenvironment ([arson, Reinhart, Alfaris, & AI-Wahil, 2014).
The key constituent for urban vitality, according to Jacobs, is the physical environment
"the urbanfar>ibic. " She argued that urban life/vitality is facilitated with the presence of human
activity (pedestrians) throughout the entirety of a 24-hour period. Conversely, urban death is caused by the elimination of pedestrian activity, through the promotion of highway construction and large-scale development projects (Jacobs, 1961). In other words, in order to breathe
life
intolarge cities, the urban fabric should be characterized by diversity at both the district and street
level. Extending upon this, Jacobs claims that diversity is promoted with four essential
conditions (De Nadai, Staiano, Larcher, Sebe, Quercia, & Lepri, 2106):
1. Mixed land use: districts should be as multipurpose as possible, as monothematic districts
lead to vacuums at different times of the day. Mixed land use also attracts a diversity of
people, all with different purposes.
2. Small blocks: block size has an impact on promoting interaction opportunities between
people.
3. Building age diversity: age diversity makes it possible to mix high-rent and low-rent
tenants. This leads to higher likelihood of diverse interaction between residents working
and living in a given area.
4. Density: sufficient density of buildings and people lead to more frequent and diverse
interactions between people living and visiting a given area.
According to De Nadai et al., these fundamental principles have carried little weight, as the
conditions have never been empirically tested until recently (Sung, Lee, & Cheon, 2015). The
reason for this is due to the difficulty associated with collecting data of districts that are full of
urban vitality and districts that are not. This remained the case until the publication of the works
by Sung et al., which surveyed and tested pedestrian activity in Seoul against Jacob's conditions; and De Nadai et al., which used mobile phone data to extract human activity measurements in six
different Italian cities (Bologna, Florence, Milan, Palermo, Rome, Torino) and test them against
Jacob's conditions. In both instances (Italy and South Korea), although different from locations
from which Jacobs spelled out her conditions (great American cities), these four conditions held
In order to complement these efforts, this work will put forth the use of contribution from
both studies in conjunction with the urban design DSS developed in the Changing Places group.
The outcome of this research effort will present a stylized abstraction of selected districts (using
data from Kendall Square and Harvard Square) that will allow users to score districts along
multiple measures, improve particular vitality related metrics and compare these results to the
results from other districts. Running these simulations under various scenarios will allow users to
draw insights into the inner workings of urban systems. In addition, it will lead to key insights as
to how urban interventions (special places) will impacts districts under a variety of conditions,
Background & Related Works
Overview
The economist reported that 9% of the world's population is expected to live in 41
mega-cities--each with a staggering 10 million inhabitants-by 2030 (The Economist, 2015). As
more and more people gravitate towards mega-cities looking for more prosperous lives and
higher standards of living, the infrastructure (housing, water, food and sewage systems, and
transportation networks) within these cities becomes evermore burdened (De Nadai, Staiano, Larcher, Sebe, Quercia, & Lepri, 2106). That is to say, on one end; cities are "essential
crucibles" for economic activity, innovation, novelty and tolerance, while on the other end; they
are vessels for pollution, poverty and criminal activity, and traffic congestion (De Nadai, Staiano, Larcher, Sebe, Quercia, & Lepri, 2106). The overarching question then becomes, how
can life in cities be supported along with all the prosperous aspects (such as innovation, economic prosperity, novelty and tolerance), while reducing the negative aspects (such as
overcrowding, poverty, criminal activity, traffic and pollution) (De Nadai, Staiano, Larcher,
Sebe, Quercia, & Lepri, 2106).
The main focus of this work is not to look at the impacts of all these aspects; rather, it
will focus on the aspects that impact urban vitality by reflecting on previous works by the likes
of Jane Jacobs as well as others. There are three competing approaches for examining urban
vibrancy (Storper & Scott, 2018). Richard Florida theorizes that metropolitan areas with high
concentrations of technology workers, artists, musicians as well as a group he defines as "high
bohemians" are more likely to be vibrant (Florida, Cities and the Creative Class, 2005), while
fixed infrastructure. This research builds upon the contributions of the latter's approach (Clark,
Lloyd, Wong, & Jain, 2002).
This body of work lends itself to an emerging interdisciplinary field of research called
"urban computing." By definition, it crosses computer science and software approaches with
traditional urban planning, urban economy and urban sociology to develop software solutions to
growing urban challenges (Zheng, Capra, Wolfson, & Yang, 2014). Up until recently, this has
been the missing link that prevented theories, such as those presented by Jacobs, from being
empirically tested and validated. Therefore, attempts to leverage her theoretical contributions in
simulation models were of little impact, as there was no way to test them. This notion has
changed as data from novel sources (such as, social media, online images, mobile phones) has
widely and readily become available (De Nadai, Staiano, Larcher, Sebe, Quercia, & Lepri,
2106).
Jacobs' Theories
According to Jane Jacobs, humans are the primary constituents of a healthy, vital and
vibrant urban core. More specifically their presence throughout urban areas and particularly on
sidewalks is what breaths life into neighborhoods. She surmised that, in order for urban life to be
sustained, a continual flurry of activity consisting of sidewalks filled with pedestrians at all times
of the day must be present. Urban "death", as she called it, is caused by the exclusion of
pedestrian activity from urban cores. This notion feeds into the idea of public safety as "a
well-used city street is apt to be a safe street and a deserted city street is apt to be unsafe" (Jacobs,
1961) (De Nadai, Staiano, Larcher, Sebe, Quercia, & Lepri, 2106).
In order for this statement to hold true, planners and policy makers must provide
throughout the daytime as well as nighttime. In addition to the increased public safety that is created by these "eyes on the street", urban areas thrive with face-to-face interactions throughout the day and night, which can contribute to the local economy. Jacobs prescribes a set of diversity conditions essential for the generation and maintenance of urban life to achieve the desired outcomes (Jacobs, 1961).
J14,
-. 3
Figure 4: lDuring summertime in New
Y
ork, free yoga classes are offered as part of a multitude of recreational activities(Habtat New York, 2016).
The first condition stipulates that districts should be mutifunctional in terms of attractors. The idea of a monocentric city limits the diversity of potential interactions between people from multiple backgrounds. Whereas polycentricism provides a location where people with diverse purposes seek common facilities. The benefits of these diverse interactions become compounded as primary uses are combined in a manner that attracts people at different times of the day (Viton). This, according to Jacobs, can lead to positive local economic impact. As we will see in the coming chapters, Kendall Square is a prime example of this monocentric planning. Districts
that are planned for the sole purpose of offices will likely only provide the area with leisure facilities for those that are present during office hours; 9 am to 5 pm. Afterhours will likely see a drastic decrease in human activity, whereas the presence of secondary function, such as caf6s and theaters, will likely attract more visitors and local residents, see figure 4 (Jacobs, 1961).
The second condition pertains to the size and shape of block. Jacobs theorized that large rectangular blocks, much like those common in big cities such as New York, result in an ineffective mix of use and people. As can be seen from the figure 5, large rectangular blocks result in sidewalks that intersect infrequently, which stymie the chances of diverse interactions (Jacobs, 1961).
17
Figure 5: Large block, such as those found in New York impede foot traffic and interaction frequency (Jacobs, 1961).
Conversely, presence of small block increases the likelihood of meandering pedestrians to converse over a coffee at a sidewalk caf&. More interestingly, as Jacobs put it, these smaller blocks also urge cars to slow down-if not discourage their presence entirely-which is likely to increase pedestrian activity due to street safety. Figure 6 elucidates the benefits of smaller streets blocks.
27
Figure 6: Conversely, small blocks offer multiple avenues through which pedestrians can socially run into one
another (Jacobs, 1961).
The needfJr aged building is the third condition prescribes by Jacobs to increase urban
vitality. According to her, old buildings are key for the growth of streets and districts. By her definition, old buildings are those of the "plain, ordinary, low-value old buildings, including some rundown buildings" in addition to newly renovated and re-appropriated real estate. By contrast, if a development area is filled with only new construction, the area will only thrive with residents and enterprises that can afford the high cost of new construction. By ensuring a good mix of new and old construction, planners can assume flourishing diverse districts supported by high-yielding, middle-yielding, low-yielding and no-yielding enterprises as well as high-rent, mid-rent and low rent residential tenants (Jacobs, 1961). To support her theories, she observed that the large-scale developments in New York (in the sixties) did not change over time nor adapt to the surrounding environment, whereas old building helped cultivate new primary uses in neighborhoods (start up companies tended to start in and grow in old, low-rent buildings) (De Nadai, Staiano, Larcher, Sebe, Quercia, & Lepri, 2106).
The final ingredient to realizing Jacobs's conditions is the need for concentration. Population density is an important measure for understanding cities. By definition it is the number of people per square unit of measure. Jacobs argues that neighborhoods with high population density benefit a city economically and culturally. She theorizes that neighborhoods,
which increase safety, economic vitality and prosperity, are those with high population densities. "...it still remains that dense concentrations of people are none of the necessary conditions for flourishing city diversity. And it still follows that in districts where people live, this means there must be a dense concentration of their dwellings on the land preempted for dwellings." Finally, she stressed that the mutual exclusivity of all four conditions: density alone cannot foster urban diversity, and mixed land use would not flourish in areas with low density and big blocks
(Jacobs, 1961).
Contextualizing Jacobs' Theories
Early Attempts
Recently, the large-scale datasets, such as those available from cell phone data networks has opened new possibilities for studying city dynamics at granularities that were previously not attainable. This data has allowed researchers to examine mobility patterns of city dwellers (Gonzales, Hidalgo, & Barabasi, 2008), to map functional uses, to identify places that play a major role in the life of citizens (Isaacman, et al., 2011), to compare cities based on spatial similarities and differences (Louail, et al., 2014) and to predict socio economic indicators such as crime (Bogomolov, et al., 2015) (De Nadai, Staiano, Larcher, Sebe, Quercia, & Lepri, 2106). In the latter effort, predicting crime, the researchers were able to validate Jane Jacob's observations regarding crime. Jacobs hypothesized that people diversity as well as visitors in a neighborhood increased the likelihood of natural surveillance, which in turn reduces the crime rate in the surrounding area. The constant presence of watchful eyes moving around becomes a deterrent for crime.
Urban sociologist Kevin Lynch proved that there is a strong impact of the geographical environment (features of an area) and the routes that individuals choose to navigate the area
(Lynch, 1960). Subsequent efforts validated his findings using a web application that crowd-sources the collective "mental images" that Londoners have of their city. The findings from this study went on to show that areas that suffer from social problems, bad living conditions and crime were not constituents of the mental images painted by residents (Quercia, Pesce, Almeida,
& Crowcroft, 2013). These findings echoed Lynch's theory that navigable cities are more
recognizable.
Further attempts were made at classifying urban areas based on visual cues. For example, (Quercia, Pesce, Almeida, & Crowcroft, 2013) investigated the urban elements, which locals use to assess the safety, prosperity, and attractiveness of streets using similar crowdsourcing approaches via web applications. A similar approach leveraged social media data from Flicker and Foursquare to assess the walkability of neighborhoods.
This approach used the time of day when photographs were taken and key words used to tag streets as a proxy to whether a street is walkable or not (i.e., walkable streets were tagged with walkability-related words, and safe streets were pictured during different times of day as well as nighttime) (Quercia, Aiello, Schifanella, & Davies, 2015).
Recent Attempts
De Nadai went beyond assessing the safety of roads and looking at crime and conducted a comprehensive validation of Jacobs' four conditions for urban vitality. This effort leveraged 6 primary data sets: Mobile phone activity, OpenStreetMaps, Census data, land use data, infrastructures and Foursquare data (De Nadai, Staiano, Larcher, Sebe, Quercia, & Lepri, 2106). Mobile phones are used as a proxy for human activity. Call records are generated every time a cell tower delivers a communication through the network from a cell phone device. These call records include date pertaining to the time, tower location, and Internet activity. For the study,
they focused on (passive) Internet activity, as mobile phones are more likely to be connected to
the Internet for background traffic and push notifications, regardless of direct activity.
In addition, De Nadai used OpenStreetMaps (OSM) used to construct the virtual
abstraction that visualized the specific case study. Information pertaining to the population
(Census) and building (Infrastructure) was gathered from the Italian National Institute for
Statistics (ISTAT). Land use data was gathered from the Urban ATLAS European projects,
which provides satellite images that, categorize cities into 20 classes (such as continuous urban
fabric and agriculture areas). Lastly, Foursquare data was used to observe the locations and
categories of POIs that people frequent through a given day. The findings from this work showed
that Jacobs's four conditions for maintaining a vital urban life held for Italian cities, as they held
for the case of Seoul, Korea and in the context in which Jacobs hypothesized. The results found
that simple static and structural fixtures explain the variability of district activity (De Nadai,
Staiano, Larcher, Sebe, Quercia, & Lepri, 2106).
Table 1: District Size (De Nadai, Staiano, Larcher, Sebe, Quercia, & Lepri, 2106) City #Districts Size (avg) Population (avg) Bologna 23 3.34 15.918 Florence 21 2.89 16.633 Milan 85 1.72 14551 Palermo 43 2.01 15.075 Rome 146 3.24 17.312 Turin 56 2.00 15.543
With regards to the size of a district, De Nadai et al. specify that it is a loose constraint,
and suggest that districts be defined in which ever way is more appropriate. They verified that
districts from their datasets cover an approximate average area of 2.5 Km2 with and average
population density of 10,000 people per km2. Table 1 reflects these findings. "Jacobs did not
define any strict criterion concerning district size: she simply proposed that the edge of an
administrative district should not exceed 2.4 km, and that each district should have a minimum
Jacobs's Four Conditions for Urban Vitality
Mixed-land use
According to De Nadai et al., "Mixed land use matters only in cities in which functional uses were historically separated." Their findings show that mixed land use neither contributes positively nor negatively to the urban vitality in a district. In Milan for example, city largely separated by functional areas, vitality was experienced in the mixed districts only. More interestingly though, their results showed that land use mixes with more third places had the highest beta coefficients. Daily attractors, such as supermarkets, were important; however third places were more so correlated with activity density. 3rd places are defined as pubs, cafes and
restaurants or "public places in which people can hang out [with] good company and lively conversations, putting aside the concerns of home and work (their first and second places)"[30].
Small Blocks
De Nadai et al. report that block size does not greatly impact urban vitality, as super-blocks do not exist in European cities (such as Milan and Rome) as they do in American cities (such as New York and San Francisco). Their findings, however, do show that the density of intersections matters greatly. In fact, vibrant areas are those with densely packed streets, which facilitate pedestrian movement and slows down traffic [9]. This is what Jacobs refers to as
sidewalk ballet, that, in addition to facilitates vibrant areas (through countless pedestrian
interactions), they build communal trust and perceived safety in these urban areas. Kids playing in the streets, unattended street vendors, and people walking their dogs are all images that come to mind when thinking about safe and livable areas. One way of making this happen is through areas with dense intersections.
Aged Buildings
Neighborhoods with a healthy mix of aged buildings are attractors to what the likes of Richard Florida labels as "high bohemians". These metropolitan areas are more likely to be economically developed; have communities that offer an abundance of mixed-use housing and co-working spaces; are densely packed with innovative companies, as well as learning institutions; offer a wide range of amenities where city dwellers can go to after work hours; and are transit friendly by making everything accessible either by walking or public transport. They are also geographic areas where leading institutions and companies cluster next to start-up companies, business incubators, and accelerators (Katz & Wagner, 2014).
According to (Katz & Wagner, 2014), compact, amenity-rich enclaves in urban cores are becoming the prime choice where young talented workers choose to congregate and co-locate. In order to leverage the abundance of this widely available talent, key companies in knowledge intensive industries are locating their facilities in close proximity to other firms, research labs and universities in order to facilitate the practice of "open innovation" (Katz & Wagner, 2014).
As Jacob explains it, neighborhoods with aged buildings tend to have diversified local economies. The presence of buildings of varying age and conditions, ranging from high-end construction to rundown old buildings with a mix of plain ordinary ones, attracts both high-earning enterprises as well ordinary and innovative ones. This was not the case in the past. Jacobs claims, "in Miami Beach, where novelty [were] the sovereign remedy, hotels ten years old are considered aged and are passed up because others are newer" (Jacobs, 1961).
They conclude that mixing of buildings from different eras in the European context is not as important as it is in the American context. This is the result of centuries of preservation that resulted in districts that are defined by age. Because the case study we selected contains mostly
new development, we argue that measures relating to the age of building do not apply to this work.
Density
Richard Florida states that density and building height are not the key ingredients in fostering urban vitality and innovation. He claims the -this rush to density: this idea that density creates economic growth" is not the way to creating livable areas, see figure 7. Florida highlights the importance of creating "real, walkable urban environments that stir the human spirit. Skyscraper communities are vertical suburbs, where it is lonely at the top." He maintains that the ideal density that fosters urban vitality is that describes by Jacobs.
Figure 7: Richard lorida that a Nertical drie for density is not the solution to fostering urbai NitalitN. Rather, a caritO
mix of diverse residents and workers living in a walkable environment is key (Yeung, 2016).
Jacobs's final condition for urban vitality is the needfor concentration, or what De Nadai et al. refer to as dense concentration of both buildings and people. Their results show that the most impactful factor that adds to the vitality of cities in the Italian context is office workers. They report that office workers have the highest beta coefficient under the density variables that contribute to vitality. They surmise that this is a reasonable finding as the first three conditions (mixed-land use, small blocks and aged buildings) have impact of the urban vitality contributed
by residents, whereas the need for concentration impacts urban vitality by means of the urban
dwellers in the area for the purpose of work.
Vacuums
As a warning, Jacobs discusses the dangers of massive single uses in cities as they form
borders, which can lead to destructive neighborhoods. She refers to the railroad tracks as a classic example of active borders, as they came to stand, long ago, for social borders-"the other side of the tracks". As such, the economic prosperity of a district lying on one side of the tracks might do better than the district of the other side, however, the areas that are most negatively impacted are those typically next to the tracks (Jacobs, 1961). To this extent, De Nadai et al. observe that being close to highways generally end up being detrimental to the urban vitality of a neighborhood. See figure 8 (De Nadai, Staiano, Larcher, Sebe, Quercia, & Lepri, 2106).
Figure 8: summary of the most important variables that impacts each of the conditions Jacobs referred to in the Death
and Life of Great American Cities (De Nadai, Staiano, Larcher, Sebe, Quercia, & Lepri, 2106).
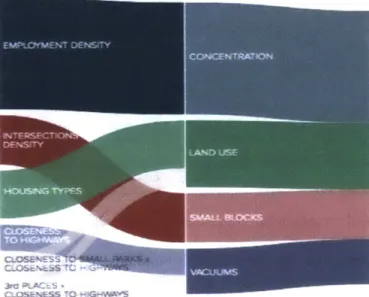
As can be seen, employment density impacts Concentration; housing types, proximity to small parks and third places impact Land Use; interaction density impacts Block Size: and Vacuums
are impacted by proximity to highways. As we did with the impacts of aged buildings, we will ignore all contributions from vacuums, as there are none in the areas under study in this work.
Urban Computational Platforms
Recent attempts at creating software solutions that facilitate decisions regarding urban planning have focused on a variety of topics raging from walkability of neighborhoods to energy usage of buildings. The CityScope platform for example is a tangible collaborative decision support system designed to facilitate collaborations between stake-holders of varying levels of proficiency with technology and domain knowledge in their interaction within the contexts of urban planning. The goal is to model the complex systems of city infrastructures and the behaviors of these systems along with their interdependencies in interactive tangible interfaces in order to assists stakeholders in designing and predicting future scenarios (Larson, Reinhart,
Alfaris, & Al-Wabil, 2014).
The CityScope platform is designed to utilize a tangible user interface along with a computational platform to support collaborative city planning. The platform provides a tangible interface through a modeling environment that supports various dynamic visualization and interaction capabilities (Larson, Reinhart, Alfaris, & Al-Wabil, 2014). The platform has previously been used to analyze urban (CitySchema/CityScope-Riyadh), transportation (BAR project), and energy systems. The customizable aspect of this platform makes it a favorable tool in workshop settings. It can be used for: 3D physical model, 3D projection mapping, static information display, real time observatory model and urban intervention simulator (Larson,
Reinhart, Alfaris, & Al-Wabil, 2014).
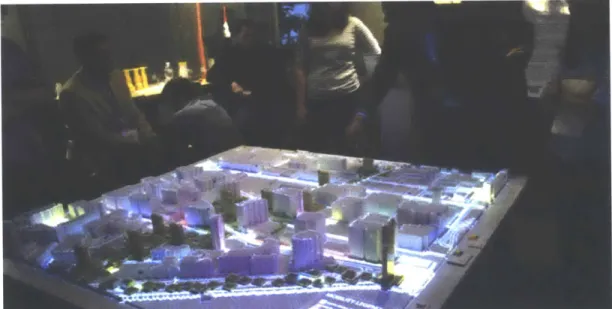
The 3D physical model is a useful way to conceptualizing city plans using Lego bricks to rapidly study and iterate on a series of alternative designs. The projection mapping utilizes
projectors to illuminate each surface of the physical model: "one to project directly down on the
ground and roof planes of a physical model, one projector for each of the four vertical surface orientations (north, south, east, and west) (Larson, Reinhart, Alfaris. & Al-Wabil, 2014)". The platform offers the flexibility of correcting the projections required for 3D mapping on to curved surfaces. The size and scale of the platform can easily be modified by networking multiple city scope platforms together. The static information mode can be used to project data such as land use patterns, GIS data, and other information from existing datasets onto the physical model. Similarly, multiple real-time data streams can be projected onto the physical model, such as flows of traffic, energy, water, and social media activity (Larson, Reinhart, Alfaris, & Al-Wabil,
2014).
Figure 9: City Scope can be used to simulate a wide variety of urban interventions, such as the introduction of shared-use
autonomous vehicles, new roadway and pathway designs, or the impact of new developments on pedestrian and vehicle movement (Larson, Reinhart, Alfaris, & Al-Wabil, 2014).
CityScope tools are designed for early-phase planning, allowing non-expert stakeholders to engage with high-level parameters that frame urban development and infrastructure scenarios, see figure 9. Stakeholders interact with models, allowing them to quickly and intuitively understand constraints, challenges., and possible solutions for various development scenarios
(Larson, Reinhart, Alfaris, & Al-Wabil, 2014), as will be presented in future chapters. According to Larson et al., "this tool is built to inform stakeholders, build consensus, and ultimately streamline the process of community engagement throughout major development projects." The platform can act as an urban data observatory and intervention evaluation tool by utilizing the key features of the platform (Larson, Reinhart, Alfaris, & Al-Wabil, 2014). This research focuses on the urban intervention simulation mode, which can be used to simulate a wide variety of urban interventions, such the impact of new developments on district vitality.
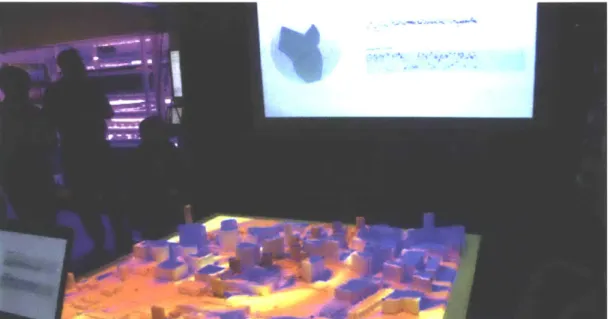
Figure 10: CityScope used GIS data and algorithms to create a voxelized, 3-dimensional representation of an existing urban area in Kendall Square, Massachusetts (Larson, Reinhart, Alfaris, & AX-Wabil, 2014).
Initially, CityCope began as a static platform that used Legos as a way of rapidly ideating different city plans. The research team selected Legos for the range of design flexibility, as a single Lego brick can represent a single residential unit and scaled up accordingly (Larson, Reinhart, Alfaris, & Al-Wabil, 2014). In addition to the scalability factor, the familiarity of Legos offered another aspect that made these design tools a viable option. As the limitations of this static approach became apparent, the researcher then began to make this design tool more flexible. By invoking projection mapping along with visualization software, such as Processing,
the researchers were able to push the application of the software tool to represent a physical city while using actual data to represent different aspects of that city. CityScope used GIS data and algorithms to create a representation of existing neighborhoods, see figure 10. Information layers included satellite imagery, solar insolation, wind flows, social media activity, mobility systems, and business intensity (Larson, Reinhart, Alfaris, & Al-Wabil, 2014).
The next iteration of the platform transformed the static projection mapping onto a canvas for land use planning, allowing rapid prototyping with immediate evaluation, see figure
I1. The platform evolved to further project onto multiple sides of 3D objects, such as the facades
of design spaces (Larson. Reinhart, Alfaris. & Al-Wabil, 2014). Subsequently, the platform evolved to work with other platforms to evaluates operational energy use, embodied energy use. walkability and daylight availability throughout neighborhoods (Larson, Reinhart, Alfaris, &
Al-Wabil, 2014).
Figure 11: CityScope Markil Scout Table, using static projection mapping onto a canvas for land use planning, allowing rapid prototyping with real-time evaluation (Larson, Reinhart, Alfaris, & Al-WN'abil, 2014).
Case Study
Kendall Square Profile
Kendall Square, is bounded to the north by Broadway and Main Street, the Charles River
to the east, and the Boston & Albany Railroad tracks to the west, as shown in figure 12. It is
almost entirely occupied by the MIT campus. The Kendall Square transit stop connects the
district to the rest of Cambridge and Somerville as does the Longfellow and Harvard bridges
connect it to Boston. The major recreational resource is the Charles River Reservation
(Cambridge Community Development Department, 2013).
'J"rt e, 20A 3)
4.4
r- Ip L rZ
/, %
In the last three decades, Kendall Square has been transformed from a former industrial
district to one of the world's leading centers for biotech research and innovation. The Square has
seen the accompanying growth of hotels, restaurants, and shops that serve the area's cluster of
major developments occupy part of the Kendall Square area, including Cambridge Center, Cambridge Research Park, Technology Square, and One Kendall Square. Area 2 contains the core of MIT's academic and research facilities in addition to various student campus-housing options. The residents in Kendall Square largely consist of undergraduate and graduate student dormitories and fraternities (Cambridge Community Development Department, 2013).
Next, we extracted statistics of the market profile for the area to form the general spatial abstraction of the modeling platform that represent the district, such as total area, residents, students, working population and number of registered businesses in the area. For Clarity, these numbers are tabulated below (Cambridge Community Develpment Department), see table 2.
Table 2: Kendall Square Market Profile Summary
Kendall Square MIT
Total area 1.3 kMA2
Employment 52,000 Ppl (.5 mile radius)
Students 12,000 Ppl
Population 6815 Ppl (.5 mile radius)
# of Businesses 140 Places
The registered businesses include architectural, engineering, biotech, energy, consulting, financial, government, health/shopping, restaurants and residential registered firms. As can be seen form these numbers the number of people working in the area far outweigh the number of residents. The area has recently been rezoned for the addition of over 1 million square feet of new space on a series of underutilized properties between Main Street and Memorial Drive. However, these plans have not materialized (Cambridge Community Develpment Department).
Figures 13 and 114 illustrate the land use patterns in Kendall Square. As can be seen in the legend (figure 14), land use categories are divided into the following categories: residential, residential with ground floor commercial, mixed use, commercial and industrial, and other (such
as health, education, government, etc.) As will be shown in the next section, this land use taxonomy will be used to label the tags for the Lego blocks.
ut,~ Bh STO~S -c~
~
lh~kt-.
t~ C--- BTQ-d ay 'InI CD as 01A Q40Figure 13: The break down of Kendall Square (and surrounding area) by land use category (Cambridge Community Development Deprtment, 2015).
Residential 1 - 3 units
4 - 25 units 26 -534 units
Assisted Living/Boarding Houses Education Residential
Residential with ground floor commercial 1 - 3 units
4 - 25 units 26 - 492 units
Mixed Use, with primary use first k Education with Commercial
S Commercial with Residential
E Residential with Commercial Commercial and Industrial
Q General Commercial LJOffice Off/ceIR&D Industrial Utility Other Categories Transportation Higher Education Education Health Charitable/Religious SGovernment Operations Public Open Space
SPrivately-Owned Open Space LI Cemetery
_ Vacant Land
Ub IA-1 Os
.IJD4-BA-
PUD-2
IA-1
PD-4C
PUD-4C
C-A-1
PU-44PUD-3A
PUDJ2
C--A
PUD-KS
BA
IA-I PUD-KS3B
C-3BMXRIPUD-5
IB PU-5 to- C-3 C-3B0-XR 9inMXRi C-3BBMXRPUD-5
UPUD-5 BA 2j MXD CC-3 -1-5Figure 15: Zoning districts were used to identify the maximurn height for buildings in Kendall Square, which will later be
used to calculate used to calculate "'Building Types" (Cambridge Community Development Deprtment, 2015).
Harvard Square Profile
Home to Harvard University, this square is an international destination, mixing history
and learning with contemporary arts and entertainment. A unique blend of restaurants, shops and
cultural offerings draws residents, students, professionals and visitors. With approximately
900,000 square feet of retail space. Harvard Square functions as a regional center for shopping in
an urban, pedestrian-friendly context. The character of Harvard Square reflects three and a half
centuries of growth and change. At the center is Harvard Square Station, one of the busiest on
the Red Line with bus links both underground near the trains, and along Massachusetts Avenue
next to Harvard Yard and the Cambridge Common. Figure 16 below show the geographical location of Harvard Square (Cambridge Community Development Department, 2015).
c;K
'ak
Par~
c
Figre '6 egahca aoto HradSureatecntri avr Sqar Sat,j
one
o the busfs ont' e/ambidg
Comn(abig onity Deeomn Dp
rtmnt
20,3).Ta> 3 aradSqae at PrJl m r
T\ta area
<.47
m^2
/7,
er'
Figure 16: Geographical layout of Harvard Square At the center is Harvard Square Station one of the busiest on the Red
Line with bus links both underground near the trains, and along Massachusetts Avenue next to Harvard Yard and the
Cambridge Common (Cambridge Community Development Department, 2013).
Next, we extracted statics of the market profile for the area to form the general spatial
abstraction of the modeling platform that represent the district, such as total area, residents, students as well as the working population. For Clarity, these numbers are tabulated below
(Cambridge Community Development Department, 2015) see table 3.
Table 3: Harvard Square Market Profile Summary
Harvard Square
Total area 1.47 kmA2
Employment 17,860 Ppl (.5 mile radius)
Students 24,357 Ppl
Population 16,978 Ppl (.5 mile radius)
In contrast to Kendall Square, the number of people working in the area is close to the number of residents living in Harvard Square. Also, the number of registered business in the area are more than twice that of Kendall Square. Figures 17 and figure 14 illustrate the land use patterns in Kendall Square. Similar to Kendall Square, land use categories are divided into the following categories: residential, residential with ground floor commercial, mixed use, commercial and industrial, and other (such as health, education, government, etc.)
Note***: Initially, the data sets representing both Kendall Square and Harvard Square were gathered from multiple sources. Since the initial data set for Harvard Square was not as complete as the data gathered for Kendall Square, I used the Market Profile data set for both Kendall and Harvard Square, However, both reports list the population as well as the workplace population as the population in a .5 mile radius. As a comparison, the market profile report lists the number of residents in Kendall Square as 6815, whereas the neighborhood profile for the general Area2/MIT reports the number of population as 5057.