HAL Id: hal-01812755
https://hal.archives-ouvertes.fr/hal-01812755
Submitted on 6 Nov 2018
HAL is a multi-disciplinary open access
archive for the deposit and dissemination of
sci-entific research documents, whether they are
pub-lished or not. The documents may come from
teaching and research institutions in France or
abroad, or from public or private research centers.
L’archive ouverte pluridisciplinaire HAL, est
destinée au dépôt et à la diffusion de documents
scientifiques de niveau recherche, publiés ou non,
émanant des établissements d’enseignement et de
recherche français ou étrangers, des laboratoires
publics ou privés.
A new record excited state 3 MLCT lifetime for
metalorganic iron( ii ) complexes
Li Liu, Thibaut Duchanois, Thibaud Etienne, Antonio Monari, Marc Beley,
Xavier Assfeld, Stefan Haacke, Philippe Gros
To cite this version:
Li Liu, Thibaut Duchanois, Thibaud Etienne, Antonio Monari, Marc Beley, et al.. A new record
excited state 3 MLCT lifetime for metalorganic iron( ii ) complexes. Physical Chemistry Chemical
Physics, Royal Society of Chemistry, 2016, 18 (18), pp.12550-12556. �10.1039/C6CP01418F�.
�hal-01812755�
PCCP
RSC
Publishing
ARTICLE
Cite this: DOI: 10.1039/x0xx00000x
Received 00th January 2012, Accepted 00th January 2012 DOI: 10.1039/x0xx00000x
www.rsc.org/
A new record excited state
3
MLCT lifetime for
metalorganic iron(II) complexes
Li Liu,
aThibaut Duchanois,
bThibaud Etienne,
cAntonio Monari,
cMarc Beley,
bXavier Assfeld,
cStefan Haacke,
*aPhilippe C. Gros
*bHerein we report the synthesis and time-resolved spectroscopic characterization of an homoleptic Fe(II) complex exhibiting a record 26 ps 3MLCT lifetime promoted by benzimidazolylidene-based ligands. Time Dependent Density Functional molecular modeling of the triplet excited state manifold clearly reveals that, at equilibrium geometries, the lowest 3MC state lies higher in energy than the lowest 3MLCT one. This unprecedented energetic reversal in iron complexes series, with the stabilization of the charge-transfer state, opens new perspectives towards iron made excitonic and photonic devices, hampering the deactivation of the excitation via metal centered channels.
1. Introduction
The exploitation of the photophysical and photochemical properties of transition metal complexes (Pt, Ir, Ru) have been the focus of much attention due to the ability of these compounds to promote energy transfer from their electronic excited states.1 Platinoid metal complexes have been the most used due to their ideal photophysical properties spurring their implementation in OLEDs2 or DSSCs3 devices with high efficiencies and stability. However these strategic metals are expensive, scarce and can exhibit some degree of toxicity. As a consequence, the development of light-responsive compounds from cheap and environmentally benign metal-complexes is critical to preserve natural resources and reduce the environmental impact of this potential branch of chemical industry. In this context iron-based complexes can be considered as promising candidates for such a transition.
However, the replacement of ruthenium by iron is extremely challenging. Due to a smaller ligand field splitting, Fe-pyridine complexes are rather known as photo-induced spin-transition materials,4 and are used as such in the research area of molecular magnetism.5,6 The low-to-high spin transition is due to an ultrafast non-radiative deactivation of the 1,3MLCT states into the low-energy metal-centered quintuplet 5T
2,7 cutting short on applications of Fe-pyridine requiring higher free energies.
Recently it has been reported that the use of N-heterocyclic carbenes (NHC) ligands in complex C1 (Figure 1) can prolong the 3MLCT lifetime (9 ps).8 This was rationalized by quantum chemistry calculations showing that in these compounds the 3MC and 5T
2 states are up-shifted in energy, but still below the
3MLCT. The introduction of σ-donating carbene ligands
coordinating Fe is held responsible for these significant changes in the electronic structure. An heteroleptic Fe(II) complex featuring mesoionic triazolylidene bidentate ligands and a 3MLCTlifetime as long as 13 ps while also promoting the red-shift of the absorption band was also reported.9 However the coordination by both bis-carbene ligands resulted into an extremely low oxidation potential for the FeII/FeIII couple (-0.35 V vs the Fc/Fc+) prohibiting the possible ground state regeneration by usual redox mediators (-0.2V) in a photoelectrochemical application.
Our group recently improved the 3MLCT lifetime up to a record 16.5 ps from a homoleptic carbene-based complex C2 bearing carboxylic groups (Figure 1).10 In addition, the photocurrent generation in a dye-sensitized solar cell (DSSC) from this sensitizer was demonstrated for the first time, albeit with a low power conversion efficiency. Very recently, the Wärnmark group working on the same complex11 published an important additive to this work by demonstrating that the injection into TiO2 semiconductor can occur efficiently from the 3MLCT state.
ARTICLE
PCCP
Thus the improvement of 3MLCT lifetime in iron complexes is atopic of high interest for their further development as photo-sensitizers applicable in photo-chemical energy conversion processes, and organic electronics at large.
Starting from the idea that an increase of the delocalization of the MLCT frontier orbitals towards the periphery of the organic ligand should contribute to better stabilize the 3MLCT state, the new complexes C3 and C4 have been designed (Figure 1) where iron was coordinated by benzimidazolylidene-based ligands. Herein we report the synthesis and characterization of these new complexes and a new record 3MLCT lifetime of 26 ps.
1. Results and Discussion
1.1. Synthesis
The synthesis of complexes C3 and C4 required the preparation of respectively imidazolium salts 3 and 4 that were obtained by controlled methylation of compounds 114 and 215 (see supporting information, SI). The coordination was accomplished by reaction of the appropriate imidazolium salt with FeCl2 in DMF in the presence of t-BuOK as deprotonating agent affording the targeted complexes C3 and C4 (Scheme 1). Complexes C1Erreur ! Signet non défini. and C210 were also prepared for comparison purposes. N N N Me N N Me N N N Me N N Me Fe2+ C1, R=H C2, R=COOH N R N N Me N N Me N R N N Me N N Me Fe2+ C3, R=H C4, R=COOH R R
Figure 1. Chemical Structures of Iron complexes, the counter anion is PF6
-1) FeCl2 (0.5 equiv) 2) t-BuOK (4 equiv) DMF, r.t., 10 min 3) KPF6, H2O N N N N N R 3, R=H 4, R=COOMe Me Me N N N Me N N Me N N N Me N N Me Fe R R C3, R=H C4, R=COOH 2+, 2PF 6 -+ + 2 PF6 -N Br Br R=H or COOH N H N (3 equiv) Cs2CO3 (4 equiv) CuI (0.4 equiv) DMF, 140°C, 48 h N N N N N R R 1, R=H 2, R=COOH MeI (10 equiv) DMF, reflux overnight
Scheme 1. Synthesis of complexes C3 and C4
1.2. Electronic and electrochemical properties
The complexes were characterized by UV-vis spectroscopy (Figure 2) and electrochemistry (Table 1).
Figure 2. Absorption spectra of complexes in acetonitrile
For all the complexes, the absorption spectra are composed of three bands embedding individual electronic transitions of different nature. The intense band near 300-350 nm corresponds to −* transitions in the ligands. These bands are expectedly particularly intense in case of C3 and C4 due to the phenyl rings of benzimidazolylidenes (BIm) moieties.
At longer wavelengths, the complexes exhibit two distinct band families corresponding to MLCT transitions that are subjected to significant shifts and change in shape as a function of the ligands. The bands in the 360-390 nm range are related to the carbene-Fe MLCT transition10 that is strongly affected in energy by switching from imidazolylidene (Im) to benzimidazolylidene (BIm).Indeed the absorption maxima for complexes C3 and C4 are blue-shifted by 20 nm compared with those of C1 and C2.
Table 1. Photophysical and electrochemical properties of complexes
abs-max (nm)
((M-1.cm-1))a
Eox
(FeIII/FeII)
(V/SCE)b Ered1 (V/SCE) ΔE (eV) c C1 287 (31400) 393 (9000) 460 (15900) 0.80 (rev) -1.95 (irrev.) 2.75 C2 302 (19000) 394 (7000) 520 (16200) 0.85 (rev) -1.35 (irrev) 2.20 C3 310 (55000) 360 (9000) 440 (12500) 1.04 (rev) -1.80 (irrev) 2.84 C4 325 (42200) 370 (5000) 501 (12800) 1.13 (rev) -1.23 (irrev) 2.36 a Measured in CH
3CN at 25 °C. bFirst oxidation potential. Potentials are quoted
vs SCE. Under these conditions, E1/2 (Fc+/Fc) = 0.39V/S.C.E. Recorded in CH3CN
using Bu4N+PF6- (0.1M) as supporting electrolyte at 100 mV. s-1. c
Electrochemical band gap (E =Eox –Ered1)
The same observation can be made for the MLCT bands at lower energy in the 450-600 nm range involving the central pyridine ring that are blue shifted by 60 nm in BIm containing complexes.
This blue shift is clearly in agreement with the electron-accepting effect of the phenyl ring in BIm and in line with cyclic voltammetry measurements (Table 1) showing an increase of the FeII/FeIII oxidation potential going from C1 (0.8 V) and C2 (0.85 V) complexes to C3 (1.04 V) and C4 (1.13 V).
Finally, as already observed for the Im-based complex C2,10 the functionalization of the central pyridine nucleus with the carboxylic groups promotes a notable red-shift of the band at lowest energy in BIm-based complexes moving from 440 to 500 nm i.e. from C3 to C4 respectively.
1.3. Photophysics
In order to get further insights into the impact of the BIm ligand on the photophysical properties of the complexes, ultrafast photophysics of C1, C2, C3 and C4 were investigated in acetonitrile using transient absorption spectroscopy (TA). The TA data reveal that the excited state processes happen to follow the same scheme for all iron complexes (data not shown). As an example, Figure 3 shows a selection of transient differential spectra of C4 in acetonitrile after 515 nm excitation within the first 600 fs (Figure 3A) and up to 52 ps (Figure 3B).
Figure 3. Selected transient differential spectra of C4 in MeCN excited at 515nm.
(A) Time delays <600fs; (B) Time range <52ps. After initial blue-shifts in the first 200-300 fs, the ESA bands do not evolve spectrally, but decay until 100ps. A 30nm region around excitation wavelength is disregarded due to pump scattering.
The intense negative signals in the 450-520 nm range and at λ < 350 nm are due to ground state bleaching (GSB). In the visible domain, the GSB band coincides perfectly with the ground state absorption maximum (Figure 2). The positive bands in the 350-450 nm area and above 550 nm reveal two excited state absorptions (ESA). Within the first 200fs, both ESA bands display 20-50 nm blue-shifts, and their shapes change significantly between spectra until 160fs. After 600fs, the differential spectra decay until 100 ps without noticeable spectral shift.
The long-lived spectral feature with two ESA bands is very similar to the ones reported for the 3MLCT states of C1Erreur ! Signet non défini. and C210 in MeCN. The spectra reported in Figure 3B are different from the characteristic ESA of the 5T
2 quintuplet state observed for example in Fe(tpy)2, featuring a 10 nm narrow ESA in the near-UV and zero absorption in the red part of the spectrum.8
Figure 4A shows kinetic traces at characteristic wavelengths (651 nm black, 556 nm red, 449 nm blue and 371 nm pink) with
their fits (solid lines). The spectral blue shift is characterized by a fast initial decay at 650 nm and a slow rise at 556 nm and 449 nm in the first 0.5 ps.
Figure 4. (A) Kinetic traces (open symbol) of C4 with their fits (solid lines) at
characteristic wavelengths and (B) Decay-Associated difference Spectra generated by Global Analysis with one Gaussian and two exponential functions. 3MLCT
relaxes to S0 with 27ps lifetime as shown by the simultaneous recovery of ESA and
GSB. At <500fs, the fast component with 65fs lifetime is attributed to the relaxation of 1MLCT to 3MLCT and the thermalization of 3MCLT.
Note that both ESA and GSB traces decay with the same time constant, i.e. that the excited state decay directly fills the ground state, as already reported for other imidazole-based iron complexes.Erreur ! Signet non défini.,10
After correction of chirp and solvent contributions, we apply singular value decomposition (SVD) of data in order to filter out the spectral and temporal components that are above the noise level. These N components, N= 5 in our case, are retained for a Global Analysis (GA). All N traces are fitted simultaneously by a function with same time constants (see SI for details). Since fast components are very close to the Instrument Response Function (IRF, 60 fs), the first fitting component is chosen as Gaussian and followed by bi-exponential function. The decay-associated differential spectra (DADS) with their lifetimes are shown in Fig 4B. DADS3 shows the spectral feature of 3MLCT with two ESA bands, as identified in the raw data. The fit gives a 26 ps lifetime for the 3MLCT state.
In addition, the fitting suggests two sub-100 fs components. The DADS related to the IRF-related Gaussian function is most likely related to spurious, non-corrected solvent response. The 65fs-DADS is an approximation to the above described spectral blue-shift of ESA observed within the first 200 fs.
The above discussed spectral and temporal features combined with the lifetime determination by GA allow defining the following excited state reaction scheme for C4:
𝑀𝐿𝐶𝑇
+ 1 <𝐼𝑅𝐹→ {
1𝑀𝐿𝐶𝑇
𝑀𝐿𝐶𝑇
+ 3 65𝑓𝑠→ 𝑀𝐶𝐿𝑇
3 26𝑝𝑠→ 𝑆
0The reaction starts with a "hot" 1MLCT+ state since the transition is excited with excess energy, above the 0-0 energy of the GS – 1MLCT transition. It relaxes on time scales faster than 50 fs (instrument response function, IRF) on the 1MLCT surface and undergoes an ultrafast intersystem crossing into the vibrationnally excited manifold in 3MLCT.7d An effective lifetime of 65-100 fs is associated with this thermalization
ARTICLE
PCCP
process (see below). The vibrationnally relaxed 3MLCT staterecombines non-radiatively within 26 ps in C4.
The three other complexes were studied by TA spectroscopy under identical conditions (low excitation density, similar GSB levels). The spectral evolution is very similar to the one shown in Figure 4, with a double ESA structure, characteristic of the 3MLCT statesErreur ! Signet non défini. dominating the differential
absorption for delay times > 500 fs. The SVD traces are well described by the same kinetic fit function as C4, but with variations in the lifetimes.
Kinetic traces clearly showed a notable 3MLCT lifetime improvement switching from Im to BIm-based ligands without and with the acid group, respectively in Figure 5A and Figure 5B. The ESA and GSB kinetic traces have been normalized at 1ps, after the initial thermalization period, to facilitate comparison with the slower 3MLCT decay (solid black lines).
Figure 5. Kinetic traces of ESA decay (red) and GSB (blue) with their fits (solid black
lines), normalized at 1ps (A) C1 and C3 and (B) C2 and C4. The BIm-ligand extends the 3MLCT lifetime with and without –COOH acid group.
Table 2 presents the excited state lifetimes obtained by the GA as described above for all the complexes. As shown, C3 has a considerably increased 3MLCT lifetime (16.4 ps) compared with C1 (10 ps) clearly evidencing the positive effect of the BIm ligand and C4 benefiting from the carboxylic acid groups has the longest 3MLCT lifetime (26 ps) ever reported for a FeNHC complex in solution. As a general trend, the BIm ligand prolonged the 3MLCT lifetimes by more than 60 %.
Table 2. Excited state lifetimes for all iron complexes investigated by Global
Analysis Complex 1MLCT (fs) (3MLCT)+ (fs) 3MLCT (ps) C1 50±1 550±50 10±0.2 C2 20<IRF 130±40 16.5±0.7 C3 25<IRF 260±8 16.4±0.4 C4 15<IRF 65±10 26±1 1.4. Computational studies
The new dyes have been analyzed by means of density functional theory (DFT) and time-dependent DFT (TD-DFT) calculations. Solvent (acetonitrile) effects have been taken into account using a polarizable continuum method. Firstly, the most relevant singlet excited states responsible of the absorption spectrum have been characterized by means of natural transitions orbitals
(NTO),12 C4’s NTOs are represented in Table 3 while the ones of C2 dye can be found in our previous work.10
For the reader’s convenience we remind that NTOs can be considered as the optimal orbitals to describe an electronic transition in the TD-DFT formalism. In contrast with the Kohn– Sham molecular orbitals basis, with which many occupied– virtual orbital couples are required to describe an electronic transition, the NTO basis generally provides only one (or at maximum two) couples of orbitals to entirely represent all the physics underlying the transition.
Table 3. NTOs isodensity surface in C4a
(nm) (state number) fb s*sc oNTO vNTO 532(#5) 0.3 0.570 0.413 433(#9) 0.09 0.818
a Level of theory: HCTCH exchange correlation functional and 6-31+G(d,p)
basis set for all the atoms were used. b Oscillator strength (a.u.). c Weight of
the NTOs couples.
As it was the case for the C2 dye10 the low energy portion of the spectrum of C4 is dominated by MLCT transitions. In particular for the lowest transition the density is displaced from the iron atom to both the ligand and particularly in the pyridyl moiety. A significant density accumulation on the carbonyl unit is also observed; hence charge injection into a semiconductor like TiO2 should in principle be possible, since the molecules are grafted onto it through the carbonyl end. Remarkably and because of the symmetry of the complex the charge is almost equally transferred on both ligands.
In order to rationalize the photophysics of the most relevant dyes, we relaxed the geometry of the lowest 3MLCT and 3MC states for C2 and C4 dyes (Table 4). This means that we let the molecule evolve structurally into the respective potential energy minimum.
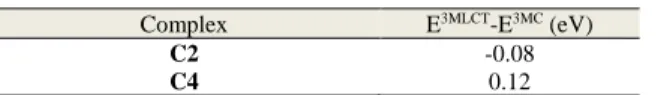
Table 4. Adiabatic energies difference between the 3MLCT and 3MC states
of C2 and C4 in eV.
Complex E3MLCT-E3MC (eV)
C2 -0.08
C4 0.12
As shown in Table 4, while the two states are almost degenerate (E = -0.08 eV) in case of C2,the 3MLCT state is found better stabilized than the 3MC state in C4 (E = 0.12 eV). This is the first example of such energetic reversal for an iron complex.13 Although the energy difference is still quite low, such that both 3MLCT and 3MC state can be thermally populated this observation may rationalize the longer life time of the C4 complex. Indeed the photophysical channel leading to the 3MC population and the subsequent deactivation now appears energetically less favorable. Furthermore, the energetic inversion between the two states is most probably coupled with a higher barrier on the potential energy surface connecting the two states, adding a further kinetic blockage.
In our previous paper,Erreur ! Signet non défini. we argued that the
increased 3MLCT lifetime of C2 as compared to C1 was due to an enhanced charge-transfer character induced by the COOH group. This argument is further supported by the effect of deprotonation that leads to a reduced (14 ps, unpublished result) lifetime due to the negatively charged COO- termination (see SI for details). Is a similar effect at work for the lifetime increase observed going from Im to BIm-complexes? To assess this problem we have analyzed the charge-transfer versus local nature of the excited states. Indeed, the more local a state will be the more favoured will be its recombination within the MC states. Although many factors may affect the excited state lifetime,14 some of them, like the excited state electronic structure, should be seen as more crucial in dictating the photophysics. Locality of the excited states has been calculated thanks to the S index recently developed by some of us.15 The former index is based on the overlap between ground and excited state electronic densities and is normalized by construction. Values close to 1.0 are characteristic of local transitions while values close to 0.0 indicate extensive charge transfer. Both C2 and C4 show MLCT states with relative high values of S 0.68 and 0.72, respectively. Such values are indicative of a poor charge-separation and with C4 displaying a slightly more localized excited state than C2 (about 6%), indicating that the electronic coupling argument does not explain the longer 3MLCT lifetime of C4.
2. Conclusion
In summary, a new homoleptic NHC-Fe(II) complex was synthesized, featuring 4 BIm and two pyridine Fe-coordinating ligands. When the pyridines are substituted with COOH groups, a record excited state lifetime of 26 ps is observed for the 3MLCT state. Calculations of the excited state structure of the substituted and the un-substituted compounds shows that in the former the 3MC state lies higher in energy than the 3MLCT, providing a clear explanation for the increased lifetime. The combined experimental and computational study thus opens new prospects
for the design of novel NHC-Fe(II) complexes with yet enhanced light-harvesting capabilities: A further increased 3MLCT lifetime and an absorption spectra optimized for the red wavelength region may come at hand soon.
3. Methods
3.1. Materials. Solvents and commercially available reagents were used as received. Thin layer chromatography (TLC) was performed by using silica gel 60 F-254 (Merck) plates and visualized under UV light. Chromatographic purification was performed by using silica gel 60 (0.063–0.2 mm/70–230 mesh). Compounds 116 and 217 have been prepared according to reported procedures.
3.2. Intrumentation. 1H (400 MHz) and 13C NMR (100 MHz)
spectra were taken on a DRX400 Bruker spectrometer at ambient temperature. The chemical shifts (δ), were calibrated by using either tetramethylsilane (TMS) or signals from the residual protons of the deuterated solvents and are reported in parts per million (ppm) from low to high field. High-resolution mass spectrometry (HRMS) data was obtained by using Bruker micrOTOF-Q spectrometer. UV-vis spectra were recorded in a 1 cm path length quartz cell on a LAMBDA 1050 (Perkin Elmer), spectrophotometer. Cyclic voltammetry was performed on a Radiometer PST006 potentiostat using a conventional three-electrode cell. The saturated calomel three-electrode (SCE) was separated from the test compartment using a bridge tube. The solutions of studied complexes (0.2 mM) were purged with argon before each measurement. The test solution was acetonitrile containing 0.1 M Bu4NPF6 as supporting electrolyte. The working electrode was a vitreous carbon rod (1cm2) wire and the counter-electrode was a 1 cm2 Pt disc. After the measurement, ferrocene was added as the internal reference for calibration. All potentials were quoted versus SCE. In these conditions the redox potential of the couple Fc+/Fc was found at 0.39V. In all the experiments the scan rate was 100mV/s.
3.3. Synthesis
Synthesis of ligand 3.To a solution of 116 (160 mg, 0.52 mmol)
in DMF (5 ml) was added iodomethane (0.32 mL, 5.2 mmol), the mixture was refluxed overnight. After cooling at room temperature, a saturated solution of KPF6 was added (10 ml), the precipitate was washed with distilled water and dried under vacuum affording 3 (290 mg, 95%): 1H NMR (200 MHz, CD3CN): δ = 9.68 (s, 2H), 8.64 (t, J = 9.2 Hz, 1H), 8.38 (dd, J = 6.7 and 2.2 Hz, 2H), 8.15 (d, J = 8.4 Hz, 2H), 8.06 (dd, J = 6.7 and 2.2 Hz, 2H), 7,87 (m, 4H), 4,28 (s, 6H) ppm. 13C NMR (50 MHz, CD3CN): δ = 146.3, 144.8, 141.1, 132.3, 129.4, 128.2, 127.7, 117.9, 115.0, 113.6, 33.8 ppm. HRMS (ESI) calcd for C21H19N5P2F12, m/z = 170.5820 [M-2PF6], Found 170.5832. Synthesis of complex C3. To a solution of 3 (300 mg, 0.48 mmol) in anhydrous DMF (3 ml) was added FeCl2 (30 mg, 0.24 mmol). Then tBuOK (170 mg, 1.5 mmol) was added and the mixture was stirred for 10 min at room temperature. A saturated solution of KPF6 was added (10 ml) and the precipitate was collected by filtration. The solid was purified by column chomatography eluting with a Acetone/H2O/KNO3(sat) = 5 :3 :1
ARTICLE
PCCP
mixture. The yellow fraction was collected and treated withsaturated solution of KPF6 (10 ml). After evaporation of acetone, the solid was filtrated, washed with distilled water and dried under vacuum affording C3 (46 mg, 20 %). 1H NMR (400MHz, CD3CN): δ = 8.54 (t, J = 8.7, 2H), 8.30 (d, J= 8.2 Hz, 2H), 8.25 (d, J = 7.9 Hz, 4H), 7.53-7.39 (m, 8H) 7.0 (d, J = 7.6Hz), 4H), 2.74 (s, 12H) ppm. 13C NMR (100MHz, CDCl
3): δ = 211.0, 154.6, 151.8, 140.2, 138.4, 125.0, 124.1, 111.8, 110.6, 107.0, 31.5 ppm. HR MS (ESI) calcd for C42H34FeN10P2F12, m/z = 367.1154 [M-2PF6], Found 367.1189.
Synthesis of ligand 4. 217 (300 mg, 1.17 mmol) was suspended
in acetonitrile (10 mL) and iodomethane was added (0.72 mL, 11.7 mmol), the mixture was refluxed overnight. After cooling at room temperature, a saturated solution of KPF6 was added (10 ml), the precipitate was washed with distilled water and dried under vacuum affording 4 (630 mg, 90%). 1H NMR (200 MHz, CD3CN): δ = 9.80 (s, 2 H), 8.57 (s, 2H), 8.42 (dd, J = 7.5 and 1.9 Hz, 2H), 8.07 (dd, J = 7.5 and 1.9 Hz, 2H), 7.87 (m, 4H), 4.29 (s, 6H), 4.15 (s, 3H) ppm. 13C NMR (50 MHz, CDCl
3): δ = 163.1, 147.7, 146.2, 141.9, 132.9, 130.1, 129.0, 128.4, 118.0, 115.7, 114. 5, 54.0, 34.6 ppm. HRMS (ESI) calcd for C23H21N5O2P2F12 m/z = 199.5848 [M – 2 PF6]2+. Found: 199.5842.
Synthesis of complex C4. To a mixture of 4 (100 mg, 0.25 mmol) and FeCl2 (16 mg, 0.125 mmol) in anhydrous DMF (3 ml), was added tBuOK (110 mg, 1 mmol). The mixture was stirred for 10 min at room temperature. Diluted HNO3 was then added to adjust the pH at 2. A saturated solution of KPF6 was added (5 mL),. the precipitate was collected by filtration. The solid was purified by column chromatography eluting with a Acetone/H2O/KNO3(sat) = 10 : 3 : 1 mixture. The yellow fraction was collected and treated with diluted HNO3 untilpH=2 leading to a dark orange solution that was treated with saturated solution of KPF6 (10 ml). After evaporation of acetone, the solid was filtrated, washed with distilled water and dried under vacuum affording C4 (14 mg, 10%). 1H NMR (400Mz, CD 3CN): δ = 8.30 (s, 4H), 8.16 (d, J = 2.3 Hz, 4H), 7.55 (dt, J = 7.8 and 1.1Hz, 4H), 7.47 (dt, J = 7.9 and 1.0Hz, 4H), 7.35 ( (d, J = 8 Hz, 4H), 2.5 (s, 12H) ppm. 13C NMR (100 MHz, CD 3CN): δ = 209.5, 154.7, 138.2, 130.8, 125.0, 124.2, 111.9, 110.5, 105.8, 31.5 ppm. HRMS (ESI) calcd for C44H34FeN10O4P2F12 m/z = 411.1052 [M – 2 PF6]2+. Found: 411.1086.
3.4. Photophysics.
In our set-up, the 800 nm output of a 5 kHz regenerative Ti:Sapphire amplifier (Amplitude Technologies) is used to generate excitation pulses by a pumping commercial collinear optical parametric amplifier (TOPAS, Light Conversion) followed by frequency doubling to produce ~60 fs pulses at 515nm. Broadband white-light probe pulses are obtained by focusing the ~30 fs 800 nm pulses onto a 2 mm thick CaF2 crystal. The 300-700nm is measured in two separate sets of data with a Peltier-cooled high-speed charge-coupled device (CCD) mounted at the output of a 25-cm focal length spectrometer (resolution 3 nm). The pump and probe pulses are focused on 80x80 μm2 and 40x40 μm2, respectively. The pump pulse intensity is carefully reduced so as to work in a regime of linear
signal response. The relative linear polarizations of pump and probe are set at magic angle (54.7°). The concentration of the complexes dissolved in MeCN is adjusted to an absorbance of 0.45 mm-1 at the peak of the S0-S1 transition. The 1-mm path length quartz cell containing the solution is set on a louder-speaker with orthogonal vibration at 10Hz to avoid degradation attests that the sample remains intact during the experiment. All transient absorption data presented in this paper are processed following the procedure described in ref. 18 in order to compensate for Group Velocity Dispersion and define time zero within +/- 20 fs over the entire spectral range. Raman response from the solvent and cross-phase modulation artefacts are measured in a MeCN only containing flow cell subtracted after application of an appropriate weighting coefficient.
3.5. Molecular modelling and simulations.
All quantum chemistry calculations were performed by using the Gaussian09 suite of programs. The ground-state geometry off all the complexes have been optimized at the DFT level by using the B3LYP exchange correlation functional. The double-z LANL2DZ basis set was used for the iron atom, whereas carbon, hydrogen, and nitrogen were described by using the 6-31+G(d,p) basis set. Singlet excited states were firstly obtained as vertical transitions from the equilibrium geometry, following the usual Franck-Condon approach, at TD-DFT level. In this case the system was described using HCTCH exchange correlation functional, and the 6-31+G(d,p) basis set for all the atoms. Note that these conditions have been chosen as the ones that better reproduce the lowest energy part of the absorption spectrum relative to the experimental one. In all the calculations solvent effects were taken into account by using the polarizable continuum model (PCM); more specifically, acetonitrile was considered throughout. The density reorganization in the excited states was analyzed in terms of NTOs by using a locally produced and free downloadable code NancyEX (see www.nancyex.sourceforge.net/). Once the singlet states assessed the same level of theory was used to investigate the triplet manifold, triplet nature (MC or MLCT) was easily identified using the NTO analysis. Subsequently, the first 3MLCT and the first 3MC have been optimized, again with TDDFT at HCTCH/6-31+G(d,p) level of theory, in order to obtain the adiabatic relaxation energies. Finally S values have been obtained once again using the NancyEX code from a post-processing of the attachment and detachment densities. For the reader convenience we recall that fs is based on the normalized overlap of the detachment and attachment densities, calculated in the direct space. As such values close to 1.0 are indicative of localized transitions, while charge-transfer states are characterized by values close to zero. The lower the value of s the higher is the charge-transfer nature of the state.
Acknowledgements
The Nancy team is grateful to S. Parant for UV spectroscopy and F. Lachaud for mass spectrometry. The Strasbourg team
acknowledges insightful discussions with J. Léonard, and technical support from O. Crégut.
Notes and references
a IPCMS & Labex NIE, Université de Strasbourg & CNRS, Rue du Loess,
67034 Strasbourg Cedex, France. stefan.haacke@ipcms.unistra.fr
b Université de Lorraine–Nancy & CNRS, HecRIn, SRSMC, Boulevard
des Aiguillettes, 54506 Vandoeuvre-Lès-Nancy, France.
philippe.gros@univ-lorraine.fr
c Université de Lorraine–Nancy & CNRS, HecRIn, SRSMC, Boulevard
des Aiguillettes, 54506 Vandoeuvre-Lès-Nancy, France.
† Electronic Supplementary Information (ESI) available: [Compound characterizations, computational methods, photophysics details and additional data.]. See DOI: 10.1039/b000000x/
1 H. Xu, R. Chen, Q. Sun, W. Lai, S. Qianqian, W. Huang, X. Liu, Chem. Soc. Rev. 2014, 43, 3259.
2 (a) J. A. G. Williams, S. Develay, D. L. Rochester, L. Murphy, Coord. Chem. Rev. 2008, 252, 2596. (b) C. Cebrian, M. Mauro, D. Kourkoulos, P. Mercandelli, D. Hertel, K. Meerholz, C.A. Strassert, L. De Cola, Adv. Mat., 2012, 25(3), 437.
3 (a) M. K. Nazeeruddin, A. Kay, L. Rodicio, R. Humphry-Baker, E. Muller, P. Liska, N. Vlachopoulos, M. Grätzel, J. Am. Chem. Soc.
1993, 115, 6382. (b) M. K. Nazeeruddin, P. Pechy, T. Renouard, S. M.
Zakeeruddin, R. Humphry-Baker, P. Comte, P. Liska, L. Cevey, E. Costa, V. Shklover, L. Spiccia,. G. B. Deacon, C. A. Bignozzi, M. Grätzel, J. Am. Chem. Soc. 2001, 123, 1613.
4 A. Hauser, Top. Curr. Chem. 2004, 234, 155. 5 R. A. Layfield, Organometallics 2014, 33 (5), 1084.
6 J. F. Létard, J. A. Real, S. Kawata, S. Kaizaki, Chem. Eur. J. 2009, 15, 4165-4171.
7 (a) J. E. Monat, J. K. McCusker, J. Am. Chem. Soc. 2000, 122, 4092. (b) W. Gawelda, A. Cannizzo, V.-T. Pham, F. van Mourik, Ch. Bressler, M. Chergui, J. Am. Chem. Soc. 2007, 129, 8199. (c) C. Consani, M. Prémont-Schwarz, A. ElNahhas, Ch. Bressler, F. van Mourik, A. Cannizzo, M. Chergui, Angew. Chem., Int. Ed. 2009, 48, 7184. (d) G. Auböck, M. Chergui, Nat. Chem. 2015, 7, 629-633. 8 (a) Y. Liu, T. Harlang S. Canton, S. Chabera, K. Suarez Alcantara, A.
Fleckhaus, E Göransson, E. Corani, A. Lomoth, R. Sundström, V. K. Wärnmark, Chem. Comm., 2013, 6412. (b) L.A. Fredin, M. Pápai, E. Rozsályi, G. Vankó, K Wärnmark, V. Sundström, P. Persson, J. Phys. Chem. Lett. 2014, 5, 2066.
9 Y. Liu, K.S. Kjærl, L.A. Fredin, P. Chábera, T. Harlang, S. E. Canton, S. Lidin, J. Zhang, R. Lomoth, K.-E. Bergquist, P. Persson, K. Wärnmark, V. Sundström, Chem. Eur. J. 2015, 21, 3628.
10 T. Duchanois, T. Etienne, C. Cebrián, L. Liu, A. Monari, M. Beley, X. Assfeld, S. Haacke, P. C. Gros, Eur. J. Inorg. Chem., 2015, 2469. 11 T.C.B. Harlang, Y. Liu, O. Gordivska, L.A. Fredin, C.S. Ponseca, P.
Huang, P. Chabera, K.S. Kjaer, H., Mateo, J. Jens Uhlig, R. Lomoth, R. Wallenberg, S. Styring, P., Persson, V. Sundström, K. Wärnmark, Nat. Chem., 2015, 7, 883.
12 (a) J.-D. Chai, M. Head-Gordon, Phys. Chem. Chem. Phys. 2008, 10, 6615. (b) A. Monari, T. Very, J.-L. Rivail, X. Assfeld, Comput. Theor. Chem. 2012, 990, 119.
13 Such a reversal has been reported but only for computationally designed virtual cyclometallated complexes see I.M. Dixon, F. Alary, M. Boggio-Pasqua, J.-L. Heully, Dalton Trans. 2015, 44, 13498. 14 D. Escudero, D. Jacquemin, Dalton Trans. 2015, 44, 8346.
15 (a) T. Etienne, X. Assfeld, A. Monari, J. Chem. Theory Comp., 2014, 10, 3896. (b) T. Etienne, X. Assfeld, A. Monari, J. Chem. Theory Comp., 2014, 10, 3906. (c) T. Etienne, J. Chem. Theory Comp., 2015, 11, 1692.
16 A. Herbst, C. Bronner, P. Dechambenoit, O.S. Wenger, Organometallics 2013, 32, 1807-1814
17 T. Tu, X. Feng, Z. Wang, X. Liu, Dalton Trans. 2010, 39, 10598. 18 J. Briand, J. Réhault, O. Bräm, J. Léonard, J. Helbing, A. Cannizzo, V.
Zanirato, M. Chergui, M. Olivucci, S. Haacke, Phys. Chem. Chem. Phys. 2010, 12, 3178.