HAL Id: tel-01654563
https://tel.archives-ouvertes.fr/tel-01654563
Submitted on 4 Dec 2017HAL is a multi-disciplinary open access archive for the deposit and dissemination of sci-entific research documents, whether they are pub-lished or not. The documents may come from teaching and research institutions in France or abroad, or from public or private research centers.
L’archive ouverte pluridisciplinaire HAL, est destinée au dépôt et à la diffusion de documents scientifiques de niveau recherche, publiés ou non, émanant des établissements d’enseignement et de recherche français ou étrangers, des laboratoires publics ou privés.
spin labels
Paul Demay-Drouhard
To cite this version:
Paul Demay-Drouhard. Measuring nanometer-scale distances by high-field pulsed electron-electron double resonance using MnII spin labels. Theoretical and/or physical chemistry. Université Pierre et Marie Curie - Paris VI, 2015. English. �NNT : 2015PA066612�. �tel-01654563�
THESE DE DOCTORAT DE L’UNIVERSITE PIERRE ET MARIE CURIE
Spécialité : Chimie Moléculaire
Présentée par
Paul Demay-Drouhard
Pour obtenir le grade de
Docteur de l’Université Pierre et Marie Curie
Measuring Nanometer-Scale Distances by High-Field Pulsed
Electron-Electron Double Resonance Using Mn
IISpin Labels
Soutenue le 22 octobre 2015
Devant un jury constitué de :
Pr. Clotilde POLICAR Directrice de thèse
Dr. Hélène BERTRAND Encadrante de thèse
Pr. Marcel MAYOR Rapporteur
Dr. Eva TOTH Rapporteur
Pr. Bernold HASENKNOPF Examinateur
Remerciements
Ce travail de thèse a été effectué au Laboratoire des Biomolécules (à l’Ecole Normale Supérieure et à l’Université Pierre et Marie Curie), ainsi qu’au CEA-Saclay, sous la direction de Clotilde Policar et d’Hélène Bertrand. Il n’aurait jamais été possible sans l’aide de nombreuses personnes que je tiens vivement à remercier.
Tout d’abord, j’exprime ma gratitude à Clotilde pour son encadrement et pour la liberté qu’elle ma laissé au cours de ce projet, toujours supervisé d’une manière très dynamique. J’adresse ensuite mes plus profonds remerciements à mon encadrante, Hélène. Tu m’as accompagné dans la réalisation de ce projet d’une manière idéale et tu as toujours été présente pour moi, en particulier dans les moments difficiles où la chimie sait se montrer coriace... A la fois sur le plan scientifique et sur le plan humain, tes qualités sont remarquables et pour tout cela je t’admire beaucoup.
Je remercie vivement Solange et Sandrine pour leur accueil dans l’UMR. Je tiens à remercier chaleureusement Eva Tóth et Marcel Mayor pour avoir accepté d’évaluer ce travail et d’être rapporteurs, ainsi que Thomas Prisner et Berni Hasenknopf pour avoir accepté le rôle d’examinateurs.
Mes deux premières années de thèse se sont déroulées à l’ENS, et j’aimerais remercier Isabelle pour m’avoir accueilli au P12, ainsi que Sylvie pour ta gentillesse sans pareil. Je profite de l’occasion pour remercier Sandrine pour m’avoir permis d’utiliser la DLS, ainsi que les thésards et post-docs de l’UMR Pasteur, Fabrice en particulier.
Parmi ceux avec qui j’ai partagé le bureau, je tiens à remercier Géraldine pour les commandes toujours impeccables et François pour ta grande culture chimique ainsi que pour avoir assuré sans faille le transport de mes échantillons entre l’ENS et Orsay ! Merci également aux anciens, Anne-Sophie et Sylvain, pour avoir rendu mon quotidien très agréable. Une mention spéciale pour Sarah, avec qui j’ai souvent pesté contre la chimie qui refuse souvent de marcher comme on veut ! Merci à Emilie et Lucas pour leur sympathie, à Nico pour avoir pris le temps de nous aider avec l’ITC, ainsi qu’à Eliane et Karine pour leur aide précieuse avec les tâches administratives. Et bonne chance aux nouveaux, Julien et Meng Lan.
Un grand merci à l’équipe de Jean-Maurice, les sucriers du LBM : Laure et Anaïs pour les nombreux bars et restaurants (parfois sur le toit de l’ENS ou même au CEA), Laurent pour ta gentillesse et ton aide, sans oublier Mayeul (même si je sais que tu es jaloux de mon pantalon vert), Guillaume et mon collègue ESCOMien Pascal (bon courage avec tes mayonnaises !). Mes remerciements vont également à Laurence, Catherine et Alexandra pour leur aide et pour les nombreuses molécules empruntées. Un grand merci à Hakim, que j’ai eu plaisir à retrouver, pour ton aide avec la DFT des complexes de Mn, ainsi qu’à Geoff pour la dynamique moléculaire.
Passons maintenant aux peptidistes… Merci à Rodrigue pour ton expérience en matière de synthèse peptidique (et pour m’y avoir initié, même si le premier essai n’était pas très fructueux), ainsi que pour tes rappels hygiène et sécurité (ma blouse n’était pas si sale !). Merci à Cillian pour
m’avoir bien aidé avec l’HPLC, et pour tes super bières home-made. Un grand merci à Cécile pour ton énergie et pour les nombreux conseils en synthèse, ainsi qu’à Roba et Benjamin.
Mes remerciements vont également à tous les thésards et post-docs avec qui j’ai pu discuter, et qui ont grandement contribué à rendre ces trois années de thèse très agréables : Jean-Marie « Jeannot », Marghe, Maryline, May Lee, Héloïse, Jean-Philippe, Mathilde, Mehdi, les deux Anaïs, Aude, Lucile, Tom… et mes excuses à ceux que j’oublie certainement. Nombreux d’entre vous ont fait de la fête de la science un grand succès ! Je tiens aussi à remercier les stagiaires que j’ai eu l’occasion de côtoyer, dont certains ont contribué à ce travail : Marie, JB, Rahaman et Martha.
Une partie de ce travail repose sur la cristallographie aux rayons X, c’est pourquoi je tiens à remercier Régis de l’ICMMO et Lise-Marie de l’IPCM pour leur travail impeccable et leur disponibilité. Merci également à Christophe pour son aide avec le dichroïsme circulaire, ainsi qu’à Gilles et Gérard pour les discussions très utiles concernant la spectrométrie de masse. La grande majorité des spectres de masse des molécules synthétisées au cours de cette thèse a d’ailleurs été obtenue grâce au service de spectrométrie de masse de l’ICMMO par les soins de Delphine et Tanya, que je remercie vivement. Une partie des HRMS a également été effectuée par Claude et Hristo à l’IPCM. Merci enfin à Sandrine et Astrid pour m’avoir permis d’utiliser l’ITC.
Merci également à tous ceux avec qui j’ai pu interagir pour le monitorat : Sylvie, Marie et Khalil pour la chimie physique, Delphine et Anny pour la chimie organique, Catherine et Annie pour l’insertion professionnelle et Jacques pour la PAES. Merci aussi à Jean-Philippe lors des tests de TP d’orga… Je remercie aussi mon comité de suivi de thèse, Pierre et Rodrigue.
Now switching into English… This project would not have been possible without the group of Biological High-field Magnetic Resonance in CEA-Saclay. I would like to deeply thank Sun for allowing me to use his 285 GHz EPR spectrometer as well as the W-band Bruker. I will never forget itc set 23 and magnet goto 9.7 heater off, as well as my frozen fingers when removing the stick from the Bruker. Then a very special thank you to Vincent for these days at CEA. I really learnt a lot about EPR with you and our discussions about the black magic of Mn-DOTA have always been very fruitful! Thank you very much for your careful reading of this manuscript and for your constant help with the 285 GHz (that I finally managed to like) and with the Golden Shovel. And I also wish to thank Leandro (I could write this in French!) for your help with the W-band, with you we saw the first encouraging Mn-Mn PELDOR results with the rigid compounds!
The third group I would like to thank is the Center for Biomolecular Magnetic Resonance in Goethe University directed by Thomas Prisner. Thank you for your welcome in Frankfurt during these three weeks in January, they contributed a lot to improve my knowledge about PELDOR. And of course, a very big thank you to Dimi. Thank you so much for correcting the pulsed EPR part of this manuscript. Your kindness and your knowledge about physics are both very impressive, you really know how to explain it simply, and with you and Vincent I will always remember these nights in Frankfurt behind the G-band and the ice hockey matches (Löwen Frankfurt!). I also thank Vasyl for his nice help with the G-band, Jörn for his advices in synthesis as well as Andriy, Burkhard and all the PhD and post-docs in Frankfurt that made my stay very enjoyable.
Pour finir, et de manière plus personnelle, je tiens à remercier mes amis de longue date dont le soutien a été si important, plus particulièrement Quentin, Camille (venue de Lille !), Benoît (bientôt ton tour !), The Flew, Danny, Fred, Anto, Max, Jérôme, Niou, Zoé, Apo, Jojo, Karim, Carotte, Beulette et Léa (la coloc de l’amour), Malcolm et Popy (les anciens ESCOMiens)… Merci d’avoir fait le déplacement pour la plupart et d’avoir rendu ma journée de soutenance (et la soirée) inoubliable. Merci enfin à mes parents et à mes deux petits frères pour m’avoir toujours épaulé dans ces études plutôt longues… Et merci à Gri, pour ton soutien tellement précieux pendant la rédaction de ce manuscrit et pour tout ce que tu m’apportes.
Contents
Abbreviations ... i
List of figures ... iv
List of schemes ... vii
List of tables ... ix
General introduction ... 1
Introduction: theory, literature review and aim of the project ... 5
1. Theoretical background ... 5
1.1 EPR: introduction and scope of application ... 5
1.2 Theoretical background ... 6
1.2.1 Magnetic moment of the electron ... 6
1.2.2 Interaction between a paramagnetic center and a magnetic field ... 7
1.2.3 Continuous-wave EPR ... 9
1.2.4 The case of a real EPR spectrum ... 10
1.3 Spin Hamiltonian for MnII ... 10
1.4 Continuous-wave high-field EPR ... 12
1.4.1 Design of the J-band cw-HFEPR spectrometer ... 12
1.4.2 Influence of the high-field on the EPR spectrum ... 13
1.4.2.1 The case of MnII... 13
1.4.2.2 The case of TEMPO ... 14
1.5 Pulsed EPR ... 16
1.5.1 Introduction and main pulse sequences ... 16
1.5.2 The PELDOR pulse sequence... 19
1.5.2.1 Theory ... 19 1.5.2.2 Pulse sequence... 20 1.5.2.3 Optimization of parameters ... 22 1.5.2.3.1 Concentration ... 23 1.5.2.3.2 Pulses... 24 1.5.2.3.3 Temperature ... 24 1.5.2.3.4 Solvent ... 24
1.5.2.4 High-spin metals vs nitroxide spin labels ... 24
1.5.2.5 MnII vs GdIII ... 25
2. Pulsed EPR measurements involving metals ... 26
2.1 Low-spin metals ... 27
2.1.1 CuII complexes... 27
2.1.1.1 CuII-CuII distance measurements ... 27
2.1.1.2 CuII-nitroxide distance measurements ... 28
2.1.2 Fe-S clusters ... 29
2.1.3 Mn-tyrosyl measurements in the S2 state of PSII ... 30
2.2 High-spin GdIII complexes ... 30
2.2.1 PELDOR distance measurements between two GdIII complexes ... 32
2.2.1.1 Gd-Gd measurements on rigid models compounds ... 32
2.2.1.2 Gd-Gd measurements on biological objects ... 36
2.2.1.2.1 In vitro PELDOR ... 36
2.2.1.2.1.1 Gd-DPA-based tags ... 36
2.2.1.2.1.2 Gd-DO3A and Gd-DOTA-based tags ... 40
2.2.1.2.2 In-cell PELDOR ... 42
2.2.1.2.2.1 Gd-PyMTA tags ... 42
2.2.1.2.2.2 Gd-DOTA-based tags ... 43
2.2.1.3 Gd-nitroxide measurements ... 45
2.2.1.3.1 With Gd-Tpy or Gd-DTPA labels ... 45
2.2.2 RIDME ... 52
2.3 MnII complexes ... 52
2.3.1 Mn-Mn distance measurements ... 52
2.3.2 Mn-nitroxide measurements ... 53
3. Aim of the project ... 56
Chapter I – Synthesis of platforms with a constrained distance between two MnII complexes ... 59
1. Ligand screening ... 59
1.1 Bis(imino)pyridines... 59
1.2 Terpyridines ... 64
1.3 Dipicolinic acid and derivatives (PyMTA and PyMDPDA) ... 70
1.4 PCTA and PCMA... 78
1.5 DOTA and DO3A ... 81
2. Linkers and grafting of ligands ... 86
2.1 Oligo(piperidine) linker ... 86
2.1.1 Synthesis of the oligo(piperidine) linker ... 86
2.1.2 Coupling with ligands ... 90
2.1.2.1 Grafting of BImPs ... 90 2.1.2.2 Grafting of Tpys ... 91 2.2 Phenyl-piperazine linker ... 96 2.2.1 Symmetric version ... 96 2.2.2 Dissymmetric version... 98 2.2.3 Elongation ... 99
2.2.4 Couplings with ligands ... 101
2.2.4.1 with terpyridines ... 101
2.2.4.2 with DPA, PyMTA and PyMDPDA derivatives ... 103
2.2.4.3 with DOTA derivatives... 105
2.3 Oligo(phenylene-ethynylene) linker ... 107
2.3.1 Symmetric version ... 107
2.3.2 Dissymmetric version... 112
2.3.3 Elongation ... 113
2.3.4 Coupling with ligands ... 115
2.3.4.1 with terpyridines ... 115
2.3.4.2 DPA and PyMTA derivatives ... 120
2.3.4.3 DO3A and DOTA derivatives ... 125
2.4 Polyprolines ... 132
3. Bis(nitroxides) ...135
3.1 Platforms with a phenyl-piperazine linker ... 136
3.2 Platforms with an OPE linker ... 138
4. Dissymmetric platforms ...144
4.1 With the phenyl-piperazine linker ... 144
4.2 With the OPE linker ... 146
Conclusion ...147
Chapter II – PELDOR distance measurements between two high-spin MnII centers ...148
1. General sample preparation for PELDOR measurements ...149
2. Measurements on the bis-Mn-Tpy platforms 176 ...150
3. Measurements on the polyproline bis-dota platforms ...151
3.1 Measurement of the ZFS interaction of Mn-DOTA ... 151
3.2 PELDOR results ... 152
3.3 Analysis of the pseudo-secular contribution ... 156
4. Measurements using rigid platforms ...159
4.1 Phenyl-piperazine bis-DOTA platforms 149 and 150 ... 159
4.2 OPE bis-DOTA platforms 202, 203 and 204 ... 166
4.3 OPE bis-TEMPO platform 225 ... 174
Chapter III – High-field EPR study of persistent substituted trityl radicals ...179
1. Persistent trityl radicals ...180
1.1 Origins of persistent trityl radicals ... 180
1.2 Reported synthesis and applications of PTM radicals ... 182
1.2.1 Synthesis ... 182
1.2.2 Applications ... 184
1.3 Reported synthesis and applications of TAM radicals ... 185
1.3.1 Synthesis ... 185
1.3.2 Applications ... 189
2. Towards TAM/PTM – MnII-DOTA model systems ...191
2.1 Synthesis of PTMTE and PTMTC ... 191
2.2 Attempted couplings of PTM and TAM radicals ... 193
3. Accurate measurement of the g-anisotropy of substituted trityl radicals ...194
3.1 Design of the experimental setup ... 195
3.2 Results and discussion ... 196
Conclusion ...202
General conclusion and perspectives ...203
Annexes ...205
1. Glassing agents ...205
2. PELDOR measurement process ...205
3. Data Analysis ...206 4. Final products ...207 5. List of publications ...210 Experimental part ...211 1. Synthesis...211 2. ITC ...311 3. CD ...311 4. EPR ...311 5. Computational methods...312 6. X-ray crystallography ...313 References ...314 Résumé en français………
326
i
Abbreviations
18C6 18-crown-6
3MDPA 3-mercaptodipicolinic acid 4MMDPA 4-methylmercaptodipicolinic acid
abs. absolute
AIBN azobisisobutyronitrile
AMBER Assisted Model Building with Energy Refinement ANR Agence Nationale de la Recherche
APCI Atmospheric Pressure Chemical Ionization
aq. aqueous
BARF sodium tetrakis[(3,5-trifluoromethyl)phenyl]borate BImP bis(imino)pyridine
BINAP 2,2’-bis(diphenylphosphino)-1,1’-binaphthyl BMC Ballester-Molinet-Castañer reagent
Bn benzyl
Boc tert-butyloxycarbonyl
BOP (benzotriazol-1-yloxy)tris(dimethylamino)phosphonium hexafluorophosphate
Cbz carboxybenzyl
CD circular dichroism
CNRS Centre National de la Recherche Scientifique conc. concentrated
CuAAC copper-catalyzed azide-alkyne cycloaddition
cw continuous wave Cy cyclohexane DAP 2,6-diacetylpyridine DB18C6 dibenzo-18-crown-6 dba dibenzylideneacetone DCC N,N’-dicyclohexylcarbodiimide DCE 1,2-dichloroethane DCM dichloromethane
DEER Double Electron-Electron Resonance
DEPT Distorsionless Enhanced Polarization Transfer
DFT Density Functional Theory
DIPEA N,N-diisopropylethylamine
DMAP 4-dimethylaminopyridine DMF N,N-dimethylformamide
DMSO dimethyl sulfoxide DNA deoxyribonucleic acid
DNP Dynamic Nuclear Polarization
DO2A 1,4,7,10-tetraazacyclododecane-1,7-diacetic acid DO3A 1,4,7,10-tetraazacyclododecane-1,4,7-triacetic acid DOTA 1,4,7,10-tetraazacyclododecane-1,4,7,10-tetraacetic acid
DOTAM 1,4,7,10-tetrakis(carbamoylmethyl)-1,4,7,10-tetraazacyclododecane DPA dipicolinic acid
DOPC 1,2-dioleoyl-sn-glycero-3-phosphocholine dppf 1,1’-bis(diphenylphosphino)ferrocene
DQC Double-Quantum Coherence
DTPA diethylenetriaminepentaacetic acid
EDC 1-ethyl-3-(3-dimethylaminopropyl)carbodiimide
ii
ED-EPR echo-detected Electron Paramagnetic Resonance EDTA ethylenediaminetetraacetic acid
EPR Electron Paramagnetic Resonance
ESI Electrospray Ionization Fmoc 9-fluorenylmethyloxycarbonyl FRET Förster Resonance Energy Transfer
FS field-swept
FT Finland trityl
HATU 1-[bis(dimethylamino)methylene]-1H-1,2,3-triazolo[4,5-b]pyridinium 3-oxid hexa- fluorophosphate
HBTU 2-(1H-benzotriazol-1-yl)-1,1,3,3-tetramethyluronium hexafluorophosphate HCCA α-cyano-4-hydroxycinnamic acid
HEPES 2-[4-(2-hydroxyethyl)piperazin-1-yl]ethanesulfonic acid HFEPR High-Field Electron Paramagnetic Resonance
HMPA hexamethylphosphoramide
HOBt N-hydroxybenzotriazole
HOMO Highest Occupied Molecular Orbital HPLC High Performance Liquid Chromatography HSQC Heteronuclear Single Quantum Coherence
HWE Horner-Wadsworth-Emmons
ITC Isothermal Titration Calorimetry
ITO Indium Tin Oxide
LDA lithium diisopropylamide
MALDI-TOF Matrix-Assisted Laser Desorption Ionization – Time of Flight
MBHA 4-(2′,4′-dimethoxyphenyl-Fmoc-aminomethyl)-phenoxyacetamido-methylbenzhydryl amine
MD Molecular Dynamics
MRI Magnetic Resonance Imaging
Ms mesyl MTSL S-(1-oxyl-2,2,5,5-tetramethyl-2,5-dihydro-1H-pyrrol-3-yl)methylmethanesulfono- thioate mw microwave MW molecular weight NBS N-bromosuccinimide NMP N-methyl-2-pyrrolidone
NMR Nuclear Magnetic Resonance
Ns nosyl
OMRI Overhauser-enhanced magnetic resonance imaging OPE oligo(phenylene-ethynylene)
OPV oligo(phenylene-vinylidene) ORTEP Oak Ridge Thermal Ellipsoid Plot
PCMA pyridyltriazacyclododecane monoacetate PCTA pyridyltriazacyclododecane triacetate PELDOR Pulsed Electron-Electron Double Resonance PET polyethylene terephthalate
Pin pinacolato Pp phenyl-isopropyl PSII photosystem II PTM perchlorotriphenylmethyl PTMTC perchlorotriphenylmethyl-tricarboxylic acid PTMTE perchlorotriphenylmethyl-triethylester
iii
PTSA para-toluenesulfonic acid
PyMDPDA pyridinedimethylenenitrilo-dipyridyldiacetate PyMTA pyridinedimethylenenitrilo-tetraacetate
RIDME Relaxation-Induced Dipolar Modulation Enhancement RNA ribonucleic acid
rt room temprature
SAM self-assembled monolayer
sat. saturated
SDSL site-directed spin labeling SNR signal-to-noise ratio SOD superoxide dismutase
SPP shots per point
SPPS solid-phase peptide synthesis
SRT shot repetition time
TAM tetrathiatriarylmethyl
TBAF tetra-n-butylammonium fluoride TBDMS tert-butyldimethylsilyl
TCEP tris(2-carboxyethyl)phosphine
TEA triethylamine
TFA trifluoroacetic acid
TEMPO (2,2,6,6-tetramethylpiperidin-1-yl)oxyl Tf triflate TFE trifluoroethanol THF tetrahydrofuran TIPS triisopropylsilyl TIPSA triisopropylsilylacetylene TIS triisopropylsilane
TLC thin layer chromatography
TMEDA tetramethylethylenediamine TMS trimethylsilyl TMSA trimethylsilylacetylene TNPTM trinitroperchlorotriphenylmethyl Tpy 2,2’:6’,2”-terpyridine Trt trityl Ts tosyl
TSPTM perchlorotriphenylmethyl trisulfonic acid
TTF tetrathiafulvalene
VMD Visual Molecular Dynamics
XPhos 2-dicyclohexylphosphino-2’,4’,6’-triisopropylbiphenyl XRD X-ray diffraction
iv
List of figures
Figure 1: Structure of TEMPO and PTM ... 6
Figure 2: Zeeman effect and the resonance condition for S = 1/2... 8
Figure 3: Transitions between energy levels when S = 1/2 ... 9
Figure 4: Energy levels diagram for a high-spin 55MnII ion. ... 12
Figure 5: 285 GHz cw-HFEPR of [Mn(H2O)6]2+ at 23 K ... 13
Figure 6: 285 GHz cw-HFEPR of [Mn(H2O)6]2+at 4.2 K ... 14
Figure 7: Energy levels diagram for a nitroxide ... 15
Figure 8: Typical EPR spectra of a nitroxide ... 16
Figure 9: Spin echo pulse sequence ... 18
Figure 10: Inversion-recovery pulse sequence ... 19
Figure 11: Pake doublet ... 20
Figure 12: PELDOR pulse sequence ... 21
Figure 13: Dipolar evolution function V(T) ... 22
Figure 14: Fourier transform of the dipolar evolution time V(T) and Tikhonov regularization ... 23
Figure 15: PELDOR results on Cu2Tf and Cu2Lf ... 28
Figure 16: PELDOR results on azurin labeled with MTSL ... 29
Figure 17: Commonly used ligands for GdIII and MnII for spin-labeling ... 31
Figure 18: PELDOR results on a bis-Gd-PyMTA rigid model system ... 33
Figure 19: PELDOR results on a series of bis-Gd-PyMTA rigid model systems ... 34
Figure 20: PELDOR results on τC14 labeled with Gd-4MMDPA or Gd-3MDPA ... 37
Figure 21: Distributions of Gd-Gd and nitrogen-nitrogen distances in spin-labeled p75ICD and τC14 ... 38
Figure 22: PELDOR results on mellitin labeled with Gd-4MMDPA ... 39
Figure 23: PELDOR results on G-PR mutants labeled with Gd-4MMDPA or MTSL ... 39
Figure 24: PELDOR results on a DNA duplex labeled with Gd-DOTA-alkyne ... 40
Figure 25: PELDOR results on two ERp29 mutants labeled with Gd-C1 ... 41
Figure 26: PELDOR results on WALP peptides labeled with Gd-C1 or Gd-DOTA-MTS ... 42
Figure 27: In-cell PELDOR results on a polyproline peptide labeled with Gd-PyMTA ... 43
Figure 28: In-cell PELDOR results on ubiquitin labeled with Gd-DOTA-Mal ... 44
Figure 29: In-cell PELDOR results on a DNA duplex labeled with Gd-DOTA-alkyne ... 45
Figure 30: PELDOR results on a rigid TpyGdCl3-nitroxide model compound ... 46
Figure 31: PELDOR results on gold nanoparticles labeled with Gd-DTPA and nitroxide tags ... 47
Figure 32: PELDOR results on mixed spin-labeled ERp29 dimers ... 48
Figure 33: PELDOR results on WALP peptides labeled with Gd-DOTA-Lys and MTSL ... 49
Figure 34: PELDOR results on T4L labeled with Gd-DOTA or Gd-DTPA and MTSL ... 49
Figure 35: PELDOR results on DOTA and MTSL spin-labeled polyprolines ... 50
Figure 36: PELDOR results on a mixed spin-labeled ERp29 mutant using a dual-mode cavity ... 51
Figure 37: Structure and ED-EPR spectrum of p75DD labeled with EDTA-MTS ... 52
Figure 38: PELDOR results on MnII-EDTA-labeled p75DD ... 53
Figure 39: Structure and ED-EPR spectrum of a MnIIbis(Tpy)-nitroxide model compound ... 54
Figure 40: PELDOR results on the MnII-bis(Tpy)-nitroxide model compound ... 55
Figure 41: PELDOR results on a RNA construct ... 56
Figure 42: Targeted model platforms... 58
Figure 43: General structure of BImPs ... 59
Figure 44: ORTEP drawings of pCl-Me-BImP-MnBr2 25 ... 63
Figure 45: Structure of iPr-BImP-MnBr2 24 and J-band cw-HFEPR spectrum of a MeCN sample ... 63
Figure 46: The Tpy ligand 47 ... 64
v
Figure 48: cw-HFEPR spectra of fluorinated Mn -bis(Tpy) complexes 57 and 62 ... 69
Figure 49: Structures of DPA 1 and PyMTA 66 ... 70
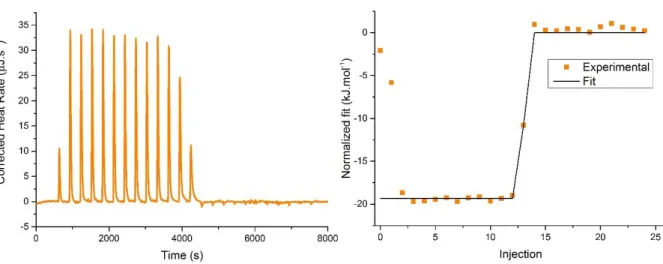
Figure 50: Typical thermogram of the titration of pBrPyMTA 72 with MnII ... 73
Figure 51: Structure of pBrPyMTA 72 and J-band cw-HFEPR spectrum of the corresponding MnII-complex ... 73
Figure 52: Structure of PhTPyMTA 77 and J-band cw-HFEPR spectrum of the corresponding MnII-complex ... 75
Figure 53: ORTEP drawings of diester 80 ... 76
Figure 54: Structure of pBrPyMDPDA 88 and J-band cw-HFEPR spectrum of the corresponding MnII-complex ... 77
Figure 55: Structures of PCTA and PCMA ... 78
Figure 56: Structure of PCMA 99 and J-band cw-HFEPR spectrum of the corresponding MnII-complex ... 80
Figure 57: Structure of PCTA and J-band cw-HFEPR spectrum of the corresponding MnII-complex ... 81
Figure 58: Crystal structure of MnII-DOTA ... 82
Figure 59: J-band cw-HFEPR spectrum of Mn(H2O)62+ and of the MnII complex of DOTA ... 82
Figure 60: Structure of DO3A and J-band cw-HFEPR spectrum of the corresponding MnII-complex ... 83
Figure 61: Structure of DO2A and J-band cw-HFEPR spectrum of the corresponding MnII-complex ... 84
Figure 62: Structure of DOTAM and J-band cw-HFEPR spectrum of the corresponding MnII-complex ... 85
Figure 63: Crystal structure of MnII-DOTAM ... 85
Figure 64: ORTEP drawing of a tetrapiperidine linker ... 86
Figure 65: ORTEP drawings of ketone 120 ... 92
Figure 66: ORTEP drawings of compound 130. ... 97
Figure 67: Ball and stick drawings of compound 130 comparing XRD and DFT results ... 98
Figure 68: DFT structure of a simplified model of 140 ... 101
Figure 69: DFT structure of 142 ... 102
Figure 70: J-band cw-HFEPR spectrum of the MnII-bis(Tpy) 143 ... 102
Figure 71: Structure of bis-DOTA-PhPip1 149 and J-band cw-HFEPR spectra of its MnII complex ... 106
Figure 72: ORTEP drawings of OPE-diCOH 161 and OPE-diCCH 164 ... 111
Figure 73: DFT structures of simplified models of linkers 165, 171 and 172 and their respective N-N length .... 114
Figure 74: Two views of the DFT structure of a simplified model of 173... 116
Figure 75: Two views of the DFT structure of a simplified model of 175... 117
Figure 76: DFT structure of a simplified model of 179 ... 118
Figure 77: DFT structures of simplified models of the four bis-Tpy platforms 143, 174, 176 and 178 ... 120
Figure 78: ORTEP drawings of tetraester 180 ... 122
Figure 79: DFT structure of a simplified model of bis-DPA-OPE 181 ... 122
Figure 80: DFT structure of a simplified model of 184 ... 124
Figure 81: Structure of MnII-bis-PyMTA-OPE 185 and its J-band cw-HFEPR spectrum ... 125
Figure 82: Structure of bis-DO3A-OPE 188 and J-band cw-HFEPR spectrum of its MnII-complex ... 126
Figure 83: HPLC traces after deprotection of the protected bis-DOTA modules 189, 193 and 194 ... 128
Figure 84: HPLC traces of Pp-protected bis-DOTA-OPE1 199 and of the crude after deprotection ... 131
Figure 85: Structure of bis-DOTA-OPE1 202 and J-band cw-HFEPR spectra of its MnII complex... 132
Figure 86: CD spectra of DOTA2Pn ... 134
Figure 87: Structure of the eight bis-DOTA platforms that will be used for PELDOR distance measurements ... 135
Figure 88: Common commercially available functionalized TEMPO derivatives ... 136
Figure 89: DFT structure of the bis-hydroxylamine corresponding to bis-TEMPO 219. ... 136
Figure 90: J-band cw-HFEPR spectrum of bis-TEMPO 219 ... 137
Figure 91: ORTEP drawings of bis-TEMPO 220 ... 138
Figure 92: Ball and stick drawings of bis-TEMPO 220.comparing XRD and DFT results ... 138
Figure 93: DFT structure of a simplified model of the bis-hydroxylamine corresponding to bis-TEMPO 224 ... 140
Figure 94: J-band cw-HFEPR spectrum of bis-TEMPO 224 ... 140
Figure 95: ORTEP drawings of bis-TEMPO 225 ... 141
vi
Figure 97: J-band cw-HFEPR spectrum of bis-TEMPO 225 ... 142
Figure 98: DFT structure of a simplified model of the bis-hydroxylamine corresponding to bis-TEMPO 226 ... 143
Figure 99: J-band cw-HFEPR spectrum of bis-TEMPO 226 ... 143
Figure 100: ED-EPR spectrum of platform 176 and its PELDOR time trace ... 150
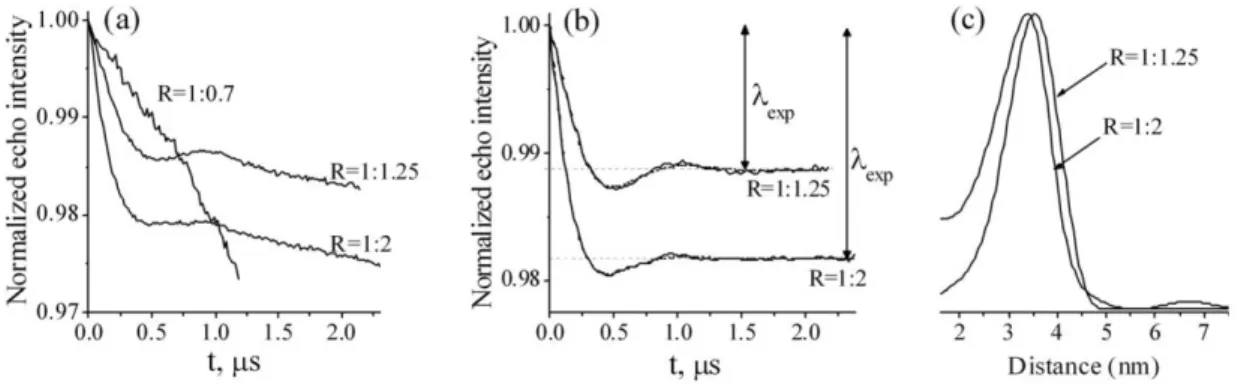
Figure 101: ED-EPR spectrum of MnDOTA2P6 and J-band cw-HFEPR spectrum of MnDOTA2P12 ... 151
Figure 102: PELDOR results on MnDOTA2Pn platforms ... 152
Figure 103: PELDOR results comparing MnDOTA2P12 and Mn-DOTA ... 154
Figure 104: PELDOR results on MnDOTA2P6 with offsets of 50 MHz and 150 MHz... 154
Figure 105: Mn-Mn distances and distributions profiles of MnDOTA2Pn from PELDOR and MD results ... 155
Figure 106: Field dependence of the PELDOR spectra of MnDOTA2P6. ... 157
Figure 107: ED-EPR spectra of MnDOTA2PhPipn... 159
Figure 108: T2 spectra of the MnDOTA2PhPipn platforms ... 160
Figure 109: Pump-detect strategy on the MnDOTA2PhPip1 platform ... 160
Figure 110: PELDOR results on MnDOTA2PhPip1 at four different offsets (-50, -90, -150 and -200 MHz) ... 161
Figure 111: PELDOR results on MnDOTA2PhPip1 at -70 MHz offset with a concentration of 50 µM ... 162
Figure 112: MD calculations on a model of MnDOTA2PhPip1 ... 163
Figure 113: PELDOR results on MnDOTA2PhPip2 at two different concentrations (125 and 250 µM). ... 165
Figure 114: MD calculations on a model of MnDOTA2PhPip2 ... 166
Figure 115: ED-EPR spectrum of MnDOTA2OPE1 ... 167
Figure 116: T2 and T1 spectra of MnDOTA2OPE1 ... 167
Figure 117: PELDOR results on MnDOTA2OPE1 at two different offsets (+50 and -100 MHz) . ... 168
Figure 118: MD calculations on a model of MnDOTA2OPE1 ... 169
Figure 119: Possible coordination spheres of MnII-DOTA ... 170
Figure 120: PELDOR results on MnDOTA2OPE1 and GdDOTA2OPE1 (1) ... 171
Figure 121: PELDOR results on MnDOTA2OPE1 and GdDOTA2OPE1 (2) ... 171
Figure 122: Distance distributions for MnDOTA2OPE1 and GdDOTA2OPE1 with four RPs ... 172
Figure 123: Normalized distance distributions for MnDOTA2OPE1 and GdDOTA2OPE1 ... 173
Figure 124: Structure of the bis-TEMPO-OPE module 225 and its ED-EPR spectrum ... 174
Figure 125: PELDOR results on the bis-TEMPO-OPE module 225 with a -70 MHz offset ... 175
Figure 126: Structure of one of the rigid bis-Gd-PyMTA platforms used by Goldfarb et al ... 176
Figure 127: Structures of commonly used members of the PTM and TAM families and X-band EPR spectra .... 182
Figure 128: ORTEP drawings of PTMTE 246 ... 193
Figure 129: J-band cw-HFEPR spectrum of H3PTMTC superposing MnII ... 195
Figure 130: Process for the accurate measurement of g-tensors ... 196
Figure 131: Calibrated J-band cw-HFEPR spectra of FT, H3FT 263, PTMTC, H3PTMTC 244, and PTMTE 246 ... 197
Figure 132: J-band cw-HFEPR spectra of FT in different conditions ... 199
vii
List of schemes
Scheme 1: Spin-labeling of a protein with MTSL ... 2
Scheme 2: Retrosynthetic analysis of BImPs ... 60
Scheme 3: Synthetic methods for the synthesis of DAP 3... 61
Scheme 4: Synthesis of para-substituted diacetylpyridines 10 and 11 ... 62
Scheme 5: Synthesis of substituted Mn-BImPs 22-26 ... 62
Scheme 6: Main intermediates in the synthesis of p-phenylterpyridine ... 65
Scheme 7: Synthesis of para-substituted benzaldehydes 29 and 31 ... 65
Scheme 8: Synthesis of para-substituted phenylterpyridines 36-41 ... 66
Scheme 9: Functionalization of p-phenylterpyridines ... 67
Scheme 10: Synthesis of dichloro Mn-Tpy complexes 49 and 50 ... 67
Scheme 11: Synthesis of dibromo Mn-Tpy complexes 51-54 ... 68
Scheme 12: Synthesis of symmetric Mn-bis(Tpy) complexes 56-60 ... 68
Scheme 13: Synthesis of dissymmetric Mn-bis(Tpy) complexes 61 and 62 ... 69
Scheme 14: Synthesis of PyMTA 67 and its corresponding MnII complex 68 ... 71
Scheme 15: Synthesis of para-functionalized PyMTA derivatives ... 72
Scheme 16: Synthesis of PhTPyMTA 77 and its corresponding MnII complex 78 ... 74
Scheme 17: Introduction of a naphthyl substituent on PyMTA: synthesis of NpPyMTA 84 ... 76
Scheme 18: Synthesis of pBrPyMDPDA 88 ... 77
Scheme 19: Attempted denosylation of 91 toward PCTA ... 78
Scheme 20: Attempted macrocyclization of 94 toward PCTA ... 79
Scheme 21: Synthesis of PCMA 99 ... 80
Scheme 22: Synthesis of the orthogonally protected tetrapiperidine linker 109 ... 88
Scheme 23: Synthesis of a bis(piperidine) linker with a mesylate group ... 89
Scheme 24: Incorporation of an ethynyl group in the oligo(piperidine) linker ... 89
Scheme 25: Attempted direct coupling between a BImP and a bis(piperidine) ... 90
Scheme 26: Attempted couplings of pBrDAP 11 on bis(piperidine) linkers 106 and 115 ... 90
Scheme 27: Possible starting point for a bis(BimP) platform ... 91
Scheme 28: Coupling on the amino side of the bis(piperidine) linker ... 92
Scheme 29: Attempted syntheses of bis-Tpy platforms incorporating a bis(piperidine) linker ... 93
Scheme 30: Attempted conversion of ketone 120 ... 93
Scheme 31: Attempted conversion of the keto group of bis(piperidine) ... 94
Scheme 32: Attempted couplings on triflates 121 and 122 ... 94
Scheme 33: Attempted synthesis of oligo(piperidine) coupling partners ... 95
Scheme 34: Grafting of a phenyl ring on an oligo(piperidine) linker ... 95
Scheme 35: Attempted formation of a Grignard reagent from pBrPhTpy 36 ... 96
Scheme 36: Retrosynthetic analysis of the phenyl-piperazine linker ... 96
Scheme 37: Synthesis of the monoprotected piperazines 127 and 128 ... 97
Scheme 38: Synthesis of the phenyl-piperazine linker 131 ... 97
Scheme 39: Synthesis of the orthogonally protected phenyl-piperazine linker 135 ... 99
Scheme 40: Synthesis of dissymmetrical phenyl-piperazine linkers 136 and 137 ... 99
Scheme 41: Attempted elongation of the phenyl-piperazine linker ... 100
Scheme 42: Synthesis of the biphenyl-piperazine linker 141 ... 100
Scheme 43: Synthesis of the bis[MnII-bis(Tpy)] platforms 143 and 144 ... 101
Scheme 44: Attempted Hartwig-Buchwald couplings between linker 131 and pBrPhTpy 36, and between p-dibromobenzene 129 and amine 145 ... 103
Scheme 45: Attempted couplings of PyMTA, PyMDPDA and DPA derivatives on phenyl-piperazine linkers ... 104
viii
Scheme 47: Retrosynthetic analysis of an OPE linker with PEG chains on each benzene ring ... 107
Scheme 48: Synthesis of the diiodinated building block 154 ... 108
Scheme 49: Attempted desymmetrization of compounds 153 and 154... 108
Scheme 50: Retrosynthetic analysis of an OPE linker ... 109
Scheme 51: Attempted synthesis of a monoprotected diethynlylbenzene from 155 with two subsequent Sonogashira couplings ... 109
Scheme 52: Synthesis of the monoprotected TIPS-diethynylbenzene 159 ... 110
Scheme 53: Synthesis of a family of PEGylated OPEs ... 110
Scheme 54: Functional group modification on PEGylated OPEs ... 112
Scheme 55: Synthesis of the mono-Boc-protected OPE linker 169 ... 112
Scheme 56: Attempted desymmetrization of OPE linkers 162, 164 and 165 ... 113
Scheme 57: Synthesis of OPE linkers 171 and 172 with 5 and 7 phenylene-ethynylene repeat units. ... 114
Scheme 58: Synthesis of the bis[MnII-bis(Tpy)] platform 174 ... 115
Scheme 59: Synthesis of the bis[MnII-bis(Tpy)] platform 176 ... 116
Scheme 60: Attempted click reaction between pN3PhTpy 38 and OPE-diCCH 164 ... 117
Scheme 61: Synthesis of the bis[MnII-bis(Tpy)] platform 178 and the bis-MnII-Tpy complex 179 ... 118
Scheme 62: Synthesis of the bis-DPA-OPE platform 181 and its corresponding MnII complex 182 ... 121
Scheme 63: Attempted Sonogashira couplings between PyMTA and PyMDPDA derivatives 70, 71 and 87 and linkers 170 or 164 ... 123
Scheme 64: Synthesis of the bis-PyMTA-OPE module 184 and its corresponding MnII complex 185 ... 124
Scheme 65: Synthesis of the bis-DO3A-OPE platform 188 ... 126
Scheme 66: Synthesis of the protected bis-DOTA platform 189 using an amide bond formation ... 127
Scheme 67: Synthesis of the three protected bis-DOTA platforms 189, 193 and 194 ... 127
Scheme 68: Synthesis of tri-Pp-DO3A 198 ... 129
Scheme 69: Synthesis of the three bis-DOTA-OPEn modules 202, 203 and 204 ... 130
Scheme 70: Polyproline labeling with DOTA-Mal 205 ... 133
Scheme 71: Synthesis of the bis-TEMPO platform 219... 136
Scheme 72: Synthesis of the bis-TEMPO platform 220... 137
Scheme 73: Attempted Sonogashira coupling between OPE-diCCH 164 and 4-OTf-TEMPO 221 ... 139
Scheme 74: Synthesis of the bis-TEMPO platform 224... 139
Scheme 75: Synthesis of bis-TEMPO platforms 225 and 226 ... 141
Scheme 76: Synthesis of terpyridine 228 and nitroxide 229 ... 144
Scheme 77: Synthesis of dissymmetric platforms 230 and 231 ... 145
Scheme 78: Synthesis of the DOTA-PipPhPip-TEMPO module 234 ... 146
Scheme 79: Synthesis of the mono-DOTA platform 236 ... 147
Scheme 80: Synthesis of Gomberg’s trityl ... 180
Scheme 81: Synthesis of the PTM radical 239 ... 181
Scheme 82: Described syntheses of trityl radicals derived from intermediate 241 ... 183
Scheme 83: Synthesis of the graftable trityl phosphonate 256 ... 184
Scheme 84: Synthetics pathways to H3FT 263 ... 186
Scheme 85: Synthesis of monoamide derivatives of FT ... 187
Scheme 86: Synthesis of monofunctionalized FT derivatives by desymmetrization ... 188
Scheme 87: Synthesis of various monosubstituted FT derivatives by aromatic nucleophilic substitution ... 189
Scheme 88: Synthesis of PTMTE 246 and H3PTMTC 244 ... 192
ix
List of tables
Table 1: Frequency range of the wavebands used in EPR spectroscopy ... 9
Table 2: Parameters and numerical results from the PELDOR experiments of Figure 120. ... 153
Table 3: Parameters and numerical results from the PELDOR experiments of Figure 122. ... 155
Table 4: Parameters and numerical results from the PELDOR experiments of Figure 128. ... 161
Table 5: Parameters and numerical results from the PELDOR experiments of Figure 142. ... 175
Table 6: Experimental and calculated g-tensors of PTM and TAM radicals ... 198
Table 7: Comparison of the g-tensors of FT and OX63 in typical DNP conditions ... 199
Table 8: Comparison of the g-tensors of PTM and TAM radicals determined in this work with the literature ... 200
Table 9: Comparison of distances and dihedral angles between X-ray structures and DFT calculations for PTM and TAM radicals ... 201
1
General introduction
Biomacromolecules such as proteins or nucleic acids play an essential role in living organisms. They are involved in numerous tasks: catalysis of metabolic reactions (enzymes), cell signaling, or the encoding, transmission and expression of the genetic information. Understanding the function of biomacromolecules is crucial to investigate the processes that occur in a cell, in order to improve our knowledge on life. The function of a biological macromolecule closely depends on its structure. The two most popular techniques for structure elucidation are X-ray crystallography1 and
nuclear magnetic resonance (NMR) spectroscopy.2 Both are complementary methods that display
advantages and drawbacks.
X-ray diffraction (XRD) can provide a microscopic picture of various molecules at the atomic resolution. For instance, the Nobel Prize in Chemistry in 2009 was awarded to V. Ramakrishnan, T. A. Steitz and A. E. Yonath for studies of the structure and function of the ribosome,3 in which XRD
played a decisive role. This technique has led to major progress, but still suffers from limitations. It only applies to crystallized molecules, and growing crystals of proteins can be a tedious task. In particular, making membrane proteins crystallize often requires the use of detergents4 that can lead
to structure disruption. Moreover, XRD offers a static view of a molecule in the solid state, which does not necessarily reflect its structure in solution. The crystallized form of a protein may therefore not correspond to its biologically active conformation. On the contrary, NMR spectroscopy applies to proteins in solution. Using multidimensional experiments, one can assign the different chemical shifts to a specific nucleus, in order to generate a complete map of the protein of interest. Structures can be determined on a very short time scale, providing a description of a protein that better reflects its native environment. However, protein NMR is often limited to rather small objects (< 50 kDa) because the overlap of the different NMR peaks renders the interpretation very difficult for larger structures.5
In this context, alternative methods for structural studies are highly desirable. Among them, the determination of long-range (nanometer-scale) distances appears as a very valuable tool. Collecting a set of long-range constraints in a biomacromolecule gives insight into its global structure, information on the formation of oligomers or on conformational changes upon ligand binding.6
Förster Resonance Energy Transfer (FRET) has been widely used for this purpose,7 but it is
sometimes quite difficult to extract the corresponding distance from a difference in fluorescence intensities. Nanometer-scale distances can also be measured using electron paramagnetic resonance (EPR), and especially pulsed EPR techniques such as pulsed electron double resonance (PELDOR).6
Together with XRD and NMR, this method has emerged as a powerful complement in the biostructural toolbox. It is also very efficient as a stand-alone technique to study the conformational distribution of biomacromolecules in the nanometer scale.8
EPR spectroscopy only applies to paramagnetic compounds. As many proteins are diamagnetic, stable paramagnetic labels have to be grafted on them at specific positions. This method, known as site-directed spin labeling (SDSL), is commonly performed with nitroxide derivatives.9 A popular spin label is
S-(1-oxyl-2,2,5,5-tetramethyl-2,5-dihydro-1H-pyrrol-3-2
yl)methylmethanesulfonothioate (MTSL), which can be grafted on cysteine residues of proteins, either native or introduced by site-directed mutagenesis (Scheme 1).
Scheme 1: Spin-labeling of a protein with MTSL
It is then possible to study every kind of protein, even large ones, by tagging them with two MTSL spin labels and measuring the interspin distance using pulse sequences like PELDOR. Briefly, the dipolar coupling between the two nitroxides, which is proportional to the inverse cube of the distance between them, can be separated from the other contributions to the spin Hamiltonian using a relevant pulse sequence.10 Unlike protein NMR, the detected signal only comes from the two spin
labels: the rest of the doubly labeled molecule is EPR-silent, so the obtained information is very specific. Other nitroxide-based spin labels and labeling methods have been developed so that virtually every kind of molecule can be studied by the PELDOR technique. Accordingly, this approach has been applied to proteins,11,12 nucleic acids13,14,15 or purely synthetic systems.16,17,18,19
Nevertheless, stable nitroxide have some limitations. The measurement time usually varies from 12 to 24 h to obtain a single distance, and the required concentration typically ranges from 0.1 to 1 mM. This rather low sensitivity can be greatly improved by increasing the frequency of the EPR spectrometer (Table 1, p. 9). PELDOR experiments with nitroxides are commonly performed at X-band (9.5 GHz), so the use of other waveX-bands (Q-X-band, 34 GHz; W-X-band, 95 GHz; G-X-band, 180 GHz) could be envisioned. However, the gain in sensitivity would be compensated by the broadening of the EPR spectrum of nitroxide moieties, which decreases the number of spins that are inverted by the pump pulse of the PELDOR pulse sequence.20 Alternative spin labels would thus be highly
desirable, and, among them, high-spin metal complexes are very promising candidates.20 Unlike
nitroxides, the central transition of their EPR spectrum narrows when the frequency increases, leading to a high signal-to-noise ratio (SNR). Additionally, high-spin metal complexes are stable in the cellular medium, offering the possibility of performing PELDOR measurements in vivo: this is much more difficult with nitroxides that are readily reduced into EPR-silent hydroxylamines. The use of GdIII
complexes as new spin labels for the PELDOR methodology has been initiated by the group of D. Goldfarb in 2007.21 The same group reported the first successful high-spin MnII-MnII PELDOR
measurement in 2011,22 but MnII complexes as paramagnetic centers for PELDOR measurements
have been much less investigated since. However, they appear attractive, notably in a biological perspective. MnII is endogenous, less toxic than GdIII, and can replace MgII in many other biological
systems due to similarities in charge and size.23
Unraveling the potential of high-spin MnII complexes as paramagnetic centers for high-field
PELDOR measurements is the purpose of this thesis. The basics of EPR, with a particular emphasis on pulsed EPR and especially PELDOR, will be discussed and applied to high-spin MnII complexes and
nitroxide spin labels. A focused literature review of distance measurements involving metal centers, especiall high-spin GdIII and MnII complexes, using PELDOR and related pulse sequences will then be
3
presented. With this in mind, we will determine what should be the relevant features of an ideal MnII
complex employed as a spin label: parameters such as the symmetry of the coordination sphere, the zero-field splitting (ZFS) parameters and the thermodynamic stability will be taken into account. The design of model systems incorporating two MnII complexes connected to a central rigid molecular
rod will be described: such compounds will serve as “MnII standards” to calibrate the PELDOR
method. In the first chapter of this manuscript, the screening of ligands for MnII that correspond to
the parameters specified above will be presented. The synthetic methodologies to generate ligands for MnII with a graftable moiety, in order to connect them to a rigid rod, will be described in details.
The corresponding MnII complexes have been characterized using continuous-wave high-field EPR
(cw-HFEPR), and this screening procedure have led to the identification of 1,4,7,10-tetraazacyclododecane-1,4,7,10-tetraacetic acid (DOTA) as the most promising ligand for MnII. The
synthesis of stiff linkers with various anchoring groups have also be performed, and methods will be presented to graft them on selected ligands. A variety of rigid model systems with Mn-Mn distances covering the 1.5 – 6 nm range have been obtained this way, and the expected Mn-Mn distances have been calculated using density functional theory (DFT) and molecular dynamics (MD) calculations. The corresponding bis-nitroxide modules have also been synthesized for comparison purposes.
In the second chapter, W-band PELDOR measurements on the previously synthesized MnII
-MnII model systems will be presented. Preliminary measurements on platforms incorporating two
MnII-bis-terpyridine complexes proved difficult, but the Mn-Mn distance was successfully measured
on platforms with two MnII-DOTA centers connected to a polyproline spacer. The use of MnII
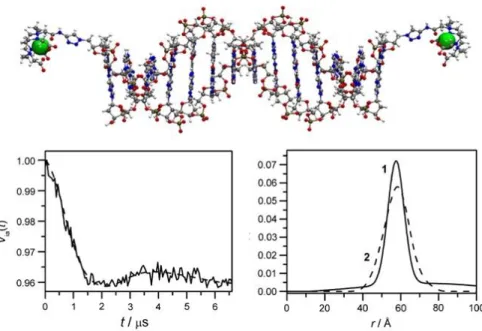
complexes with small ZFS parameters led to an improved sensitivity. The Mn-Mn distances and distribution profiles obtained with PELDOR were in good agreement with MD calculations. We will show that under certain conditions, shorter components in the distance distributions can appear. They likely result from the contribution of the pseudo-secular term of the dipolar Hamiltonian. This interaction cannot be neglected for our systems because pumped and detected spins are similar. For the polyproline bis-MnII platforms, the pseudo-secular interaction is certainly hidden under the
flexibility of the system, so the distance distribution profiles obtained with PELDOR were found to be reliable. In the case of a rigid linker, for short distances, the routinely performed Tikhonov analysis could not fully account for the experimental frequency-domain traces, meaning that the Mn-Mn distance was not reliable. However, the Mn-Mn distance was successfully measured when the rigid linker was longer, and we will show that in this case, the pseudo-secular interaction increases the width of the distance distribution. Insights in the coordination sphere of MnII-DOTA will be provided
using measurements with GdIII-DOTA complexes.
The last chapter of this manuscript deals with an emerging class of paramagnetic centers for pulsed EPR distance measurements: substituted persistent trityl radicals such as perchlorotriphenylmethyl (PTM) and tetrathiatriarylmethyl (TAM). These radicals display a very narrow EPR signal, which explains their attractiveness as PELDOR spin labels but also in numerous active fields. Methodologies toward new platforms incorporating a MnII-DOTA center and a PTM or
TAM label will be presented. To understand the relationship between the structure of these radicals and their specific applications, the g-tensors of tricarboxylic derivatives will be accurately measured using cw-HFEPR with MnII as a field standard. We will show that despite the similar structure of PTMs
4
and TAMs, their electronic properties are very different. These findings will be rationalized using DFT calculations.
This work was performed in the frame of an ANR international project (MnHFPELDOR) that gathered three research groups, two from France and one from Germany:
The group of Inorganic Cellular Chemistry, led by Prof. C. Policar, in the Laboratory of BioMolecules (Ecole Normale Supérieure - PSL Research University, Département de Chimie, Sorbonne Universités, UPMC Univ Paris 06, CNRS UMR 7203)
The group of Biological High-field Magnetic Resonance (BHMR) directed by Dr. Sun Un in the Institute for Integrative Biology of the Cell (I2BC) (Department of Biochemistry, Biophysics and Structural Biology, Université Paris-Saclay, CEA, CNRS UMR 9198)
The group directed by T. Prisner in the Institute of Physical and Theoretical Chemistry and Center for Biomolecular Magnetic Resonance (BMRZ), Department of Biochemistry, Chemistry and Pharmacy, Goethe University.
In the course of this PhD work, the bis-MnII platforms, the bis-nitroxides systems along with
the mixed Mn-Mn and Mn-TEMPO modules were chemically designed and synthesized at LBM under the supervision of Hélène Bertrand and Clotilde Policar, as well as the PTM derivatives. The EPR experiments were performed at BHMR with Vincent Ching under the supervision of Sun Un and Leandro Tabares. I have also spent three weeks in Frankfurt to perform experiments at G-band with Dmitry Akhmetzyanov and Vincent Ching under the supervision of Thomas Prisner.
5
Introduction: theory, literature review and aim of the
project
1. T
HEORETICAL BACKGROUND
1.1 EPR: introduction and scope of application
Electron Paramagnetic Resonance (EPR) was discovered by the Russian physicist Yevgeny Zavoisky in Kazan State University in 1944. Numerous similarities exist between EPR and the more commonly used nuclear magnetic resonance (NMR). Both rely on the interaction between the magnetic component of an electromagnetic radiation and a sample placed in a magnetic field. The magnetic field splits the degeneracy of the energy levels, and an absorption of energy may occur when the energy of an incident photon is equal to the energy difference between two levels. In NMR, the energy is absorbed by atomic nuclei, while in EPR, the energy is absorbed by paramagnetic centers.
A paramagnetic center is a molecule that contains unpaired electrons. Two main categories of paramagnetic centers can be distinguished:
Radicals are molecules with one unpaired electron. They are often transient species, as they can quickly react with other molecules. They can be intermediates in reaction mechanisms, or generated by various kinds of radiations. Radicals such as nitric oxide NO•, hydroxyl radical
HO• or superoxide O
2•- are involved in many physiological and pathological processes.
In some cases, radicals can be long-lived: they are called stable radicals when the unpaired electron can be delocalized through π-bonds, thus reducing the reactivity of the system. When the steric hindrance around the unpaired electron is so high that the radical cannot readily react with another molecule, the term persistent radical is employed. Nitroxides like (2,2,6,6-tetramethylpiperidin-1-yl)oxyl (TEMPO) or substituted trityl radicals like perchlorotriphenylmethyl (PTM) are persistent radicals that are stable for decades at room temperature and are unaffected by numerous reagents (Figure 1).
6
Figure 1: Structure of TEMPO and PTM
Coordination complexes with transition metals, lanthanides or actinides can also be paramagnetic, containing one or more unpaired electrons. They can be found in metalloproteins like hemoglobin and notably in metalloenzymes such as superoxide dismutase and vitamin B12.
Other paramagnetic centers can be described such as conduction electrons in metals or electrons trapped in crystallographic defects. EPR spectroscopy is thus a valuable method to study all these systems.
1.2 Theoretical background
In this part, vectors are written in bold and tensors are written with breves.
1.2.1 Magnetic moment of the electron
Let us consider an electron in motion, with a mass me and an elementary charge e. This electron creates a magnetic moment µ defined by:24
µ = -(e/2me)(σl+geσs) [1] where ge is the free electron spin g-factor, σl is the orbital angular momentum and σs is the spin angular momentum. These quantities can only take discrete values:
σl² = ℓ(ℓ+1)ℏ and σs² = s(s+1)ℏ [2]
where ℏ = h/2π is the reduced Planck constant. ℓ can be any natural number but s can only be equal to ½. s is an intrinsic property of the electron which is called spin.
For a determined value of ℓ, one component of σl (σlz for instance) can only take values
defined by:
σlz = mℓℏ with mℓ = - ℓ, - ℓ +1… ℓ [3]
7
σsz = msℏ with ms = -½, +½ [4]
For the sake of simplification, equation [1] can be written: µ = -β(l+ges)
where l = σl/ℏ and s=σs/ℏ are reduced angular momentums. β is called Bohr magneton and
is equal to:
β = eℏ/2me [5]
1.2.2 Interaction between a paramagnetic center and
a magnetic field
All the equations discussed above are true for an isolated electron. We will now consider the more complex case of a paramagnetic center. In the absence of a magnetic field, the magnetic moment of its electrons can be written:
µ = -gβS [6]
where S is a reduced angular moment, implying that S² = S(S+1) and that Sz can take the 2S+1
electronic spin quantum numbers MS = -S, -S+1…S. This angular moment is called electron spin of the paramagnetic center, and encompasses what was referred before as orbital and spin momentums. It takes into account the difference between an isolated electron and a paramagnetic center.
The g-value characterizes the paramagnetic center and is measured during an EPR experiment. It is comparable to the chemical shift δ in NMR spectroscopy. We can also say that g = ge + Δg where Δg is characteristic of the studied system. To measure g, the paramagnetic sample is placed in a magnetic field B. The interaction energy between µ and B can be written:
H = -µB [7]
When B is aligned along the +z axis, this equation becomes:
H = gβBSz [8]
H can thus take only discrete values:
E(MS) = gβBMS [9]
This shows that the interaction between the magnetic moment of a paramagnetic center µ and a magnetic field B creates 2S+1 energy levels. The energy difference between the levels is equal to:
8
This splitting is centered on the energy level of the paramagnetic center without magnetic field, and is known as Zeeman effect.
When an electromagnetic radiation is applied on the paramagnetic center in a magnetic field, transitions between the energy levels will occur, provided that the energy of the incident photons (proportional to their frequency ν) is equal to the energy difference between two levels: this is the resonance condition.
hν = gβB0 [11]
This situation is depicted on Figure 2, for a paramagnetic center with S = 1/2. Importantly, magnetic dipolar transitions only occur with the selection rule ΔMS = ±1.
Figure 2: Zeeman effect and the resonance condition for S = 1/2
Finally, let us consider a sample with N paramagnetic centers at thermal equilibrium, and with S = 1/2. Some centers will occupy the MS = ½ state (N+ population), some other the MS = -½ state (N- population). These centers obey the Boltzmann equation:
N+/N- = exp(-ΔE/kBT) with N = N+ + N- [12]
where kB is the Boltzmann constant. At the resonance, the absorbed power Pabs can then be written:
Pabs = W(N--N+)ΔE [13]
9
Figure 3: Transitions between energy levels when S = 1/2
1.2.3 Continuous-wave EPR
Continuous-wave EPR (cw-EPR) is the original method for acquiring an EPR spectrum and is still widely used (unlike cw-NMR). The idea is to work at a constant frequency and to sweep the magnetic field B to detect resonances, which occur when:
ν/B = gβ/h [14]
Usually g-values are around 2. This implies that ν/B is around 28 GHz.T-1. Using
electromagnets, fields up to around 13 T can be obtained: the corresponding frequency range corresponds to the microwave (mw) domain (from 1 to 350 GHz). This domain is divided in several bands using a terminology originally developed for radar technology (Table 1).
Table 1: Frequency range of the wavebands used in EPR spectroscopy. Commonly encountered wavebands along the text are highlighted in grey, and bold numbers in brackets refer to the frequency of the
10
A standard cw-EPR spectrometer is constituted of the following elements:
An electromagnet creates a magnetic field B of fixed direction. By varying the intensity of the current in the coil, B can be swept.
A generator gives the mw radiation. Usually a Gunn diode is employed, and the power of the radiation can be set between 1 µW and 200 mW. The microwaves travel in a waveguide. A resonant cavity contains the sample. This setup, which is not always used, is employed to
improve the sensitivity.
A diode is used to detect the absorption signal.
The detection of the signal is based on a technique called modulation of the magnetic field. A small sinusoidal magnetic field parallel to B is added, which make it possible to extract the first derivative of the absorption signal with a very good signal-to-noise ratio (SNR). Hence, cw-EPR spectra are very often represented with the first derivative of the absorption signal relative to the field on the y axis, and the field on the x axis.
1.2.4 The case of a real EPR spectrum
In fact, the shape of an EPR spectrum is usually more complicated, meaning that much more information can be extracted. The main features that influence the shape of an EPR spectrum are listed below:
The way the molecules are organized in the sample deeply affects the spectral shape. This is because the magnetic moment of the molecules is not always isotropic: the interaction between µ and B depends on the direction of B compared to the molecules. This means that the g-value in equation [6] must be replaced with an anisotropic g-tensor ğ.
The unpaired electrons of a paramagnetic center can interact with the magnetic moment of a nucleus. This is called a hyperfine interaction, which has a great effect on the EPR spectrum. It is analogous to J-coupling in NMR.
For paramagnetic centers with S > 1/2 (certain metal complexes for example), some energy levels are already separated without any applied magnetic field. This phenomenon is called zero-field splitting (ZFS) and significantly modifies the spectral shape.
In the next part we will go into more details in the case of the transition metal that is of interest to us, namely MnII.
1.3 Spin Hamiltonian for Mn
IITo take into account every phenomenon that influences the shape of the EPR spectrum of MnII, we need to express its spin Hamiltonian. The electronic configuration of MnII is 3d5. Generally
MnII complexes have the high-spin S = 5/2 configuration, with the five unpaired electrons in their
ground state. Only the 55Mn isotope is stable (100% natural abundance): its nuclear spin is I = 5/2. It
11
rule is ΔMI = 0 instead of ΔMS = ±1.
The major terms in the spin Hamiltonian for MnII are:25,26
The Zeeman interaction HZ, which results from the interaction between the electron spin S
and the applied magnetic field B:
HZ = βBğS [15]
For most MnII complexes at X-band (Table 1, p. 9), the Zeeman interaction is the dominant
term in the spin Hamiltonian. Moreover, ğ is usually isotropic and its values are close to ge. The hyperfine coupling interaction HHF, which results from the interaction between the
electron spin S and the nuclear spin I:
HHF = IĂS [16]
where Ă is the hyperfine tensor, which is usually isotropic for octahedral MnII complexes
because of the symmetrical electron distribution. The hyperfine constant |A| typically ranges between 160 and 300 MHz. The number of energy levels generated by the hyperfine splitting is thus equal to (2S+1)(2I+1), i.e. 36 for high-spin MnII, corresponding to 30 possible
transitions following the selection rules ΔMS = ±1 and ΔMI = 0.
The zero-field interaction (or ZFS), which results from the interaction between the electron spins in the absence of magnetic field:
HZFS = SĎS [17]
where Ď is the zero-field splitting tensor. The ZFS reflects the symmetry of the ligand sphere around MnII and is related to the crystal field. Distortion of the coordination sphere which
affects the axial ligands induces a change in the energy levels governed by the axial ZFS parameter D. Distortion which affects the equatorial ligands induces further shifting of these energy levels by a function of the rhombic ZFS parameter E. HZFS thus depends on these two
parameters D and E:
HZFS = (D/3)[3Sz²-S(S+1)]+(E/2)(Sx²-Sy²) [18]
There are other terms in the spin Hamiltonian, but they are either negligible, or not contributing to the EPR spectrum such as the nuclear Zeeman interaction (which results from the interaction between the nuclear spin and the applied magnetic field). The simplified spin Hamiltonian that governs the EPR spectrum of a MnII complex is thus given by:
H = βBĝS + IÂS + SĎS [19]
12
Figure 4: Energy levels diagram for a high-spin 55MnII ion. Adapted from 27
1.4 Continuous-wave high-field EPR
Continuous-wave high-field EPR (cw-HFEPR) corresponds to the situation where high fields (and thus high frequencies) are employed. This has a marked effect on the EPR spectrum. The concept of high field depends on the radical or metal complex that is studied: it corresponds to a situation where a good resolution can be achieved (W-band and above for MnII complexes). All
cw-HFEPR spectra have been recorded at CEA on a locally built spectrometer operating in cw-mode at 285 GHz28 (J-band, see Table 1, p. 9).
1.4.1 Design of the J-band cw-HFEPR spectrometer
This spectrometer was built fifteen years ago by Sun Un and does not use a cavity. The sensitivity is thus low, but this can be partially compensated by the use of large volumes (up to 1 mL compared to a few µL for cavity-based spectrometers). Moreover, the use of a field-calibration standard that can be coaxially mounted with the sample is possible.
13
The mw source is a 95 GHz generator, followed by a frequency tripler. The microwaves travel in a waveguide until they reach the sample that lies on the superconducting magnet. The absorbed microwave energy is then measured by a bolometer. The sample is contained in a polyethylene terephthalate (PET) tube, frozen in liquid nitrogen and loaded into the spectrometer by dropping into the waveguide. A high vacuum is then generated by a pump. A flow of helium coupled with a heater is used to thermostat the system, and the magnetic field is then swept to record the cw-HFEPR spectrum. The phase of the signal can be adjusted using a polarizer. The modulation and the sensitivity can be adjusted as well.
1.4.2 Influence of the high-field on the EPR spectrum
1.4.2.1 The case of Mn
IIAt high field, according to equation [19] (total spin Hamiltonian), the Zeeman interaction becomes overwhelmingly dominant. In the case of MnII, this effect is very beneficial because it
greatly simplifies the EPR spectrum by obscuring effects from the ZFS interaction (see below). According to Figure 5, at 23 K the MS = -½ ↔ +½ (ΔMS = 1) transition (referred to as the central transition) is the most prominent feature of the spectrum. The maximum probability of this transition is near 23 K, as the spin populations can be modified with the temperature according to equation [12]: other transitions are less prominent at this temperature. The cw-HFEPR spectrum of MnII is then composed of six sharp lines (peak-to-trough linewidth: 7 G) arising from the hyperfine
interaction, which are the six transitions that follow the selection rule ΔMI = 0. These lines are centered at hν/gβ and separated by the hyperfine constant |A|, because both the g-tensor and the
A-tensor are isotropic. For the free MnII ion (i.e. the [Mn(H2O)6]2+ complex), |A| = 267 MHz and g =
2.00107 (Figure 5).
Figure 5: 285 GHz cw-HFEPR of [Mn(H2O)6]2+ (from Mn(ClO4)2) at 23 K (in 8:2 H2O/glycerol)
One could wonder why the central transition is the most intense. This is because the ZFS does not interact similarly with every Zeeman transition. The central transition is only perturbed by