HAL Id: hal-01696617
https://hal.inria.fr/hal-01696617
Submitted on 30 Jan 2018
HAL is a multi-disciplinary open access
archive for the deposit and dissemination of
sci-entific research documents, whether they are
pub-lished or not. The documents may come from
teaching and research institutions in France or
abroad, or from public or private research centers.
L’archive ouverte pluridisciplinaire HAL, est
destinée au dépôt et à la diffusion de documents
scientifiques de niveau recherche, publiés ou non,
émanant des établissements d’enseignement et de
recherche français ou étrangers, des laboratoires
publics ou privés.
Linear classification in speech-based objective
differential diagnosis of parkinsonism
Gongfeng Li, Khalid Daoudi, Jiri Klempir, Jan Rusz
To cite this version:
Gongfeng Li, Khalid Daoudi, Jiri Klempir, Jan Rusz. Linear classification in speech-based
objec-tive differential diagnosis of parkinsonism. IEEE-ICASSP - 2018 IEEE International Conference on
Acoustics, Speech and Signal Processing, Apr 2018, Calgary, Canada. �hal-01696617�
LINEAR CLASSIFICATION IN SPEECH-BASED OBJECTIVE DIFFERENTIAL DIAGNOSIS
OF PARKINSONISM
Gongfeng Li
1, Khalid Daoudi
1∗, Jiri Klempir
2, Jan Rusz
2,3†1
INRIA Bordeaux Sud-Ouest (GeoStat team)
Talence, France
2
Department of Neurology and Center of Clinical Neuroscience, First Faculty of Medicine
Charles University, Prague, Czech Republic
3
Department of Circuit Theory. Faculty of Electrical Engineering
Czech Technical University in Prague, Czech Republic
ABSTRACT
Parkinsonism refers to Parkinsons disease (PD) and Atyp-ical parkinsonian syndromes (APS). Speech disorder is a common and early symptom in Parkinsonism which makes speech analysis a very important research area for the purpose of early diagnosis. Most of research have however focused on discrimination between PD and healthy controls. Such research does not take into account the fact that PD and APS syndromes are very similar in early disease stages. The main problem that has to be addressed first is then differential diag-nosis: discrimination between PD and APS and within APS. This paper is a continuation of an earlier pioneer work in differential diagnosis where we mostly address the machine learning problem due to the small amount of training data. We show that classical linear and generalized linear models can provide interpretable and robust classifiers in term of accuracy and generalization ability.
Index Terms— Pathological speech processing, Acoustic analysis, Machine learning, Speech disorder, Parkinsonism
1. INTRODUCTION
Parkinsons disease (PD) is a neurological disorder caused by the degeneration of dopaminergic neurons, leading to clinical features characterized by bradykinesia, rigidity, rest-ing tremor and postural instability. Atypical parkinsonian syndromes (APS) such as progressive supranuclear palsy (PSP) and multiple system atrophy (MSA) differ from PD by more widespread neuronal involvement, resulting in ad-ditional clinical signs, more rapid disease progression and poor response to dopamine replacement therapy [1]. The majority of PSP and MSA patients develop clinical features
∗This work is partly funded by the French research agency (ANR), project
Voice4PD-MSA noANR-16-CE19-0010-01.
†This work is partly funded by the Ministry of Health of the Czech
Re-public, grant no15-28038A.
that overlap those of PD and thus the correct diagnosis can be very challenging in early stages of the disease. However, an accurate early diagnosis is essential not only in assessing prognosis and making decisions regarding treatment, but also for understanding the underlying pathophysiology and for the development of new therapies [2].
Speech disorder is frequently an early and prominent clin-ical feature of PD as well as APS. During the last decades, there has been a increasing interest in PD speech and voice analysis [3]. The large majority of research have however focused on discriminating between PD and healthy controls with the motivation to use speech assessment as a supporting method for early PD diagnosis. While this can have an in-terest from a fundamental perspective, it has a limited impact from the clinical point of view. Indeed, early diagnosis of PD cannot be claimed (as often done) because APS dysarthria is not taken into account. Moreover, most of the time the clin-ical diagnosis even neglects the possibility of an APS. The resulting speech dataset can thus be noisy in the sense that patients considered as PD may be actually APS. Such stud-ies may claim at best methods/features which can be useful in diagnosis of Parkinsonism (which groups PD and APS).
Very few attempts have been done in differential diagnosis between PD and APS or within APS [4, 5, 6]. A pioneer work has been carried out recently in discriminating between PD and APS and between MSA and PSP [7]. The basic conclu-sion is that PD speakers manifest pure hypokinetic dysarthria, ataxic components are more affected in MSA whilst PSP sub-jects demonstrate severe deficits in hypokinetic and spastic elements of dysarthria. Using an SVM with a Gaussian radial basis kernel (RBF) and exhaustive search across (the chosen) acoustic features, an objective discrimination between APS and PD with 95% accuracy and between PSP and MSA with 75% accuracy has been reported.
The research we present in this paper is a continuation of that work, essentially from the machine learning perspec-tive. We focus on discrimination between MSA and PSP as
it represents a more challenging problem since the dysarthria in PD is not mixed and less severe compared to APS [8]. Our primary concern is the classification methodology to adopt in this kind of setting. Indeed, given the small amount of training data, the SVM-RBF classifiers yielding the 95% and 75% in [7] may not be reliable because of data over-fitting. We emphasize that classification performance was not the main purpose of [7], but rather a way to seek disease-specific dysarthric signs. The problem of small amount of training data is not specific to the study [7] but to any study in this area. APS are indeed rare diseases, the number of recruited patients will be always relatively low compared to the dimen-sion of the acoustic spaces generally considered. The curse of dimensionality is thus a persistent problem in this frame-work. A question then raises: How to build (a class of) robust classifiers in term of accuracy and generalization ability in the framework of Parkinsonism’ differential diagnosis ? We show in this paper that standard linear and generalized linear models can lead to such robust classifiers. Moreover, we show that these models provide good insights on multivariate variability and (un)correlation of acoustic features, which can facilitate clinical interpretation.
2. DATASET 2.1. Patients
From 2011 to 2014, 12 consecutive patients with the clin-ical diagnosis of probable PSP (10 men, 2 women) and 13 patients with the diagnosis of probable MSA (6 men, 7 women) were recruited. In this series, 9 PSP patients were diagnosed with the Richardsons syndrome (PSP-RS), 2 with PSP-parkinsonism (PSP-P) and 1 with PSP-pure akinesia with gait freezing (PAGF), whereas 10 MSA patients were diagnosed as the parkinsonian type (MSA-P) and 3 as cere-bellar type (MSA-C). The diagnosis of PSP was established by the NINDS-PSP clinical diagnosis criteria [9], MSA ac-cording to consensus diagnostic criteria for MSA [10]. For a detailed description of the patients we refer to [7].
2.2. Speech recordings
Speech recordings were performed in a quiet room with a low ambient noise level using a head-mounted condenser micro-phone (Bayerdynamic Opus 55, Heilbronn, Germany) situ-ated approximately 5 cm from the mouth of each subject. Speech signals were sampled at 48 kHz with 16-bit resolu-tion. Each participant was instructed to perform sustained phonation of the vowel /a/ per one breath as long and steadily as possible, fast /pa/-/ta/-/ka/ syllable repetition at least seven times per one breath and a monologue on a given topic for approximately 90 s. All participants performed the sustained phonation and syllable repetition tasks twice.
3. ACOUSTIC FEATURES
In [7], several acoustic feature have been computed using ear-lier work [11][12][13]. We refer to [14] for the detailed de-scription. In order to allow easy future comparisons or re-production, we consider in the paper only a set of 13 features that can be computed with existing and established scripts. In [7], the features were categorized in 3 ”symptomatic” groups. Here we adopt a ”phonetic” point of view and group the fea-ture in 3 groups depending on speech style: Voicing, Artic-ulation and Prosodic features. The latter are computed using Python scripts and the others using Praat [15] scripts. 3.1. Voicing features
The voice features (Vf) are computed using the sustained phonation data. To minimize the effect of individual differ-ences between subjects in pitch, the fundamental frequency (F0) sequences were converted into logarithmic tonal scale (semitones). The Vf we consider are:
• The traditional harsh voice parameters: Jitter, Shimmer and HNR.
• The degree of voicelessness (DUV). DUV represents the fraction of pitch frames marked as unvoiced. • The excess of pitch fluctuation measured as the
stan-dard deviation of voice pitch (F0 SD).
• Vocal tremor which describes low-frequency mod-ulation of the vocal fold vibration. Vocal tremor is measured as the frequency tremor intensity in-dex (FTRI) defined as the intensity/magnitude of the strongest low-frequency modulation of F0 [16]. We compute FTRI using the Praat script available at www.brykl.de/tremor pres.praat.
3.2. Articulation features
The articulation features (Af) are computed using the syllable repetition data. The features we consider are derived from Di-adochokinetic (DDK) syllable rates, also known as alternating motion rates (AMR), computed as the number of syllables per second. The latter is used to evaluate subjects ability to per-form quick movements of articulators. To compute AMR fea-tures, syllable positions are computed using the Praat script available at sites.google.com/site/speechrate/Home/praat-script-syllable-nuclei-v2. The Af we consider are:
• Slow AMR measured as the DDK rate of the first seven repetitions of the /pa/-/ta/-/ka/ syllables.
• Rapid AMR measured as the ratio of DDK rate between the first and second half of the /pa/-ta/-/ka/ utterance. • Irregular AMR measured as the standard deviation of
distances between consecutive positions of syllables in the first seven repetitions of /pa/-/ta/-/ka/.
3.3. Prosodic features
The prosodic features (Pf) are computed using the monologue data. 3 of the 4 features we consider require silence detection. We use the pydub library of Python for this detection. The function detect silence yields the positions and lengths of si-lences. ”Pauses” are defined as silences which last more than 60ms. The Pf we consider are:
• Monopitch measured as the standard deviation of F0 on the whole monologue.
• The number of pauses measured as the average number of pauses per second.
• The percentage of pause time (PPT) measured as the percentage of pause time relative to total speech time. • The intraword pause ratio measured as the ratio
be-tween the total pause time within polysllabic words and the total pause time [5][6]. We define the polysllabic words’ pauses as silences between 10ms and 120ms. This feature was not used in [7]. We add it here because it has been reported in [5][6] that it might convey dis-criminative information in classification between con-trols and both PSA and MSA.
4. MACHINE LEARNING METHODOLOGY In all experiments, we use Leave-One-Speaker-Out (LOSO) training. Given the nature of our data, LOSO is indeed the most appropriate method. We always use a linear SVM with C = 1 for classification in order to have a clear understanding of the data behavior.
4.1. Descriptive linear analysis
In our setting, only 12 PSP and 13 MSA patients are avail-able. Thus, typically only a 1-dimensional feature space may provide acceptable statistics. We thus need to project our 13-dimensional feature vector to obtain a scalar describing the speech of each patient. Obviously the first and easiest method which comes to mind to perform such dimension reduction is linear projection using Factorial Discriminant Analysis (FDA) (also know as descriptive LDA) [17].
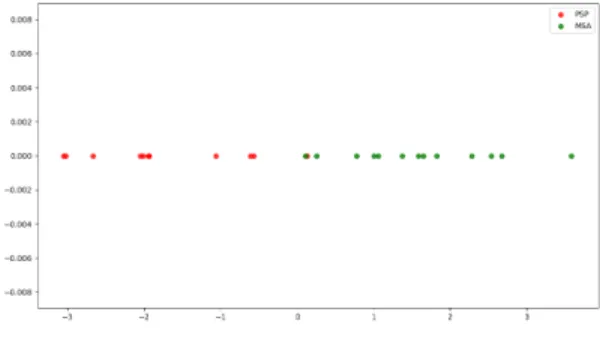
Fig. 1 shows FDA projection of all data features. The re-sult is quite interesting in the sense that FDA seems to yield a good separation between the 2 classes (using all data). This can be seen as a first encouraging sign about the utility of lin-ear projection. However, when performing a 1D-SVM classi-fication with LOSO, the accuracy score is (only) 72%. This suggests that this procedure does not yield a satisfactory gen-eralization ability. A possible explanation of this behavior is the disparity of the input data, though they were centered and normalized to unit variance. Indeed, FDA assumes equal class-covariance which may be a strong hypothesis in this
case. Another possible explanation is the (non)uniformity of noise. For instance Vf, which are all derived from F0, may not have the same noise level as Af/Pf features. It is then worth to take a closer look to the univariate variability of features, in an unsupervised manner.
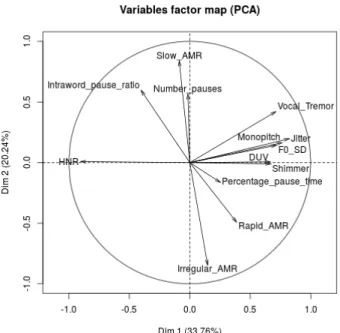
An easy and classical way to do so is Principal Compo-nent Analysis (PCA). Fig. 2 displays the loading vectors of 2-components PCA. This result shows that Vf and Monopitch convey most of (first order) data variability. It also shows that these features are orthogonal/uncorrelated with the remain-ing features and that PPT convey neutral information. This orthogonality is actually consistent with the acoustic inter-pretation of features. We can indeed fairly expect that voic-ing convey complementary information w.r.t. articulation or prosody. This can be seen as a second encouraging sign about the utility linear projection. It is interesting to note that while Monopitch is a prosodic feature it is however derived from F0, like all Vf. It seems thus that all F0-related features can be grouped in the same category. By convention, from now on we consider that ”voicing features” include Monopitch. We also exclude PPT in the remaining experiments and refer by APf the group of Af and Pf.
Fig. 1. FDA projection of all acoustic features
4.2. FDA and Logistic regression
Given the observations of the previous subsection, we (natu-rally) proceed now to apply FDA separately on Vf and APf. Fig. 3(a) shows the projection of features, where the x-axis and y-axis represent Vf and APf, respectively. The black line represents the frontier obtained by linear SVM classification, using all data for training. Note that 2D-SVM classification makes sense here because the input space is filled with an ac-ceptable number of data and because SVM cares only about class-frontiers and not data density. It can be seen that most of data are well (linearly) separated with a good margin. LOSO classification yields however the same score as with 1D FDA, 72%. This may be due to the fact that PSP variance is higher than MSA on the Vf axis and is lower on the APf axis. This implies that separate projection may induce some variance bias.
Fig. 2. 1st and 2nd PCA loading vectors using all data
FDA projection yields a new 1-dimensional variable. We can thus use any univariate classifier with this new variable to try to improve classification performance. A popular way to do so is to apply univariate Logistic Regression (LR) on the top of FDA (multivariate LR on the initial feature vec-tors does not make sense because of the curse of dimension-ality). Besides the well known advantages of LR, it can also act here as a nonlinear normalization which may reduce the variance bias. We recall that LR belongs to the class of gener-alized linear models as it computes nonlinear (logistic) map-ping of features but it learns a linear projection of features. Fig. 3(b) shows the LR projection of FDA features. LR seems to ”push” PSP (resp. MSA) data more to the left (resp. right) side of the input space. The black line again repre-sents the frontier obtained by linear SVM classification, using all data for training. Most of data are now better separated than with FDA alone and with a higher margin. This sug-gests that the generalization ability might be stronger when applying FDA then normalizing with LR. LOSO classifica-tion confirms this expectaclassifica-tion as the accuracy reaches now a score of 80%. Moreover, all the misclassified patients are PSP which means that a patient classified as PSP is very likely to be PSP. This suggests that our methodology can be reliable when the decision is PSP. 80% is of course a ”good” score that can be acceptable in clinical practice (if confirmed by ad-ditional studies). The most important message however is not this score but rather the fact it is obtained using a rigorous and easy methodology that can be readily applied in the frame-work of Parkinsonism’ differential diagnosis. Moreover, this methodology allows easy interpretation of feature
contribu-tion and behavior which can be very useful in clinical as-sessment. The other important message is that the acoustic features we considered seem to convey discriminative infor-mation, at least in classification between PSP and MSA.
(a) 2-dimensional FDA
(b) 2-dimensional FDA followed by LR
Fig. 3. 2-dimensional projection of acoustic features
5. CONCLUSION
We presented a machine learning methodology to handle the problem of small amount of training data in differential di-agnosis between PSP and MSA. We showed that FDA and LR can lead to robust classifiers in term of accuracy and gen-eralization ability. Moreover, our methodology allows easy interpretation of feature contribution and behavior which can be very useful in clinical assessment. While the results we obtained are very encouraging and promising, we emphasize however that no final conclusion can be drawn at this stage. These results need indeed to be confirmed by additional data and studies. This is the purpose of our ongoing research. We are actually in the process of collecting a (relatively) large speech corpus of French PD and APS patients (in the frame-work of a large pilot study involving top French university hospitals in the field of Parkinsonism).
6. REFERENCES
[1] A. Schrag, Y. Ben-Shlomo, and N.P. Quinn, “Prevalence of progressive supranuclear palsy and multiple system atrophy: a cross-sectional study,” The Lancet, vol. 354, pp. 1771–1775, November 1999.
[2] G.K. Wenning, I. Litvan, and E. Tolosa, “Milestones in atypical and secondary parkinsonisms,” Movement Disorders, vol. 26, pp. 1083–1095, May 2011.
[3] L. Brabenec, J. Mekyska, Z. Galaz, and I. Rektorova, “Speech disorders in parkinsons disease: early diagnos-tics and effects of medication and brain stimulation,” Journal of Neural Transmission, March 2017.
[4] S. Sachin, G. Shukla, V. Goyal, S. Singh, V. Aggarwal, M. Behari, et al., “Clinical speech impairment in parkin-son’s disease, progressive supranuclear palsy, and mul-tiple system atrophy,” Neurology India, vol. 56, pp. 122, 2008.
[5] S. Skodda, W. Visser, and U. Schlegel, “Acoustical anal-ysis of speech in progressive supranuclear palsy,” Jour-nal of Voice, vol. 25, pp. 725–731, November 2011. [6] Y.E. Huh, J. Park, M.K Suh, S.E. Lee, J. Kim, Y. Jeong,
H. Kim, and J.W. Cho, “Differences in early speech patterns between parkinson variant of multiple system atrophy and parkinsons disease,” Brain and language, vol. 147, pp. 14–20, May 2015.
[7] J. Rusz, C. Bonnet, J. Klempir, T. Tykalova, E. Baborov, M. Novotny, A. Rulseh, and E. Ruzicka, “Speech disor-ders reflect differing pathophysiology in parkinsons dis-ease, progressive supranuclear palsy and multiple sys-tem atrophy,” Journal of neurology, vol. 262, pp. 992– 1001, 2015.
[8] J.R. Duffy, Motor Speech Disorders Substrates, Differ-ential Diagnosis, and Management, Elsevier, 2013. [9] I. Litvan, Y. Agid, D. Calne, G. Campbell, B. Dubois,
R.C. Duvoisin, C.G. Goetz, L. Golbe, J. Grafman, J.H. Growdon, et al., “Clinical research criteria for the diagnosis of progressive supranuclear palsy (steele-richardson-olszewski syndrome) report of the ninds-spsp international workshop,” Neurology, vol. 47, pp. 1–9, 1996.
[10] S. Gilman, G.K. Wenning, P.A. Low, D.J. Brooks, C.J. Mathias, et al., “Second consensus statement on the di-agnosis of multiple system atrophy,” Neurology, vol. 71, pp. 670–676, August 2008.
[11] J. Rusz, R. Cmejla, H. Ruzickova, J. Klempir, V. Ma-jerova, J. Picmausova, J. Roth, and E. Ruzicka, “Acous-tic assessment of voice and speech disorders in parkin-son’s disease through quick vocal test,” Movement Dis-orders, vol. 26, pp. 1951–1952, April 2011.
[12] J. Rusz, R. Cmejla, H. Ruzickova, and E. Ruzicka, “Quantitative acoustic measurements for characteriza-tion of speech and voice disorders in early untreated parkinsons disease,” The journal of the Acoustical Soci-ety of America, vol. 129, pp. 350–367, October 2011. [13] M. Novotny, J. Rusz, R. Cmejla, and E. Ruzicka,
“Auto-matic evaluation of articulatory disorders in parkinson’s disease,” IEEE/ACM Transactions on Audio, Speech and Language Processing (TASLP), vol. 22, pp. 1366– 1378, September 2014.
[14] J. Rusz, C. Bonnet, J. Klempir, T. Tykalova, E. Baborova, M. Novotny, and E. Ruzicka, “supple-mentary material: Acoustic measurements for objective evaluation of motor speech disorders.,” February 2015. [15] P. Boersma and D. Weenink, “Praat: doing phonetics by
computer [computer program],” Version 5.3.51, 2013. [16] Bruckl M., “Vocal tremor measurement based on
auto-correlation of contours.,” in INTERSPEECH, 2012, pp. 715–718.
[17] G. James, D. Witten, T. Hastie, and R. Tibshirani, An introduction to statistical learning, vol. 112, Springer, 2013.