Parasitisme chez le caribou migrateur : une étude
quasi-circumpolaire
Mémoire
Alice-Anne Simard
Maîtrise en biologie
Maître ès sciences (M.Sc.)
Québec, Canada
© Alice-Anne Simard, 2015
iii
Résumé
Les études comparatives réalisées selon un large éventail spatio-temporel sont fort utiles pour améliorer notre compréhension de l’état de santé des populations d'animaux sauvages. Ce mémoire vise à étudier le parasitisme chez le caribou migrateur (Rangifer tarandus) en Amérique du Nord et au Groenland. Un total de 1507 caribous a été échantillonné à travers douze troupeaux pour sept de leurs principaux macroparasites. L’intensité de Hypoderma
tarandi augmentait avec l’âge chez les mâles alors que le contraire a été observé chez les
femelles. La prévalence de Fascioloides magna, Taenia hydatigena et Cephenemyia trompe était plus élevée chez les adultes que chez les jeunes. La prévalence et l’intensité de F.
magna et la prévalence de T. hydatigena étaient plus élevées lorsque la taille des troupeaux
de caribous était élevée. Cette recherche fournit la première étude comparative de ces parasites helminthes et arthropodes chez le caribou migrateur à large échelle spatio-temporelle.
v
Abstract
Comparative studies across time and geographical regions are useful to improve our understanding of the health of wildlife populations. Our goal was to study parasitism in migratory caribou (Rangifer tarandus) of North America and Greenland. A total of 1507 caribou were sampled across twelve herds to assess seven of their main macroparasites. Intensity of Hypoderma tarandi increased with age for males while the opposite was observed in females. Prevalence of Fascioloides magna, Taenia hydatigena, and
Cephenemyia trompe was higher in adults than in calves. Prevalence and intensity of F. magna and prevalence of T. hydatigena were higher at high caribou herd sizes than at low
herd sizes. Our research provides the first comparative survey of these helminth and arthropod parasites of caribou across a broad spatial-temporal range.
vii
Table des matières
Résumé ... iii
Abstract ... v
Table des matières……….vii
Liste des tableaux ... xi
Liste des figures ... xv
Dédicace………... xvii
Remerciements ... xix
Avant-propos ... xxi
1. Introduction ... 1
1.1 Impact du parasitisme sur la dynamique des populations ... 1
1.2 Importance de décrire exhaustivement l’état de santé des populations animales ... 2
1.3 Effets des changements climatiques sur le parasitisme ... 3
1.4 Espèces à l’étude : le caribou et sept de ses principaux macroparasites ... 4
1.4.1 Caribou ... 4
1.4.2 Oestridés du dos (Hypoderma tarandi) ... 5
1.4.3 Oestridés des fosses nasales (Cephenemyia trompe) ... 6
1.4.4 Kystes du foie (Taenia hydatigena) ... 6
viii
1.4.6 Kystes hydatiques (Echinococcus granulosus) ... 7
1.4.7 Vers des poumons (Dictyocaulus eckerti) ... 8
1.4.8 Kystes des muscles (Taenia krabbei) ... 8
1.5 Objectifs de l’étude ... 9
2. Variation in the intensity and prevalence of the macroparasites of migratory caribou: a quasi-circumpolar study ... 11 Résumé ... 12 Abstract ... 13 2.1 Introduction ... 14 2.2 Methods ... 16 2.2.1 Studied species ... 17 2.2.2 Statistical analyses ... 18 2.3 Results ... 25 2.3.1 Hypoderma tarandi ... 24 2.3.2 Cephenemyia trompe ... 24 2.3.3 Taenia hydatigena ... 24 2.3.4 Fascioloides magna ... 25 2.3.5 Echinococcus granulosus ... 25 2.3.6 Dictyocaulus eckerti ... 25 2.3.7 Taenia krabbei ... 26 2.4 Discussion ... 29
ix
2.4.1 Factors influencing prevalence and intensity ... 29
2.4.2 Herd comparisons ... 32 2.5 Conclusion ... 34 Acknowledgments ... 34 Appendix 1 ... 36 Appendix 2 ... 58 3. Conclusion ... 64 3.1 Limites de l’étude ... 68 3. 2 Perspectives ... 69 4. Bibliographie ... 71
xi
Liste des tableaux
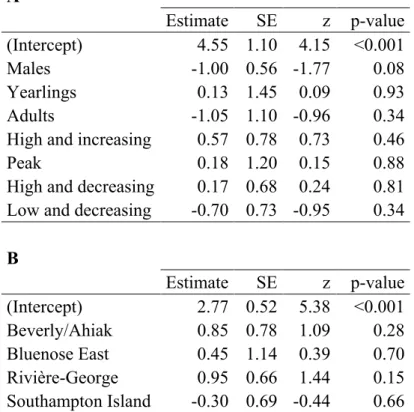
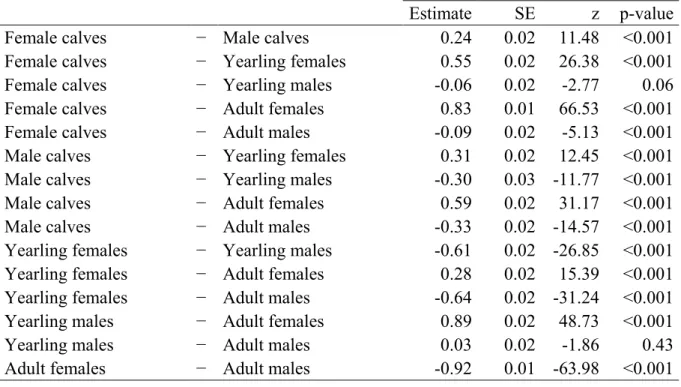
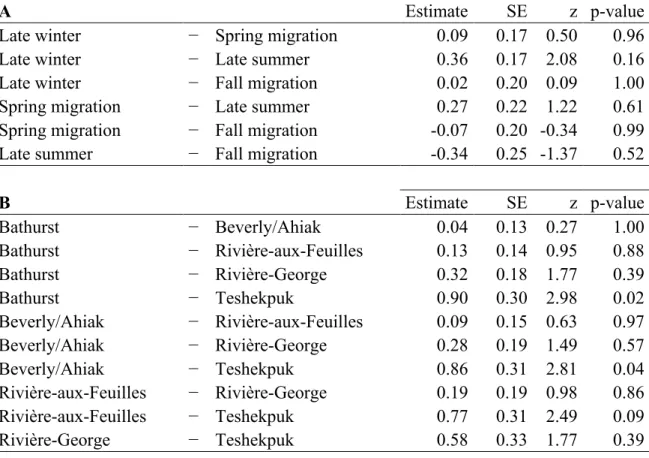
Tableau 1: Sample sizes for sex (1=females, 2=males), age class (1=calves, 2=yearlings, 3=adults), herd size (1=low and increasing, 2=high and increasing, 3=around the peak, 4=high and decreasing, 5=low and decreasing), and season (1=winter, 2=late winter/early spring, 3=spring migration/calving grounds, 4=late summer, 5=fall migration) to assess which factors affect the prevalence − the percentage of infected individuals in the host population − and the intensity − the average number of parasites per infected host − of seven of the main macroparasites of caribou (Rangifer tarandus). Data are from 2 or more herds for each parasite, except for Fascioloides magna that come only from the Rivière-George herd. The symbol « - » means that no data were collected for this category of sex, age class, herd size or season...21 Tableau 2: Description and life cycle of the seven main macroparasites of caribou (Rangifer tarandus) used in our study (Davis and Anderson 1971; Fréchette 1986; Kutz et al. 2012)...22 Tableau 3: Sample sizes used to compare twelve caribou (Rangifer tarandus) herds in terms of prevalence − the percentage of infected individuals in the host population − and intensity − the average number of parasites per infected host – for seven of their main macroparasites. The symbol « - » means that no data were collected for this herd...23 Tableau 4: Parameter estimates, standard errors (SE), z-values, and p-values for variables used in a generalized linear mixed model to assess which combination of factors such as sex, age class, and herd size (A) best describe the prevalence − the percentage of infected individuals in the host population − of warble larvae (Hypoderma tarandi) in caribou (Rangifer tarandus) and to make comparisons among herds (B) during the late winter/early spring season (mid-February to April). Only the best model is presented...36 Tableau 5: Parameter estimates, standard errors (SE), z-values, and p-values for variables used in a generalized linear mixed model to assess which addition or combination of factors such as sex, age class, and herd size (A) best describe the intensity − the average number of parasites per infected host − of warble larvae (Hypoderma tarandi) in caribou (Rangifer
tarandus) and to make comparisons among herds in adult females (B) during the late
winter/early spring season (mid-February to April). Only the best model is presented...37 Tableau 6: Parameter estimates, standard errors (SE), z-values, and p-values of pairwise comparisons of the intensity − the average number of parasites per infected host − of warble larvae (Hypoderma tarandi) in caribou (Rangifer tarandus) between sexes in interaction with age classes (A) and among herds in adult females (B) during the late winter/early spring season (mid-February to April)...38 Tableau 7: Parameter estimates, standard errors (SE), z-values, and p-values for variables used in a generalized linear mixed model to assess which combination of factors such as sex, age class, herd size, and season (A) best describe the prevalence − the percentage of infected individuals in the host population − of nose bot larvae (Cephenemyia trompe) in
xii
caribou (Rangifer tarandus) and to make comparisons among herds in adults (B) during the late winter/early spring season (mid-February to April). Only the best model is presented. ...40 Tableau 8: Parameter estimates, standard errors (SE), z-values, and p-values of pairwise comparisons of the prevalence − the percentage of infected individuals in the host population − of nose bot larvae (Cephenemyia trompe) in caribou (Rangifer tarandus) among age classes (A) and among herds in adults (B) during the late winter/early spring season (mid-February to April)...41 Tableau 9: Parameter estimates, standard errors (SE), z-values, and p-values for variables used in a generalized linear mixed model to assess which combination of factors such as sex, age class, herd size, and season (A) best describe the prevalence − the percentage of infected individuals in the host population − of liver cysts (Taenia hydatigena) in caribou (Rangifer tarandus) and to make comparisons among herds in adults and when the herd size was high and decreasing (B). Only the best model is presented...42 Tableau 10: Parameter estimates, standard errors (SE), z-values, and p-values of pairwise comparisons of the prevalence − the percentage of infected individuals in the host population − of liver cysts (Taenia hydatigena) in caribou (Rangifer tarandus) among age classes (A), herd sizes (B) and among herds in adults and when the herd size was high and decreasing (C)...43 Tableau 11: Parameter estimates, standard errors (SE), z-values, and p-values for variables used in a generalized linear mixed model to assess which combination of factors such as sex, herd size, and season (A) best describe the intensity − the average number of parasites per infected host − of liver cysts (Taenia hydatigena) in adult caribou (Rangifer tarandus) and to make comparisons among herds (B). Only the best model is presented...45 Tableau 12: Parameter estimates, standard errors (SE), z-values, and p-values of pairwise comparisons of the intensity − the average number of parasites per infected host − of liver cysts (Taenia hydatigena) in adult caribou (Rangifer tarandus) among seasons (A) and to make comparisons among herds (B)...46 Tableau 13: Parameter estimates, standard errors (SE), z-values, and p-values for variables used in a generalized linear mixed model to assess which addition or combination of factors such as sex, herd size, and season (A) best describe the prevalence − the percentage of infected individuals in the host population − of giant liver flukes (Fascioloides magna) in caribou (Rangifer tarandus) of the Rivière-George herd and to make comparisons between this herd and the Rivière-aux-Feuilles herd in adults during the spring migration/calving grounds season (May to July) and when the herd size was around the peak (B). Only the best model is presented...47 Tableau 14: Parameter estimates, standard errors (SE), z-values, and p-values of pairwise comparisons of the prevalence − the percentage of infected individuals in the host population − of giant liver flukes (Fascioloides magna) in caribou (Rangifer tarandus) of the Rivière-George herd among age classes (A); herd sizes (B); and seasons (C)...48
xiii Tableau 15: Parameter estimates, standard errors (SE), z-values, and p-values for variables used in a generalized linear mixed model to assess which combination of factors such as sex, herd size, and season (A) best describe the intensity − the average number of parasites per infected host − of giant liver flukes (Fascioloides magna) in adult female caribou (Rangifer tarandus) of the Rivière-George herd and to make comparisons between this herd and the Rivière-aux-Feuilles herd during spring migration/calving grounds season (May to July) and when the herd size was around the peak (B). Only the best model is presented. ...49 Tableau 16: Parameter estimates, standard errors (SE), z-values, and p-values of pairwise comparisons of the intensity − the average number of parasites per infected host − of giant liver flukes (Fascioloides magna) in adult female caribou (Rangifer tarandus) of the Rivière-George herd among herd sizes (A) and seasons (B)...50 Tableau 17: Parameter estimates, standard errors (SE), z-values, and p-values for variables used in a generalized linear mixed model to assess which combination of factors such as sex, herd size, and season (A) best describe the prevalence − the percentage of infected individuals in the host population − of hydatid cysts (Echinococcus granulosus) in caribou (Rangifer tarandus) and to make comparisons among herds (B). Only the best model is presented...51 Tableau 18: Parameter estimates, standard errors (SE), z-values, and p-values of pairwise comparisons of the prevalence − the percentage of infected individuals in the host population − of hydatid cysts (Echinococcus granulosus) caribou (Rangifer tarandus) among herds...52 Tableau 19: Parameter estimates, standard errors (SE), z-values, and p-values for variables used in a generalized linear mixed model to assess which combination of factors such as sex, herd size, and season (A) best describe the prevalence − the percentage of infected individuals in the host population − of lungworms (Dictyocaulus eckerti) in caribou (Rangifer tarandus) and to make comparisons among herds during the late winter/early spring season (mid-February to April) (B). Only the best model is presented...53 Tableau 20: Parameter estimates, standard errors (SE), z-values, and p-values of pairwise comparisons of the prevalence − the percentage of infected individuals in the host population − of lungworms (Dictyocaulus eckerti) caribou (Rangifer tarandus) among seasons...54 Tableau 21: Parameter estimates, standard errors (SE), z-values, and p-values for variables used in a generalized linear mixed model to assess which combination of factors such as sex, herd size, and season (A) best describe the prevalence − the percentage of infected individuals in the host population − of muscle cysts (Taenia krabbei) in caribou (Rangifer
tarandus) and to make comparisons among herds (B). Only the best model is presented.
...55 Tableau 22: Parameter estimates, standard errors (SE), z-values, and p-values of pairwise comparisons of the prevalence − the percentage of infected individuals in the host population − of muscle cysts (Taenia krabbei) caribou...56
xiv
Tableau 23: Mean, standard deviation (SD) and median of the overall prevalence (A) − the percentage of infected individuals in the host population – and intensity (B) − the average number of parasites per infected host − of warble larvae (Hypoderma tarandi) in caribou (Rangifer tarandus) separated by herd, sex and age class. The symbol « - » means that no data were collected...58 Tableau 24: Mean, standard deviation (SD) and median of the overall prevalence − the percentage of infected individuals in the host population – of nose bot larvae (Cephenemyia
trompe) in caribou (Rangifer tarandus) separated by herd, sex and age class. The symbol «
- » means that no data were collected...59 Tableau 25: Mean, standard deviation (SD) and median of the overall prevalence (A) − the percentage of infected individuals in the host population – and intensity (B) − the average number of parasites per infected host − of liver cysts (Taenia hydatigena) in caribou (Rangifer tarandus) separated by herd, sex and age class. The symbol « - » means that no data were collected...60 Tableau 26: Mean, standard deviation (SD) and median of the overall prevalence (A) − the percentage of infected individuals in the host population – and intensity (B) − the average number of parasites per infected host − of giant liver flukes (Fascioloides magna) in caribou (Rangifer tarandus) separated by herd, sex and age class. The symbol « - » means that no data were collected...61 Tableau 27: Mean, standard deviation (SD) and median of the overall prevalence − the percentage of infected individuals in the host population – of hydatid cysts (Echinococcus
granulosus) in caribou (Rangifer tarandus) separated by herd, sex and age class. The
symbol « - » means that no data were collected...62 Tableau 28: Mean, standard deviation (SD) and median of the overall prevalence − the percentage of infected individuals in the host population – of lungworms (Dictyocaulus
eckerti) in caribou (Rangifer tarandus) separated by herd, sex and age class. The symbol « -
» means that no data were collected...63 Tableau 29: Mean, standard deviation (SD) and median of the overall prevalence − the percentage of infected individuals in the host population – of muscle cysts (Taenia krabbei) in caribou (Rangifer tarandus) separated by herd, sex and age class. The symbol « - » means that no data were collected...64
xv
Liste des figures
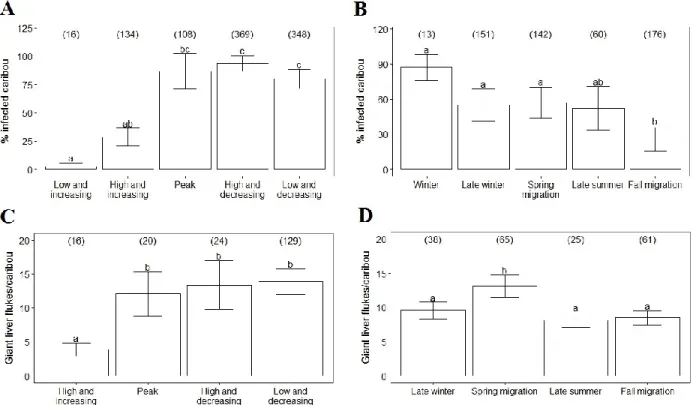
Figure 1: Annual range based on telemetry locations of the twelve studied caribou herds (Rangifer tarandus) in North America and Greenland...20 Figure 2. Intensity − the average number of parasites per infected host − of warble larvae (Hypoderma tarandi) according to age class in male (M) and female (F) migratory caribou (Rangifer tarandus) during the late winter/early spring season (mid-February to April). Different letters denote different means within sex and age classes (Table 6A). Error bars represent mean ± SE. Sample sizes are shown in parentheses...26 Figure 3. A) Intensity − the average number of parasites per infected host − of warble larvae (Hypoderma tarandi) in adult females during the late winter/early spring season (mid-February to April); B) Prevalence − the percentage of infected individuals in the host population − of nose bot larvae (Cephenemyia trompe) in adults during the late winter/early spring season; C) Prevalence of liver cysts (Taenia hydatigena) in adults when the herd size was high and decreasing; and D) Prevalence of muscle cysts (Taenia krabbei) in different herds of migratory caribou (Rangifer tarandus). Different letters denote different means (Tables 6B, 8B, 10B, 22). Error bars represent mean ± SE. Sample sizes are shown in parentheses...27 Figure 4. Prevalence − the percentage of infected individuals in the host population − of giant liver flukes (Fascioloides magna) according to A) herd size and B) season; mean intensity − the average number of parasites per infected host − of giant liver flukes according to C) herd size and D) season in caribou (Rangifer tarandus) from the Rivière-George herd. The five seasons were defined considering the ecology of caribou and their parasites: winter (December to mid-February), late winter/early spring (mid-February to April), spring migration/calving grounds (May to July), late summer (August and September), and fall migration (October and November). Herd size was divided into five phases that accounted for both herd size and trend: low and increasing, high and increasing, around the peak, high and decreasing, and low and decreasing. For intensity, data were collected only from adult females and there was no data when the herd size was low and increasing. Different letters denote different means (Tables 14B, 14C, 16A, 16B). Error bars represent mean ± SE. Sample sizes are shown in parentheses……...28
xvii
xix
Remerciements
J’ai repoussé l’écriture de cette section jusqu’à la toute fin de la rédaction de mon mémoire parce que je trouve que les remerciements sont oh combien importants, mais si terrifiants à écrire. Après tout, une personne n’a habituellement qu’une seule chance dans sa vie de remercier les gens qui l’ont aidée durant sa maîtrise! Premièrement, je voudrais remercier tous les partenaires financiers de Caribou Ungava et de CARMA, particulièrement le programme de l’Année Polaire Internationale du Gouvernement du Canada, ArcticNet, l’Université Laval, l’Université de Calgary, le Gouvernement du Nunavut, le Gouvernement du Yukon, l’Université de la Saskatchewan, le Nunavik Research Center, le Gouvernement des Territoires du Nord-Ouest, la Greenland Institute of Natural Resources, le Ministère des Ressources Naturelles et de la Faune du Québec, le Conseil de recherches en sciences naturelles et en génie du Canada (CRSNG), Hydro-Québec, Glencore Mine Raglan et la Fédérations des pourvoiries du Québec.
Merci également à Steeve D. Côté, mon directeur, pour la belle opportunité que tu m’as offerte, même si tu me connaissais peu. Cette maîtrise a été une expérience incroyable et je t’en serai toujours reconnaissante de m’avoir fait confiance. J’espère avoir été à la grandeur de tes attentes. Merci aussi à Susan Kutz. Thank you for your great contribution to this project, for welcoming me in your lab, and for your explanations of host-parasite systems. Your sharp parasitologist mind helped me understand many things. Merci à Conrad Cloutier et à Gwenaël Beauplet pour la révision de mon proposé de recherche et merci à Gilles Gauthier et à Julien Mainguy pour la révision de ce mémoire. Merci à Jean-Pierre Tremblay qui, bien qu’il ne soit ni mon directeur ni mon co-directeur, a toujours été présent pour me donner des conseils (et des postes d’auxiliaire de cours!). Même si nous ne sommes plus voisins, j’espère continuer à te croiser dans le Vieux-Québec parce que ça me met toujours de bonne humeur. Merci aussi à Glenn Yannic d’avoir révisé mon manuscrit et bonne chance à toi et à toute ta petite famille de l’autre côté de l’Atlantique. Merci à Sébastien Lavoie qui m’a engagée comme assistante de terrain il y a plus de 3 ans et qui est depuis devenu un véritable mentor. Merci pour tes conseils, pour ton aide et pour tes allégeances politiques! Merci à Valérie Saucier pour les beaux moments passés à Matane, à
xx
BD, à Halifax et au 3050. Quand j’avais envie de m’arracher les cheveux de sur la tête, parler avec toi me fais toujours un bien fou. Merci aussi à Émilie Champagne qui était professionnelle de recherche quand j’ai commencé ma maîtrise et qui m’a beaucoup aidé et conseillé. Je t’ai toujours secrètement considéré comme ma grande (petite!) sœur. Merci à tous les autres membres des labo Côté et Tremblay, vous êtes une merveilleuse gang et je me considère choyée d’avoir eu la chance de vous côtoyer durant les deux dernières années. Merci pour vos nombreux conseils en statistiques, sur mes présentations orales et sur comment survivre dans le monde des études graduées. Merci aussi à Sonia De Bellefeuille et à Caroline Hins, les deux professionnelles de recherche du labo qui sont toujours présentes pour nous aider. Merci à ma famille et particulièrement à mes parents, Raymonde Tourigny et André Simard. Merci pour votre support indéfectible et votre confiance inébranlable en mes capacités. Merci également de m’avoir appris à m’émerveiller devant les beautés de la nature. Et finalement, le dernier mais non le moindre, merci à Vincent Baillargeon pour ton amour et ton support, et merci de toujours réussir à me faire rire dans les moments difficiles.
xxi
Avant-propos
Ce mémoire est construit sous la forme d’un article scientifique en anglais, avec une introduction et une conclusion générale en français. Je suis l’auteure principale de ce mémoire et j’ai réalisé l’analyse des données, l’interprétation des résultats et la rédaction. Steeve D. Côté et Susan Kutz ont contribué à la conception du projet, à la collecte des données, à l’interprétation des résultats, à la révision et à l’approbation finale. Cet article n’a pas encore été soumis pour publication.
1
1. Introduction
Il existe une hypothèse stipulant qu’un parasite affecte très peu son hôte, prévenant de la sorte son éradication (Grundmann et al. 1976). Cependant, le parasitisme est par définition associé à une diminution de la survie et/ou du succès reproducteur de l’hôte (Anderson and May 1978; May and Anderson 1978). Son rôle écologique peut donc être majeur.
1.1 Impact du parasitisme sur la dynamique des populations
De plus en plus d’études suggèrent que le parasitisme peut avoir un impact sur la dynamique des populations animales de par son effet sur les composantes biodémographiques individuelles (Gulland 1992; Hudson et al. 1998; Irvine 2006). En effet, les populations animales pourraient être régies par des effets indirects du parasitisme sur la survie, la condition corporelle et la fécondité. Par exemple, Bakker et al. (1997) ont trouvé que Pomphorhynchus laevis, un acanthocéphale parasite de Gammarus pulex, une espèce de macro-invertébrés, diminue la survie de son hôte en changeant sa coloration et son comportement, l’exposant ainsi davantage à la prédation. Irvine et al. (2006) ont montré que chez le cerf élaphe (Cervus elaphus), les adultes ayant un taux d’infection élevé par un nématode gastro-intestinal présentaient des indices de condition corporelle plus bas que les autres individus. Le parasitisme pourrait également être responsable des fluctuations cycliques des populations de lièvre variable (Lepus timidus) par son effet négatif sur la fécondité (Newey and Thirgood 2004). Il a été démontré qu’un traitement antihelminthique − c’est-à-dire qui détruit les parasites gastro-intestinaux − augmentait le taux de fécondité des femelles, sans toutefois affecter leur condition corporelle et leur survie hivernale (Newey and Thirgood 2004).
En plus de ses effets directs sur la dynamique des populations hôtes, le parasitisme chez les animaux sauvages peut également avoir des répercussions importantes sur les humains qui dépendent de la faune pour se nourrir. Les parasites peuvent affecter l’accessibilité, la qualité, la quantité et la salubrité de la viande et des autres produits d'origine animale en plus de rendre la viande moins appétissante. Par exemple, la viande présentant beaucoup de kystes de Taenia est souvent écartée par les chasseurs (Kutz et al. 2012). Les changements dans la biodiversité des parasites et/ou dans les processus pathologiques qui y sont associés
2
peuvent influencer la nutrition, les niveaux d'activité et la viabilité des activités culturelles des communautés, particulièrement pour les peuples autochtones du Nord. En effet, pour de nombreux habitants des régions éloignées, la faune est primordiale pour l’acquisition de nourriture par la chasse de subsistance et le maintien de nombreuses traditions culturelles, en plus de permettre la création d’activités économiques liées à la chasse sportive et au tourisme (Davidson et al. 2011). Or, dans ces communautés où les aliments provenant de la nature ne subissent pas de contrôle des organismes sanitaires, l’émergence de nouveaux pathogènes peut causer des préoccupations et des incertitudes quant à la qualité de la viande et résulter en une perte de confiance des peuples envers la nourriture traditionnelle, ce qui pourrait entraîner la disparition de traditions culturelles et une réduction de la santé globale de la communauté (Kutz et al. 2012).
1.2 Importance de décrire exhaustivement l’état de santé des populations
animales
Le suivi de l’état de santé des populations animales est primordial pour la conservation et la gestion de la faune (Jean and Lamontagne 2004). L’état de santé d’une population peut avoir plusieurs composantes, notamment la condition corporelle des individus, la diversité génétique, la santé physiologique, les niveaux de contaminants et la diversité et l’abondance de pathogènes et de parasites (Kutz et al. 2013a). Pour comprendre l’écologie d’une espèce, il est important d’examiner les relations entre les différentes composantes de son état de santé et de suivre son évolution dans le temps à travers les populations et les régions géographiques. Pour ce faire, l’acquisition d’une base de données exhaustive décrivant l'état de santé actuel de l’espèce est nécessaire (Karesh and Cook 1995). Établir l’état de santé actuel d’une espèce dans plusieurs situations démographiques différentes et pour l’ensemble de son aire de répartition permet de définir ce qui est normal ainsi que la variabilité autour de cette valeur, permettant ainsi une détection rapide de futurs cas anormaux (Kutz et al. 2013a). L'émergence de nouvelles et la réémergence de vieilles maladies ainsi que la transmission de pathogènes et de parasites entre la faune, les animaux domestiques et les humains ont mis en évidence la nécessité d’un suivi efficace des maladies (Kuiken et al. 2005). Pour utiliser les parasites comme indicateur de l’état de santé des populations, il est particulièrement important de connaître leur biodiversité, leur
3 distribution et leur cycle vital (Hoberg et al. 2003; Hoberg et al. 2008). Chez les mammifères, les données sur les systèmes hôte-parasites proviennent pour la plupart d’études transversales, et bien que ce type d’étude apporte certaines contraintes, si l’échantillonnage est standardisé et réalisé à large échelle spatio-temporelle et avec une grande taille d’échantillon, l’étude peut être particulièrement efficace et représentative (Kutz et al. 2012; Kutz et al. 2013a). Les données provenant de ces études peuvent fournir des mesures fiables de la diversité des parasites et des interactions entre ceux-ci et divers facteurs biotiques et abiotiques, tels que la taille et la démographie des populations hôtes et les conditions environnementales. Ces études peuvent également aider à identifier les associations entre la diversité et l’abondance des parasites et l’état de santé général de l’hôte malgré qu’il soit difficile de déterminer de manière irréfutable les relations de cause à effet. En plus de permettre l’acquisition d’informations nouvelles, ces études peuvent également aider à générer de nouvelles hypothèses (Scott 1988; Davidson et al. 2011; Kutz et al. 2012; Kutz et al. 2013a).
1.3 Effets des changements climatiques sur le parasitisme
Les changements climatiques constituent une grande menace pour les écosystèmes arctiques parce qu’ils y opèrent à une vitesse plus grande que sur le reste du globe. En effet, durant les 150 dernières années, alors que la température annuelle moyenne à la surface du globe a augmenté de 0.4°C, cette augmentation a été deux à trois fois plus rapide dans l’Arctique que dans le reste du monde (Post et al. 2009; IPCC 2013). La niche écologique des parasites vivant dans les milieux nordiques est souvent restreinte par les conditions environnementales. Une augmentation de la température annuelle moyenne pourrait affecter les relations hôte-parasites, particulièrement chez les espèces de macroparasites qui ont un ou plusieurs stades de leur cycle vital libres dans l’environnement et dont le développement et la survie sont influencés par la température (Kutz et al. 2004; Kutz et al. 2005; Hoberg et al. 2008). Le taux de développement, le taux de transmission, la distribution spatiale et le nombre de générations annuelles du parasite ainsi que la susceptibilité à l’infection de l’hôte risquent d’être modifiés par l’augmentation appréhendée de la température (Harvell et al. 2002; Kutz et al. 2005; Kutz et al. 2009; Davidson et al. 2011). Kutz et al. (2005) ont développé un modèle empirique prédisant
4
l’impact des changements climatiques sur le développement d’un nématode parasite du bœuf musqué (Ovibos moschatus). À l’aide de ce modèle, les chercheurs ont trouvé que l’augmentation de la température a déjà modifié le taux de développement de ce parasite, passant d’un cycle vital d’une durée de deux ans à un cycle vital d’une durée d’un an. Witter (2010) a trouvé que depuis la fin des années 1950, les conditions environnementales sont de plus en plus favorables au développement et à l’activité des œstridés, des parasites connus pour affecter le comportement et augmenter les dépenses énergétiques du caribou (Rangifer tarandus) (Folstad et al. 1991; Hagemoen and Reimers 2002; Colman et al. 2003; Witter et al. 2012).
1.4 Espèces à l’étude : le caribou et sept de ses principaux macroparasites
1.4.1 Caribou
Le caribou est très répandu et abondant dans les régions arctiques de l’Amérique du Nord et sa diversité génétique est structurée géographiquement en deux lignées principales : la lignée du Nord-Est de l’Amérique qui s’étend de Terre-Neuve au Manitoba, et la lignée Euro-Béringienne qui couvre le reste de la distribution circumpolaire (Yannic et al. 2014). Il est une espèce clé pour les populations de prédateurs (Dale et al. 1994; Mowat and Heard 2006; Musiani et al. 2007) en plus d’affecter la structure de la végétation (Olofsson et al. 2009; Champagne et al. 2012; Zamin and Grogan 2013). Le caribou est aussi, à travers la chasse de subsistance, la chasse sportive et le tourisme, une source de nourriture et de revenus primordiale pour les peuples autochtones nordiques en plus d’être un élément clé de plusieurs activités traditionnelles et de croyances spirituelles (Van Oostdam et al. 1999; Jean and Lamontagne 2004; Hummel and Ray 2008). Cependant, plusieurs troupeaux de caribous vivant dans les régions nordiques sont présentement en déclin, avec un taux de décroissance plus élevé que les fluctuations démographiques habituelles (Vors and Boyce 2009). Même si les populations de caribous ont connu de grandes variations démographiques dans le passé (Crête et al. 1996; Couturier et al. 2004), il n’est pas certain qu’elles pourront rebondir, c’est-à-dire revenir à des niveaux de taille de troupeau semblables à ceux précédant le déclin (Festa-Bianchet et al. 2011). Les causes de ce déclin sont méconnues bien que la dégradation de l’habitat, la chasse sportive, le développement
5 industriel et les changements climatiques pourraient être en partie responsables (Festa-Bianchet et al. 2011).
Un groupe de scientifiques, de représentants de la communauté et d’organismes de gestion du caribou portant le nom de CircumArctic Rangifer Monitoring and Assessment Network (CARMA, www.caff.is/carma) a été créé en 2001 pour mieux comprendre les impacts des changements climatiques sur le caribou migrateur (Russell et al. 2013). CARMA a développé des protocoles standardisés d’échantillonnage durant l’Année Polaire Internationale, ce qui a conduit à la collecte d'un ensemble de données sur la condition et la taille corporelle ainsi que sur plusieurs indicateurs de l’état de santé du caribou, notamment la diversité et l’abondance de parasites et ce, pour plusieurs troupeaux (Kutz et al. 2013a). Bien que trente-cinq espèces de parasites aient été rapportées chez le caribou grâce à ce vaste effort d’échantillonnage (Kutz et al. 2012), notre étude se concentre sur sept de ses principaux macroparasites dont l’échantillonnage a été fait sur plusieurs troupeaux et années (Kutz et al. 2013a).
1.4.2 Oestridés du dos (Hypoderma tarandi)
La famille des œstridés dont fait partie Hypoderma tarandi sont des arthropodes très abondants et étudiés chez les ongulés arctiques. Bien que le caribou soit le principal hôte d’H. tarandi, des larves ont déjà été rapportées chez le bœuf musqué (Gunn et al. 1991; Samuelsson et al. 2013), le cerf élaphe (Nilssen and Gjershaug 1988) et l’orignal (Alces
americanus) (Lejeune Virapin, comm. pers.). L’adulte pond ses œufs sur les poils du dos et
des pattes du caribou entre la mi-juillet et la mi-août (Anderson and Nilssen 1996). Après l’éclosion, les larves pénètrent sous la peau et s’y développent jusqu’au printemps suivant. En mai et juin, les larves quittent l’hôte par un trou de respiration créée dans sa peau, laissant une cicatrice bien visible. Elles se métamorphosent ensuite au sol d’où elles émergent en tant qu’adultes quelques semaines plus tard (Kutz et al. 2012). Les adultes sont capables de localiser leurs hôtes et de suivre leur trace sur de longues distances (Nilssen and Anderson 1995). Le harcèlement par les mouches adultes entraîne une réduction du temps d’alimentation et une augmentation des dépenses énergétiques du caribou, résultant en une diminution de sa condition corporelle (Downes et al. 1986; Hagemoen and Reimers 2002; Colman et al. 2003; Weladji et al. 2003) et pourrait être responsable du mouvement
6
vers les aires d’estivage après la mise bas chez le caribou migrateur (Folstad et al. 1991). L’abondance de larves est aussi associée à une réduction de la condition corporelle (Huot and Beaulieu 1985; Hughes et al. 2009; Ballesteros et al. 2012) et du succès reproducteur chez le caribou (Cuyler et al. 2012; Pachkowski et al. 2013).
1.4.3 Oestridés des fosses nasales (Cephenemyia trompe)
Ce parasite arthropode fait aussi partie de la famille des œstridés et est considéré comme spécifique à Rangifer. Les adultes injectent leurs larves L1 (premier stade larvaire) sur la lèvre supérieure du caribou durant l’été. Les larves migrent ensuite vers le palais et jusqu’aux voies respiratoires où elle maturent durant l’hiver. En mai et juin, le caribou expulse les larves L3 (dernier stade larvaire et stade infectieux) en toussant et ces dernières se métamorphosent au sol d’où elles émergent en tant qu’adultes quelques semaines plus tard (Kutz et al. 2012). Le harcèlement par les mouches adultes entraîne aussi une diminution de la condition corporelle chez le caribou (Downes et al. 1986; Hagemoen and Reimers 2002; Colman et al. 2003; Weladji et al. 2003), mais les relations entre l’abondance de larves et la condition corporelle et le succès reproducteur sont moins bien connues pour cet œstridé (Cuyler et al. 2012; Kutz et al. 2012).
1.4.4 Kystes du foie (Taenia hydatigena)
Les espèces du genre Taenia sont des helminthes cestodes relativement communs chez les ongulés, les canidés et les ursidés arctiques à de faibles intensités. Les adultes de T.
hydatigena se retrouvent dans le petit intestin de l’hôte définitif, un carnivore,
habituellement un loup (Canis lupus) ou un coyote (Canis latrans) et parfois un chien domestique (Canis familiaris) ou un renard roux (Vulpes vulpes) ou arctique (Vulpes
alopex) (Fréchette 1986; Kapel and Nansen 1996; Lavikainen et al. 2011). Les œufs se
retrouvent dans les fèces de l’hôte définitif et sont ingérés par l’hôte intermédiaire via la végétation infectée. Les larves migrent par la circulation sanguine du système digestif vers le foie, l’omentum ou ailleurs dans la cavité péritonéale où elles s’enkystent. L’hôte définitif s’infecte en mangeant les organes contaminés de l’hôte intermédiaire. Dans l’Arctique, le caribou, le bœuf musqué et l’orignal sont des hôtes intermédiaires connus (Kutz et al. 2012). En général, ce parasite ne semble pas causer de pathologie sévère chez ses hôtes, mais la migration des larves dans le foie peut causer des dommages aux tissus
7 (Sweatman and Plummer 1957). Des études transversales chez le caribou n’ont montré aucune relation significative entre le nombre de kystes du foie et la condition corporelle (Huot and Beaulieu 1985; Thomas 1994; Pollock et al. 2009).
1.4.5 Douves du foie (Fascioloides magna)
Dans l’Arctique, ce parasite helminthe se retrouve exclusivement chez le caribou et le bœuf musqué du Québec et du Labrador (Choquette et al. 1971; Lankester and Luttich 1988; Pollock et al. 2009). Ailleurs en Amérique du Nord, le cerf de Virginie (Odocoileus
virginianus) et l’orignal sont aussi des hôtes définitifs. Les œufs sont sécrétés dans les fèces
de l’hôte définitif et éclosent en larves dans la végétation humide où elles contaminent l’hôte intermédiaire, un escargot d’eau douce de la famille des Lymnaeidés (Pybus 2001). L’hôte définitif ingère accidentellement l’escargot contaminé et les larves se retrouvent dans son système digestif puis dans sa circulation sanguine pour finalement atteindre le foie. Les douves adultes s’y enkystent, généralement en paire, et peuvent y demeurer plusieurs années. Toutefois, chez l’orignal, les larves n’atteignent pas la maturité et la migration continue de douves immatures peut mener à la mort de l’hôte (Pybus 2001; Kutz et al. 2012). Même chez ses hôtes définitifs normaux, ce parasite peut causer des pathologies substantielles au foie (Pybus 2001). Malgré les dommages qu’il cause au foie, il n’y a pas d’évidence que F. magna a un effet négatif significatif sur la condition corporelle du caribou (Huot and Beaulieu 1985; Lankester and Luttich 1988; Pollock et al. 2009).
1.4.6 Kystes hydatiques (Echinococcus granulosus)
Le stade larvaire de ce parasite helminthe se retrouve sous forme de kyste hydatique dans les poumons du caribou, de l’orignal et du bœuf musqué à travers l’Amérique du Nord. Les vers adultes vivent dans le petit intestin de l’hôte définitif, un carnivore, principalement un loup et parfois un coyote ou un chien domestique, où ils causent peu de pathologie (Rausch 2003). Les œufs sont excrétés par les fèces du carnivore, contaminent la végétation et sont ingérés accidentellement par l’hôte intermédiaire. Le caribou, l’orignal, le cerf de Virginie, le wapiti (Cervus canadensis) et le cerf mulet (Odocoileus hemionus) sont des hôtes intermédiaires connus. Une fois dans le système digestif du cervidé, les larves migrent par la circulation sanguine jusqu’aux poumons où elles s’enkystent (Kutz et al. 2012). L’hôte
8
définitif s’infecte en mangeant les organes contaminés de l’hôte intermédiaire. Une étude transversale chez le caribou n’a pas détecté d’impact significatif de ce parasite sur la condition corporelle et la fécondité (Thomas 1994). Chez l’orignal cependant, une infection sévère aux kystes hydatiques pourrait prédisposer à la prédation par le loup (Joly and Messier 2004).
1.4.7 Vers des poumons (Dictyocaulus eckerti)
Les espèces du genre Dictyocaulus sont des helminthes nématodes pouvant atteindre plusieurs centimètres de long et retrouvés dans les bronches et bronchioles pulmonaires sous forme adulte. Les œufs ou les larves L1 sont excrétées dans la végétation par les fèces où elles maturent. Le cycle vital est direct, c’est-à-dire qu’il n’y a pas d’hôte intermédiaire. L’hôte, souvent un caribou, un bœuf musqué ou un orignal, s’infecte en ingérant les larves L3 qui contaminent la végétation. Ce parasite est connu pour causer des dommages pulmonaires significatifs chez le caribou (Rahko et al. 1992). Des évidences anecdotiques suggèrent qu’il pourrait aussi affecter la survie des jeunes chez le bœuf musqué et le caribou (Kutz et al. 2012).
1.4.8 Kystes des muscles (Taenia krabbei)
Le cycle vital et les hôtes intermédiaires et définitifs de ce parasite helminthe sont sensiblement les mêmes que pour Taenia hydatigena décrit plus haut. Les seules différences sont que les larves migrent par la circulation sanguine du système digestif vers les muscles squelettiques et cardiaque où elles s’enkystent au lieu de migrer vers le foie, et que l’ours noir (Ursus americanus), l’ours brun (Ursus arctos) et l’ours blanc (Ursus
maritimus) peuvent aussi être des hôtes définitifs (Kutz et al. 2012). Par défaut, tous les
kystes présents dans les muscles de caribou ont précédemment été décrits comme étant T.
krabbei, mais Catalano et al. (2014) ont récemment souligné un potentiel d’erreur
d’identification dans les études précédentes parce que T. krabbei et T. arctos sont morphologiquement très similaires, particulièrement sous leur forme immature (Haukisalmi et al. 2011). Il est donc important de noter que des espèces cryptiques sont présentes dans la faune arctique (Haukisalmi et al. 2011; Lavikainen et al. 2011; Raundrup et al. 2012; Catalano et al. 2014). Cependant, comme les kystes musculaires reportés dans ce mémoire
9 sont très probablement T. krabbei, ils seront référés comme tel même s’ils n’ont pas été identifiés moléculairement (Susan Kutz, communication personnelle).
1.5 Objectifs de l’étude
Cette étude, qui fait partie d’un large effort d’échantillonnage réalisé chez plusieurs troupeaux de la région circumpolaire pendant plusieurs années, permet de dresser un portrait global actuel et passé des macroparasites du caribou et établit une référence sur laquelle les recherches futures de surveillance pourront se baser pour évaluer l’évolution du parasitisme, particulièrement à l’aube des changements climatiques. Le premier objectif de l’étude est de déterminer quelles combinaisons de facteurs tels que le sexe, la classe d'âge, la taille du troupeau et la saison expliquent le mieux la prévalence et l'intensité de ces parasites chez le caribou migrateur. Le deuxième objectif de l’étude est de comparer douze troupeaux de l’Amérique du Nord et du Groenland afin de vérifier si la prévalence et l’intensité de ces parasites varient selon les troupeaux. Ce mémoire est présenté sous la forme d’un article scientifique rédigé en anglais adressant ces deux objectifs.
11
2. Variation in the intensity and prevalence of the
macroparasites of migratory caribou: a
quasi-circumpolar study
Alice-Anne Simard1,*, Susan Kutz2, Julie Ducrocq2, Kimberlee Beckmen3, Vincent Brodeur4, Mitch Campbell5,Bruno Croft6, Christine Cuyler7, Tracy Davison8, Jim Dau2, Brett Elkin6, Tina Giroux9, Allicia Kelly10, Lincoln S. Parett2, Don Russell11, Joëlle Taillon1, Alasdair Veitch12, and Steeve D. Côté1
Co-authors are listed alphabetically
1Université Laval, Département de biologie et Centre d’études nordiques, Pavillon Alexandre-Vachon, 1045 avenue de la
Médecine, Québec, Québec, Canada, G1V 0A6
2University of Calgary, Faculty of Veterinary Medicine, 3330 University Drive NW, Calgary, Alberta, Canada, T2N 4N1 3Alaska Department of Fish and Game, Division of Wildlife Conservation, 1300 College Road, Fairbanks, Alaska, USA,
99701
4Ministère des Forêts, de la Faune et des Parcs, Direction des opérations régionales du Nord-du-Québec, 951 boul. Hamel,
Chibougamau, Québec, Canada, G8P 2Z3
5Government of Nunavut, Department of Environment, Kivalliq Region. P.O. Box 120, Arviat, Nunavut, Canada, X0C
0E0
6Government of the Northwest Territories, Environment and Natural Resources, Wildlife Division, 600 5102-50th Ave,
Yellowknife, Northwest Territories, Canada, X1A 3S8
7Greenland Institute of Natural Resources, P. O. Box 570, 3900 Nuuk, Greenland
8Government of the Northwest Territories in Inuvik, Department of ENR, Inuvik Region Shell Lake, P. O. Box 2749,
Inuvik, Northwest Territories, Canada, X0E 0T0
9Athabasca Denesuline Né Né Land Corporation, P.O. Box 23126, South Hill, Prince Albert, Saskatchewan, Canada, S6V
8A7
10Government of the Northwest Territories, Environment and Natural Resources, South Slave Region, P.O. Box 900, Fort
Smith, Northwest Territories, Canada, X0E 0P0
11Conservation and Sustainability, Environment Canada, Canadian Wildlife Service, Pacific and Yukon Region, 91782
Alaska Hwy, Whitehorse, Yukon, Canada, Y1A 5B7
12Government of the Northwest Territories, Environment and Natural Resources, Wildlife Management – Sahtu Region,
P.O. Box 130, Norman Wells NT, Canada, X0E 0V0
12
Résumé
Les études comparatives réalisées selon un large éventail spatio-temporel sont fort utiles pour améliorer notre compréhension de l’état de santé des populations d'animaux sauvages. Ici, nous avons voulu étudier le parasitisme chez le caribou migrateur (Rangifer tarandus) en Amérique du Nord et au Groenland. Un total de 1507 caribous a été échantillonné à travers douze troupeaux pour une partie ou l’ensemble de sept de leurs principaux macroparasites entre 1978 et 2010, avec un effort d’échantillonnage accru en 2007-2010. Nous avons tenté de déterminer quelles combinaisons de facteurs tels que le sexe, la classe d'âge, la taille du troupeau et la saison expliquaient le mieux la prévalence et l'intensité de ces parasites. L’intensité de Hypoderma tarandi augmentait avec l’âge chez les mâles alors que le contraire a été observé chez les femelles. La prévalence de Fascioloides magna,
Taenia hydatigena et Cephenemyia trompe était plus élevée chez les adultes que chez les
jeunes de moins d’un an. La prévalence et l’intensité de F. magna et la prévalence de T.
hydatigena étaient plus élevées à forte taille de troupeau qu’à plus faible taille de troupeau.
Les deux troupeaux du Groenland avaient les prévalences de T. hydatigena et de T. krabbei les plus faibles alors qu’Echinococcus granulosus y était absent. Les troupeaux du Groenland différaient aussi des autres car ils avaient une plus grande intensité de H. tarandi et une plus grande prévalence de C. trompe que les autres troupeaux. Les deux troupeaux du Québec et du Labrador étaient les seuls au sein desquels on retrouvait F. magna et le troupeau de la Rivière-George avait une plus grande prévalence de ce parasite que le troupeau de la Rivière-aux-Feuilles. Cette recherche fournit la première étude comparative de ces helminthes et arthropodes parasites du caribou à large échelle spatiale et géographique.
13
Abstract
Comparative studies across time and geographical regions are useful to improve our understanding of the health of wildlife populations. Our goal was to study parasitism in migratory caribou (Rangifer tarandus) of North America and Greenland. A total of 1507 caribou were sampled across twelve herds to assess some or all of seven of their main macroparasites between 1978 and 2010 with the greatest sampling effort in 2007-2010. We sought to determine which combinations of factors such as sex, age class, herd size, and season best explained the prevalence and intensity of those parasites. Intensity of
Hypoderma tarandi increased with age for males while the opposite was observed in
females. Prevalence of Fascioloides magna, Taenia hydatigena, and Cephenemyia trompe was higher in adults than in calves. Prevalence and intensity of F. magna and prevalence of
T. hydatigena were higher at high herd size than at lower herd size. Greenland herds had
the lowest prevalence of T. hydatigena and Taenia krabbei, while Echinococcus granulosus was absent. Greenland herds also differed from other herds because they had a higher intensity of H. tarandi and a higher prevalence of C. trompe than the other herds. The two herds from Quebec and Labrador were the only ones with F. magna, and the Rivière-George herd had a higher prevalence of this parasite than the Rivière-aux-Feuilles herd. Our research provides the first comparative survey of these helminth and arthropod parasites of caribou across a broad spatial-temporal range.
14
2.1 Introduction
Determining parasite biodiversity as well as the abundance and variability of parasites within animal populations across the species range is crucial for the early detection of changes in health status (Scott 1988; Hoberg et al. 2003; Hoberg et al. 2008). Many studies have shown that parasitism is a key factor influencing the fitness of many organisms due to its effects on individual life-history components (Anderson and May 1978; May and Anderson 1978; Gulland 1992; Hudson et al. 1998; Irvine et al. 2006). Individuals within host populations often show a strong variation in the prevalence − the percent of infected individuals in the host population − and in the intensity of infection − the mean number of parasites per infected host. This variability is typical for macroparasites and is a function of a number of things, including the level of exposure and the ability to mount efficient immune defence mechanisms (Hudson et al. 2002; Christe et al. 2007).
Various factors can influence parasitism. For example, inter-individual variability within the host population can influence the prevalence and intensity of parasites. Sex of the host can impact the degree of infection, with males often being more infected than females (Hamilton and Zuk 1982; Zuk 1990; Poulin 1996), with some exceptions (McCurdy et al. 1998; Morales-Montor et al. 2004). Physiological, morphological, and behavioral differences between females and males could operate to create a sexual bias in infection levels. For instance, steroid hormones, particularly testosterone, could depress the immune system and thus play a major role in sex differences (Zuk 1990; Folstad and Karter 1992). The prevalence of long-lived parasites generally increase with age, starting when an animal is first susceptible to infection (Hudson and Dobson 1995). Many mechanisms could be responsible for age-dependent parasitism levels such as mortality induced by parasite infection, acquired immunity, and changes in exposure to infection with age (Hudson and Dobson 1995; Wilson et al. 2001). Transmission rate is also thought to increase with density of the host (Arneberg et al. 1998) and host group size (Patterson and Ruckstuhl 2013) because the probability that the infectious stage of the parasite (e.g. eggs or larvae) encounters a host then increases (Côté and Poulin 1995).
Seasonality can also affect the activity and the rate of transmission of parasites. This is particularly true for parasites that have life cycle stages that are free in the environment and
15 whose development and/or survival are sensitive to climatic conditions (Harvell et al. 2002; Kutz et al. 2009; Hoar et al. 2012). Because the rate of transmission of parasites is affected by climate, host-parasite systems could be greatly impacted by climate change (Kutz et al. 2005). In the Arctic, the effects of climate change are already evident, with global mean surface temperature having increased two to three times more than for the rest of the planet in the past 150 years (Post et al. 2009; IPCC 2013). Predictions of a warmer and wetter Arctic are expected to alter host-parasite interactions by increasing transmission rates and transmission periods, by shifting temporal patterns of parasite life history and by expanding spatial range of some parasites by decreasing environmental constraints (Kutz et al. 2004; Kutz et al. 2005; Brooks and Hoberg 2007; Hoar et al. 2012). However, for some parasites the impacts of a warming arctic climate are not as clear, with extremes in heat negatively impacting transmission (Hoar et al. 2012; Kutz et al. 2013b; Molnár et al. 2013). Thus, arctic ecosystems can provide considerable insight to understand and predict the responses of host-parasite systems to warming on a global scale (Kutz et al. 2009; Davidson et al. 2011).
Caribou (Rangifer tarandus) are widespread and abundant across the circumpolar Arctic (Festa-Bianchet et al. 2011). This is a keystone species supporting predator populations (Dale et al. 1994; Mowat and Heard 2006; Musiani et al. 2007), as well as affecting vegetation structure (Olofsson et al. 2009; Champagne et al. 2012; Zamin and Grogan 2013). Caribou are also central to the culture, spirituality, and diet of northern aboriginal peoples (Hummel and Ray 2008; Festa-Bianchet et al. 2011). Many caribou herds of the Arctic are now declining (Vors and Boyce 2009) and may not recover to herd sizes prior to the declines (Festa-Bianchet et al. 2011). The causes of the declines are unknown although habitat degradation, harvesting, industrial development and climate change could be singly or cumulatively responsible (Festa-Bianchet et al. 2011). Infectious diseases and parasites may also be a contributing driver for caribou herd fluctuations but empirical data supporting this assertion remain scarce (Albon et al. 2002). Here, we report variations in prevalence and intensity of infection of the main macroparasites of migratory caribou across several Arctic regions and years that will allow comparisons among herds and serve as baseline data against which to assess caribou vulnerability to parasitism and responses to environmental change. The objectives of this study were: i) to determine which
16
combinations of factors such as sex, age class, herd size, and season best explained the prevalence and intensity of seven of the main macroparasites of caribou and ii) to compare the prevalence and intensity of these macroparasites among twelve herds distributed across North America and Greenland.
2.2 Methods
A total of 1507 caribou (Table 1) were sampled across twelve herds from Alaska to Greenland (Figure 1) between 1978 and 2010 with the greatest sampling effort in 2007-2010. Sampling was done intensively in the Rivière-George and Rivière-aux-Feuilles herds since 1978 while it was done sporadically in 1994 in the Beverly/Ahiak and Cape Bathurst herds, in 1997 and 1998 in the Bluenose East herd, and in 2000 in the Beverly/Ahiak herd. In addition, most herds were sampled intensively during the International Polar Year initiative (2007-2010), when the CircumArctic Rangifer Monitoring and Assessment Network (CARMA; www.caff.is/carma) (Russell et al. 2013) coordinated widespread sampling of migratory caribou and reindeer herds across the Arctic. Standardized sampling protocols were applied to establish baseline data on the diversity and abundance of pathogens and parasites (Kutz et al. 2013a). The following sampling periods were defined considering the ecology of caribou and the studied parasites: winter (December to mid-February), late winter/early spring (mid-February to April), spring migration/calving grounds (May to July), late summer (August and September), and fall migration (October and November) (Sharma et al. 2009). For H. tarandi and C. trompe (see below), we used only data collected in late winter because it is the only period of the year when larvae are clearly visible by gross examination (Nilssen and Haugerud 1994). For all other parasites, prevalence and intensity were established for all seasons when data were collected. Because different techniques to assess age were used for different herds, we used age classes as attributed in the field instead of exact age. Age criteria were as follows: calves (less than 12 months), yearlings (between 12 and 23 months) and adults (24 months and older). We used data collected from aerial surveys to divide herd sizes in five classes that could be compared across herds and accounted for both herd size and trend: low and increasing, high and increasing, around the peak, high and decreasing, and low and decreasing (Pachkowski et al. 2013).
17 2.2.1 Studied species
We studied seven of the main macroparasites of caribou: warble larvae (Hypoderma
tarandi), nose bot larvae (Cephenemyia trompe), liver cysts (Taenia hydatigena), giant
liver flukes (Fascioloides magna), hydatid cysts (Echinococcus granulosus), lungworms (Dictyocaulus eckerti), and muscle cysts (Taenia krabbei) (Table 2). The lungworms reported here have not been molecularly identified, but are likely D. eckerti based on the literature (Höglund et al. 2003; Kutz et al. 2012). By default, all cysts in caribou muscles have previously been described as T. krabbei, but Catalano et al. (2014) have recently underlined the potential for misidentification in previous studies because T. krabbei and
Taenia arctos are morphologically very similar, especially in their immature form
(Haukisalmi et al. 2011). Taenia arctos has been reported in muskoxen in Greenland and in other species in North America (Haukisalmi et al. 2011; Lavikainen et al. 2011; Raundrup et al. 2012; Catalano et al. 2014). The muscle cysts reported here have not been molecularly identified, but are likely T. krabbei (S. Kutz, unpubl. data). Data were collected only by scientists and trained personnel to limit biases associated with harvest by hunting. For
Echinococcus granulosus, total count of cysts was done on the whole surface of the lungs.
For Hypoderma tarandi, total count of larvae was done on the underside of the skin of the top and the sides of the back. For Cephenemyia trompe, total count of nose bot larvae was done in the whole pharynx once the head was removed. For Dictyocaulus eckerti, total count
of worms was done in the lungs after dissecting them along the bronchi and major bronchioles. For Fascioloides magna and Taenia hydatigena, total count of flukes and cysts was done in the liver after cutting it into 1 cm slices. For Taenia krabbei, total count of cysts was done in both the heart and the gastrocnemius muscle after making transverse cuts through them (Kutz et al. 2013a). Fascioloides magna is known to occur only in the Québec and Labrador herds (Choquette et al. 1971; Parker 1981; Huot and Beaulieu 1985) and therefore has not been actively sought during sampling of other herds. However, as sampling included manipulations of the liver to determine the prevalence and intensity of T.
hydatigena, if an individual not from Quebec or Labrador was infected with F. magna, it
would have been detected (B. Elkin, personal communication) given the size of this parasite (Pybus 2001).
18
2.2.2 Statistical analyses
We divided analyses in three parts: i) the calculation of the overall prevalence and intensity, ii) the assessment of the factors explaining the prevalence and intensity of the studied parasites, and iii) comparisons among herds. We used R software version 2.15.3 (R Development Core Team 2013) for all analyses and the level of statistical significance was set at α < 0.05. We first calculated the overall prevalence and intensity for each parasite (means±SE) with all the data combined. Then, we used generalized linear mixed models (GLMM) to model the effects of different factors on the prevalence and intensity of parasites. We used models with a binomial distribution for the prevalence and with a Poisson distribution for the intensity because intensity of parasites has an aggregated distribution and the Poisson distribution takes into account this nonparametric distribution. Hence, means used to assess the effects of different factors on the intensity of infection are averaged intensities adjusted for this distribution. We used sex, age class, herd size, and season as fixed effects and herd and year as random effects. Except for the intensity of H.
tarandi and the prevalence of F. magna, we could not include interactions in our models
because there was a quasi-complete separation of data points, indicating that an independent variable predicted a dependent variable almost perfectly in certain cases. We hence included interactions between sex and age class only in the models assessing the intensity of H. tarandi and the prevalence of F. magna. The package lme4 was used to estimate the parameters with the Laplace approximation (Bates et al. 2012). The package lsmeans was used to calculate the least-squared means and to make pairwise comparisons among the different groups of factors (e.g. among the three age classes) (Lenth 2013). P-values obtained with these a posteriori pairwise comparisons were adjusted using the Tukey method (Westfall and Young 1993). Finally, we compared herds in terms of prevalence and intensity of the studied parasites. Since there were gaps in the data, we used the results from the second part of the analyses to focus on certain groups of data. After determining which factor or combination of factors had a significant effect on the prevalence and the intensity of the studied parasites (e.g. we found an effect of sex on the prevalence), we focused the analyses on the data with sufficient sample size (e.g. we used only adults from the different studied herds to avoid a potential bias associated with age; Table 3). For all analyses, we used only groups of factors for which n≥10. Unequal sample
19 sizes were due to different sampling effort among herds, seasons, and years. Herds that had a prevalence of 0% or 100% were excluded from herd comparisons because pairwise comparisons could not be calculated when they were included. For the giant liver flukes, we had sufficient data only from the Rivière-George herd to test for the effects of sex, age class, season, and herd size on the prevalence and intensity of flukes. However, the overall prevalence and intensity were calculated with combined data from both the Rivière-aux-Feuilles and the Rivière-George herds. We also compared the overall prevalence and intensity of giant liver flukes between these two herds. There were not enough data to conduct statistical analyses on the effects of sex, age class, season, and herd size on the intensity of nose bots, hydatid cysts, lungworms, and muscle cysts, as well as to conduct herd comparisons.
20
Figure 1: Annual range of the twelve studied caribou herds (Rangifer tarandus) in North America and Greenland. Sources: 1, 2, 3, 4, 5, 6, 7 annual ranges provided by CARMA (Don Russel, pers. comm.); 9, 10 annual ranges based on telemetry locations (100% Minimum Convex Polygon); 8, 11, 12 annual ranges adapted from Hugo Ahlenius, UNEP/GRID-Arendal.
21 Table 1: Sample sizes for sex (1=females, 2=males), age class (1=calves, 2=yearlings, 3=adults), herd size (1=low and increasing, 2=high and increasing, 3=around the peak, 4=high and decreasing, 5=low and decreasing), and season (1=winter, 2=late winter/early spring, 3=spring migration/calving grounds, 4=late summer, 5=fall migration) to assess which factors affect the prevalence − the percentage of infected individuals in the host population − and the intensity − the average number of parasites per infected host − of seven of the main macroparasites of caribou (Rangifer tarandus). Data are from 2 or more herds for each parasite, except for
Fascioloides magna that come only from the Rivière-George herd. The symbol « - » means that no data were collected for this
category of sex, age class, herd size or season.
Total Sex Age class Herd size Season
1 2 1 2 3 1 2 3 4 5 1 2 3 4 5 Hypoderma tarandi Prevalence 650 528 122 63 72 515 156 176 25 225 68 - 650 - - - Intensity 632 516 116 63 71 498 153 173 25 218 63 - 632 - - - Cephenemyia trompe Prevalence 335 281 54 24 11 300 - 77 25 166 67 - 335 - - - Taenia hydatigena Prevalence 958 790 168 132 21 805 16 122 108 364 348 - 358 184 145 271 Intensity 171 141 30 - - 171 - 11 22 77 61 - 80 39 34 18 Fascioloides magna Prevalence 542 467 75 85 19 438 11 289 20 27 195 13 151 142 60 176 Intensity 189 189 - - - 189 - 16 20 24 129 - 38 65 25 61 Echinococcus granulosus Prevalence 1197 969 228 166 37 994 20 364 108 344 361 11 471 214 177 324 Dictyocaulus eckerti Prevalence 374 288 86 29 13 332 - 104 - 145 125 - 232 - 115 27 Taenia krabbei Prevalence 1181 927 254 163 59 959 - 294 108 425 354 11 477 198 181 314 21