ABSORPTION COEFICIENTS IN
LIGHT OIL SCRUBBERS.
by
Edward Colin Forbes
-University of Toronto B.A. 1936 University of Toronto M.A. 1937
John Yu Ling Kao
West China Union University B.S. 1930 Yenching University M.S. 1933
Submitted in Partial Fulfillment of the requirements for the degree of
Master of Science from the
Massachusetts Institute of Technology February 1941
Authors
Professor in charge of research
Chairman of the Departmental Committee on Graduate Students
head of the Department
420 Memorial Drive Cambridge, Mass. January 18, 1941
Professor G. W. Swett Secretary of the Faculty
Massachusetts Institute of Technology
Cambridge, Mass.
Dear Sir:
In partial fulfillment of the requirements of the
degree of Master of Science, we respectfully submit this
thesis entitled '' Absorption Coefficients in Light Oil
Scrubbers. ?
Yours very truly,
Edward C. Forbes
o/ hn Ytf L. Kao
ACKNOWLEGMJENT
The authors wish to express their thanks to
Professor G. A. Akin, Director of the Buffalo Station,
School of Chemical Engineering Practice, under whose
direction the thesis was done, for his many helpful
TABLE OF CONTENTS
I* SUMMARY 1
II. INTRODUCTION 4
III. REVIEW OF PREVIOUS WORK 14
IV. PROCEDURE 21
V. RESULTS 27
VI. DISCUSSION OF RESULTS 49
VII. CONCLUSIONS 61 VIII. RECOMMENDATIONS 62 IX. APPENDIX A. Expansion of Procedure 63 B. Summarized Data 73 C. Sample Calculations 86 D. Literature Citations 91
I-SUMMARY
To obtain absorption coefficients for the light oil scrubbers at the Bethlehem Steel Company, Lackawanna, New York, it is necessary to know the equilibrium
relation-ship of the vapor pressure of the various components of light oil over light oil-straw oil mixtures. The present investigators have determined the equilibrium pressures of benzene over benzene straw-oil mixtures at a tempera-ture of a ' . The first method employed, was the
analysis of the benzene-air mixture, existing in equilibrium over benzene-straw oil mixtures, by the methods of gas anal-ysis. In spite of numerous precautions, check results
were impossible to obtain by this method. The second method consisted in measuring the increase in vapor pressure when a bulb containing benzene was broken in, and mixed with, straw oil contained in a closed vessel. This vessel was connected with a water manometer in which the level could be adjusted so that the total gas volume of the vessel, holding the straw-oil, plus the attendant tubing, remains
constant. The vapor pressure of benzene was measured over a concentration range of 0 - 0.125 mol fraction of benzene
and within this range was found to bear a linear relation-ship in mol fraction of benzene in the liquid phase. At the temperature employed (c2Ca) and within the
above-mentioned concentration ranges the vapor pressures averaged
A number of runs were made on the plant light-oil
scrubbers to determine their absorption coefficients. One test, performed on the north-east rich tower, gave a value for Kga of 0.11
#
mols of benzene/hrgtcu.ft)(atm.) at anoil rate of 520 and a gas rate of 212
#/hr./sq.ft.
However, this result is not believed to be reliable due to the diffi-culty of determining small differences in the concentration of benzene in the outlet and inlet gas streams. A Kg a for toluene of 0.3#
mols toluene/pr.(cu.ft.fatm.) has been cal-culated from the same run but is thought to be more in-accurate than the value for benzene.Two runs have been made on the south-east lean tower and the values of Kg a obtained were 0.320 and 0.338
#
mols of benzene/(r.)&cu.ft.)atm.)at an oil rate of557
and an average gas rate of 210 (214; 206 respectively) #/hr/sq. ft.) These values are lower than reported by former in-vestigators (5)(12) but are so because, until now, Raoult's Law was presumed to hold and secondly the active surface ofthe wooden tower packing has decreased with time due to the deposition of foreign material. However, a recalculation of the values obtained by the present investigators
assum-ing Raoult's Law to hold, gives a reasonable check with the values obtained by a former group (12) on the rich tower.
In the fractionation of certain samples, difficulty was experienced in determining the amounts of toluene and
large "hold-up", of the present fractionating column and it was suggested that in the future a thinner or even shorter
f1
II INTRODUCTION
The abundance of natural coal deposits promotes every kind of industry for human welfare, either as a source of heat or power. Yet in certain instances, the human civi-lization depends not only upon the heat or power supplied by coal, but also upon the reducing characteristics of coke.
Historically, coke was manufactured by the beehive oven process, but as the demand of coke for metallurgical purposes increased as time went along, large scale produc-tion required a thoroughly scientific investigaproduc-tion of the entire coking process. It was found that, during coking with air excluded, the volatile matter in the coal was, more or less, pyrolyzed and gasified to form the oven gas, leaving the fixed carbon in the coke. For each ton of
coke produced, about thirteen thousand cubic feet of gas was evolved and since each cubic foot of this gas has a heating value of approximately 500 BTU., this gas could be
very well utilized as a valuable fuel. Evidently the re-jection of the exit gas in the beehive oven process encurred a great loss of potential energy and thus proved very un-economical.
Further investigation proved that coke oven gas con-tained many valuable constituents such as ammonia, phenol, naphthalene, benzene, toluene, xylene and tar. For indus-tries producing either gas or coke as their main product,
the recovery of the valuable by-products in the coke oven gas proved a very profitable practice, as all of these materials are employed in the chemical industries.
The eolution of the coking process from the un-economical beehive to the most modern by-product oven showed remarkable progress with respect to efficiencies of yield of coke from coal and also the large recovery of by-products.
Coke, with outstanding characteristics for metal-lurgical purposes, is very extensively used. For large scale production of iron and steel, the daily consumption of coke in the blast furnace and tremendous volumes of gas needed for steel manufacturing and treatment is great enonlgh to warrant that steel plants manufacture their own coke and coke-oven gas by establishing coking systems on location.
The Bethlehem Steel Company, Lackawanna, New York, maintains a daily production of four thousand tons of pig iron and consumes about six thousand tons of coke in blast furnace operation. Several million cubic feet of coke
oven gas are also used in the period of a day, for numerous purposes throughout the plant. These large demands of
coke and coke oven gas are supplied by the coke ovens
located in the same plant.
For the coking of coal, there are four batteries of by-product ovens each of which has a capacity of twelve tons of coal. Three of these, consisting of fifty-seven oven per battery, are of the Koppers type and are heated by
6
FIGURE I
LIGHT OIL ABSORPTION SYSTEM
LEAN GAS . DENUDED OIL
RICH GAS
FROM COKE OVEN
RICH OIL
TO BENZOL RECOVERY
-- FLOW OF GAS
7
producers gas which is produced from the coke produced in these ovens. The other battery, consisting of sixty ovens, is of Semet-Solvay type and is heated by coke oven gas generated in the latter ovens.
After the introduction of coal, the red hot oven is sealed and the coal is then heated for approximately nine hours after which it is discharged. The gas emitted from the top of the oven during the coking process is led through a hydraulic main where most of the tar is preci-pitated, and a major part of the ammonia is dissolved. The gas from the hydraulic main is then washed countercurrently with water in a tower, for further removal of tar and ammonia. The washings from the tower and the liquids from the hydraulic main are mixed in settling tanks where tar separates from
the liquor. After settling, part of the clear liquid is recirculated to the hydraulic main, the remainder is passed
through a trombone cooler and then conducted to the ammonia distillation tower, and the phenol recovery column. Ammonia from the distillation tower and coke oven gas which still
contains small amount of ammonia are both passed through sulphuric acid saturators. The ammonia reacts almost
quantitatively with the acid to form ammonium sulphate, the resulting crystals settle in tanks, are then passed through centrifuges and finally dried in a rotary drier. Daily pro-duction of ammonium sulphate amounts to fifty-five tons.
The coke-oven gas, now freed from ammonia, phenol, and most of the tar, passes countercurrently through a water
£9
OIL INLET
OIL OUTLET-
---FIGURE II
LIGHT OIL SCRUBBING TOWER
8' 8'
I
mm
GAS OUTLET - GAS INLET Packed height 80.5'spray tower in which most of the naphthalene is separated out and flows with water into a settling tank where it is
skimmed off as crude product.
The gas from the spray tower flows to the light oil recovery system. This system consists of two sets of scrubbers arranged in parallel. Each set has two scrubbers in series, one for rich oil, and the other for lean oil. Each scrubber,15.5 feet in diameter and 123 feet in height, with a packed volume of 15,000 cubic feet, is packed with wood slats of 1/4" x
5-3/4"
set on edge,separated by 1/2" spacers (Figure II).
Gas, from the main, divides into two streams and flows (Figure I) from the bottom to the top of the two parallelly arranged rich scrubbers, while the partially
benzolized straw oil which has been mixed after coming from the lean towers, is pumped to the top of the rich scrubbers. The gas from the top of the rich scrubbers, and still containing an appreciable amount of light oil, is further scrubbed countercurrently with stripped straw-oil in the lean scrubbers.
After passing through the scrubbers, the coke oven gas flows to a booster house from where it is distributed to various locations in the steel and coke plant.
The straw oil from the bottom of the rich scrubbers, is stripped with steam and the vapor mixture passes through a fractionating column in which benzene, toluene and xylene, and steam are separated from each other. The denuded
straw-/0
oil is cooled in trombone coolers and then recirculated to the lean scrubbers.
The daily production is approximately 11,500
gallons of benzene, 3300 gallons of toluene, and 855
gal-lone of xylene.
Since the production of light oil in the opera-tion of the by-product coke oven plant isAa large scale
and the knowledge of capacity coefficients in the light
oil scrubbers is valuable for design and operating
pur-poses, the object of this investigation was to study the operating conditions of the scrubbers and to determine
the absorption coefficients.
In order to determine the coefficient of absorp-tion accurately it is proposed to determine rate of oil
flow and to analyze the concentration of light oil in the inlet and outlet of both oil and gas streams by the most
accurate methods at hand. With the necessary data on
temperature of both streams and pressure of the gas stream and a laboratory determination of the equilibrium of light oil in straw oil it is possible to calculate the coeffi-cients of absorption.
It is not the intention of the authors to go
extensively into the theory of absorption since there
are many excellent textbooks on this subject,(6(8) (11)
but a short explanation of the use of the term, absorption
/1
In the transfer of material between a gaseous
and a liquid phase, it is found that the following equation
represents the conditions during diffusion.
N a = mols per unit time per unit area= k (pg pi)
=
kl(C
-C
1)
where kg = gas film coefficient k, = liquid film coefficient
pg = partial pressure of the solute in the main gas phase
pi = partial pressure of the solute at the interface between gas and liquid
C1 = concentration of the solute in the main body of the liquid
Ci = concentration of the solute in the liquid
phase at the interface
Furthermore it is known that kg is a function of temperature,
total pressure, mean pressure of inert, as well as the
various factors which determine the value of the diffusivity, and of the effective gas film thickness. Similarily, k,
is a function of solute concentration, diffusivity in the
liquid and the effective liquid film thickness.
It is, naturally, very difficult to measure
interface conditions but it is found, in the case of very
soluble gases, that pi is very nearly equal to pe, the equilibrium value corresponding to C . Likewise in the
case of relatively insoluble gases Ci equals Ce, the equilibrium value corresponding to pg. In both these cases, the film coefficients are now overall in character
and can be written as K and . For intermediate cases,
the resistance of each film must be considered. However, it is convenient to employ a single overall coefficient instead of the two film coefficients kg and ki and we have our choice of two overall coefficients as defined by
the equation
Na g Pe) Kl( Ce - Cl)
Kg is the overall coefficient in terms of pressures, K
the overall in terms of concentrations. One% important consideration should be noted, and it is, that ( pg -pC
)
remains proportional to (Ce - C1 ) over the employed range of pressures and concentrations in order that Kg and K1 will remain constant. In other words, Henry's law
(
C = Hp ) should apply to the system.We have now defined an overall coefficient Kg to be the rate of interphase diffusion as mols per unit time per unit area per unit of driving force in terms of pressure. However, in the case of packed towers the
interfacial area is practically impossible to measure, consequently, we introduce a new variable, a, defined as
the interfacial area per unit of volume. Because both
a and Kg depend to a very large extent on the nature of the packing, they are combined as a product which is then
employed as an overall capacity coeffiicient on a volume basis. In the present investigation , the units employed
for Kg a are pound mols per hour per cubic foot per
atm-osphere. The values for Kga were calculated knowing the
period of time ( total transfer obtained from a material balance), the packed volume of the tower, and the use of the proper driving force for diffusion ( in this case,
the logarithmic mean of the overall driving forces in terms
gREVIEW OF PREVIOUS WORK
A number of investigations on the operating
condi-tions, of the old light-oil scrubbing tower from 1922 until
1930 and the new towers after 1930, have been made at the
Buffalo Station, School of Chemical Engineering Practice.
Generally, a material balance around a light oil scrubbing tower was obtained by measuring the oil rate, and analyzing the light oil concentrations in the inlet gas stream, and the inlet and outlet oil streams.
The methods employed were as
follows:-1. Measurement of oil rate.
By closing the outlet valve at the bottom of
the scrubber and measuring with a stopwatch, the time re-quired for the oil to rise a definite height, the oil rate can be calculated by knowing the inside diameter of the scrubber.
2. Measurement of gas rate.
a. In the early tests the gas rate was not measured but was obtained from plant data,
b. In later tests the gas rate was obtained by two methods:
(1) By a pitot tube traverse
(2) By calculations on the operation
3. Determination of light-oil concentration in the gas.
For the determination of the concentration
of light oil it was necessary to first, remove light oil
from the gas; second, to record the volume of light oil
free gas; third, to strip off light oil from the absorbing reagent, and finally, to fractionally distill the light oil
into its components.
To perform these operations the following methods were used.
a. To remove light oil from gas.
1. By means of activated charcoal.)(fof The dried gas was passed through a column packed with activated charcoal which acted as an
absorbing reagent for the light oil. It was claimed that
by using activated charcoal for gas, rich in light oil,
very inconsistent results were secured.
2. By absorption of light oil in ether.
The dried gas was bubbled through ether in a bottle which was immersed in some kind of freezing agent
0
to keep the temperature at -5 C. The gas from the bottle
was led through a condenser coil cooled with a dry-ice gasoline mixture to a temperature not higher than -60 CO.
temperature. By keeping the temperature low, not only
the light oil was completely removed from the coke-oven gas but the loss of ether was negligibly small. It was claimed that this method was very satisfactory for the tests. The volume of coke-oven gas was measured by a wet gas meter in series with the absorber equipment.
b. Stripping of light oil from activated
charcoal.(3(f'o
The light oil absorbed by the activated charcoal was stripped by means of steam. The mixture of light oil vapor and steam was condensed and water separated. The light oil portion was then distilled in a fractionating volumn and the constituents were collected at their
respec-tive boiling temperatures.
c. Distillation of light oil.
When ether was used as the absorption re-agent there was no necessity of stripping as in the case of
the activated charcoal. The ether solution was run directly into a flask and fractionally distilled.
4. Determination of the concentration of light oil in the oil streams.
a. Sampling of oil in both streams.
Equal amounts of oil were taken from time to time during the run and mixed to obtain a composite sample.
b. Stripping of light oil from the benzol-ized straw oil.
In the early tests, an oil sample of defin-ite volume was stripped in a flask by means of steam which was generated in another flask. The oil was first warmed and
then steam was passed into the flask. During distillation the oil was heated with an open flame to prevent any con-densation bf vapor before it reached the condenser.
It was claimed in later tests that by us-ing steam under 5-10 lb. gauge pressure for both heatus-ing in closed coils, and stripping as live steama quicker and much more complete stripping could be expected.
c. Fractional distillation of light oil.
After the vapor was condensed and water was separated the light oil portion was fractionally distilled as mentioned above.
5.
Determination of equilibrium of light oil betweenthe vapor and liquid phases.
For the calculation of absorption coefficients in previous tests, it was assumed that Raoult's Law held for cases of gas and liquid phases in equilibrium. Since this assumption was doubtful, several experimental methods were employed to determine the vapor pressures of benzene in
a. Davis method.
Two flasks were connected to a manometer and freshly stripped oil was introduced into one of the flasks. Into the flask containing oil, a sealed glass bulb containing a definite weight of benzene was placed. Both flasks were opened to the air so that the manometer levels were the same and then the stoppers were closed. After the bulb was broken by some mechanical means, the
vapor pressure of benzene was indicated by the difference of height in the manometer.
b. The combustion method. (lof[/
Vapor of a definite volume and containing
benzene in equilibrium with liquid was dried by passing through calcium chloride tubes and then mixed with dry oxy-gen. The mixture was then burned in a combustion tube. The products of combustion were then collected and weighed
in suitable absorption towers as used in quantitative analysis.
c. Gas analysis method. (<2)
A certain volume of oxygen was measured in
the burette and stored in the caustic pipette. A certa .n volume of vapor in equilibrium with liquid was next measured in the burette. The vapor and oxygen were mixed and burned in the combustion pipette. Carbon dioxide was absorbed by caustic. Gas free/ from carbon dioxidewas again measured
in the burette. The concentration of benzene in the vapor was calculated from the volume of contraction.
jZ PROCEDURE
To obtain equilibrium data for benzene vapor press-ure over benzene-straw oil mixtpress-ures, several procedpress-ures were followed. The first method tried, was to analyse samples
of the gas in equilibrium with mixtures of benzene and straw oil. This was accomplished by the use of a measuring
burette, a caustic absorption pipette, and a slow combus-tion pipette. In all cases the gas volumes were net
neasur-ed volumetrically, butt gza iciYAIn -r1-I 4 ~~ Im1a4=C:
tO hofi2n g__ d which was either water or mercury. A
measured volume of air was first taken into the burette and then passed into the slow combustion pipette. A sample of the equilibrium gas-mixture was next measured into the burette and a slow combustion performed. The products of combustion were then absorbed in the caustic pipette and the total contraction determined.
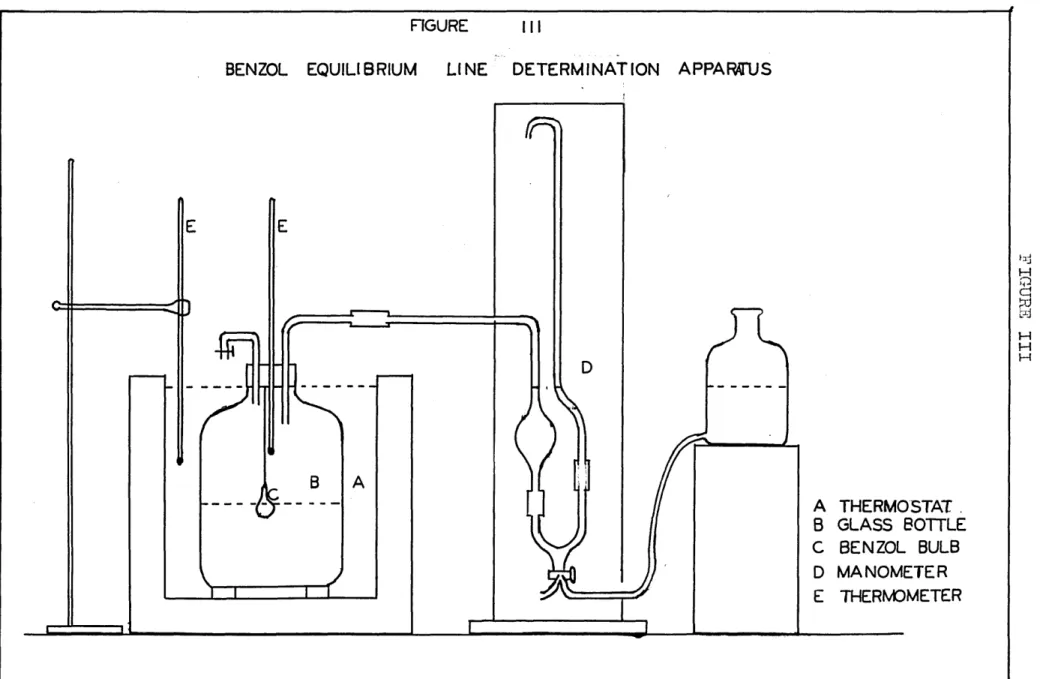
The second method employed to obtain equilibrium data was as follows. A glass bottle resting in a constant
temperature bath was partially filled with a known amount of straw oil. Into the flask was placed a sealed glass bulb containing a known amount of benzene. The system was
closed completely by a shellacked rubber cork containing a glass tube Leading to a water-filled manometer., The glass bulb was then broken, the bottle and its contents shaken, and the increase in vapor pressure noted on the manometer. The latter instrument was fitted with a leveling
FIGURE III
BENZOL EQUILIBRIUM LINE DETERMINATION APPARTUS
THERMOSTAT. GLASS BOTTLE BENZOL BULB MANOMETER THERMOMETER ~aj L~J H H H 'N FIGURE III
bottle so that the level of the liquid, in the manometer le4 connected to the flask, was always at the same height.
By this means the volume of the bottle plus the connected
tubing, remained constant. By changing the amounts of
benzene used, a nuiber of runs were made at various
ben-zene concentrations.
To obtain absorption coefficients for the
opera-tion of the plant scrubbers, the following procedure was
followed. An absorption train as shown in Figure V was fitted to the sampling pipe on the downtake from the tower being investigated. A similar train was also fitted
to the downtake from the preceding tower in the series. In this manner samples could be obtained of the entering
and leaving gas streams from the tower. Gas from the tower was then allowed to flow through each train at the rate of approximately 20 cu.ft. per hour and sampling was
continued until approximately 200 cu.ft. of gas had passed,
the exact amount being read from the wet gas meter. During
this period,grab samples of oil were taken separately from the entering and leaving streams. These were then mixed
together to give two composite samples. At frequent inter-vals, the valve on the exit oil line from the scrubber was
closed and the time required for the oil in the sight glass, to rise a given height was noted. Temperatures of the oil streams were also obtained from time to time by the use of thermometers and the gas stream temperatures were read from
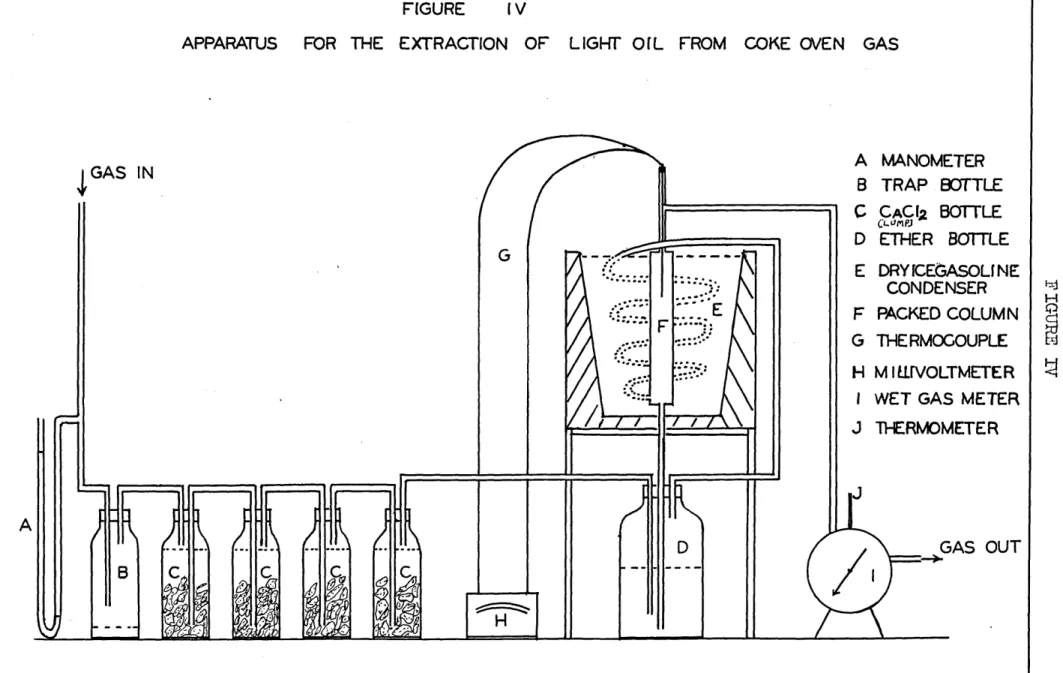
FIGURE IV
APPARATUS FOR THE EXTRACTION OF LIGHT OIL FROM COKE OVEN GAS
MANOMETER TRAP BOTTLE CACI2 BOTTLE CLIJmpJ ETHER BOTTLE DRYICEGASOLINE CONDENSER PACKED COLUMN THERMOCOUPLE M ILVOLTMETER
WET GAS METER
THERMOMETER
GAS OUT
H
(~J A
plant installations. At the termination of the run,
the bottle containing the light oil and ether was
discon-nected, metallic sodium was added to the contents and, after remaining several hours, the contents were fraction-ated in an apparatus as shown in Figure
V
. The straw oil samples were stripped in an apparatus shown inFigure Z . The water and light oil mixture, obtained from the stripping operation, was then placed in a separ-atory funnel, the light oil being run into a bottle where
it was dried with calcium chloride. The light oil was
then fractionated in a column as shown in Figure . The actual details of procedure and the precautions which
had to be observed, may be found in the Appendix under "Details of Procedure".
From the above measurements, it was possible to calcul-ate the concentration of light oil in the inlet and out-let gas and oil streams; and also the oil rate in the
plant tower. It was then possible to calculate the
mols of benzene absorbed in the tower for a given period of time. Since we also knew the packed volume of the
tower as well as the vapor-liquid equilibria, Kga
could be calculated. From the preceding data, a
mater-ial balance -aroudnid the tower would yield the gas rate, a knowledge of which would serve as a check on the results because it was known that the gas rate was
All data was reported on a pound mol basis and
it was not necessary to know the average molecular weight of the coke oven gas although .this latter
f igure was found tola2.5 from analysis and plant
records. From the data of previous zinvestigatore,(d~ ) it was considered that the absorption of light oil in the apparatus shown in Fig.IV was quantitative.
FIGURE V
STEAM DISTILLATION APPARATUS
DISTILLING CAN PACKED COLUMN CONDENSER D RECEIVER E ICE COOLER F TWERMOMETER-G LIVE. STEAM H HEATING COIL
IJ OIL INLET AND DRAINAGE
Hx
A B C
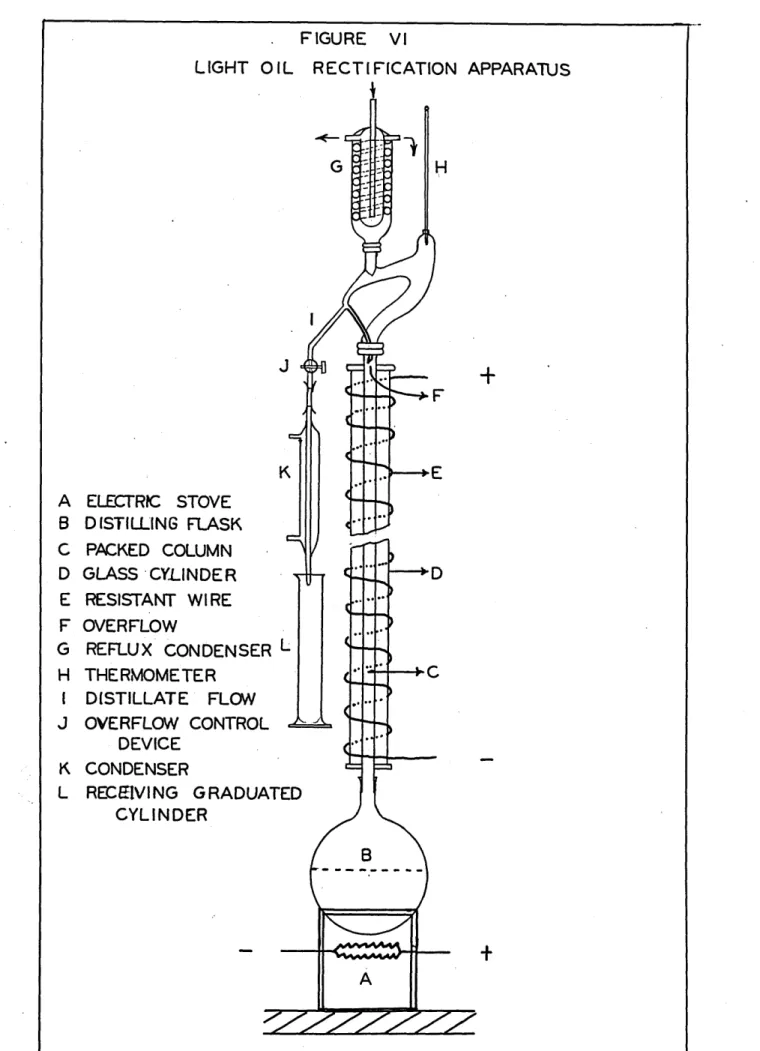
FIGURE VI
LIGHT OIL RECTIFICATION APPARATUS
G H J ELECTRIC STOVE D ISTILLING FLASK PACKED COLUMN GLASS CYLINDER RESISTANT WIRE OVERFLOW REFLUX CONDENSER L THERMOMETER DISTILLATE FLOW OVERFLOW CONTROL DEVICE CONDENSER RECEIVING GRADUATED CYLINDER
+
F A B C. D E F G H J K L E 0D C+
I1. The method of obtaining vapor pressure equili-brium data of benzene and straw oil mixtures by the use of gas analysis has proven unsatisfactory.
2. Vapor pressure equilibrium data obtained by the method of breaking a glass bulb, containing benzene, in a constant volume vessel, containing straw oil, and noting the increase in vapor pressure, is believed to be satis-factory. Data obtained by this method show that the vapor pressure of benzene over benzene-straw oil mixtures
averages
SO.5
per cent of that calculated from Raoult sLaw at a
temperature
of .25 *( 6^r"/"" * "'1;. 7 '14r If/ C_ 'Ile% .1 &I / e ei' ?4' (a% e /51Ci ,.-ttJ / If fe~
3.
Tfhe Kga for benzene calculated from a run on the north-east rich tower was found to be 0.11#
mols of benzene per hour per cu.ft. per atmosphere at a gas rate of 212 and a liquor rate of 520 lbs. per hr. per sq. ft. Due to inaccuracy in the analyses of gas samples, this result is not believed to be reliable.4.
The absorption coefficients resulting from two runs on the south-east lean towers were 0.320 and 0.338#
mols of benzene per hour per cubic foot per atmosphere at an oil rate of 520 lbs. per hour per square foot and an average gas rate of 212 lb. per hour per square foot. These two results are believed to be reliable.
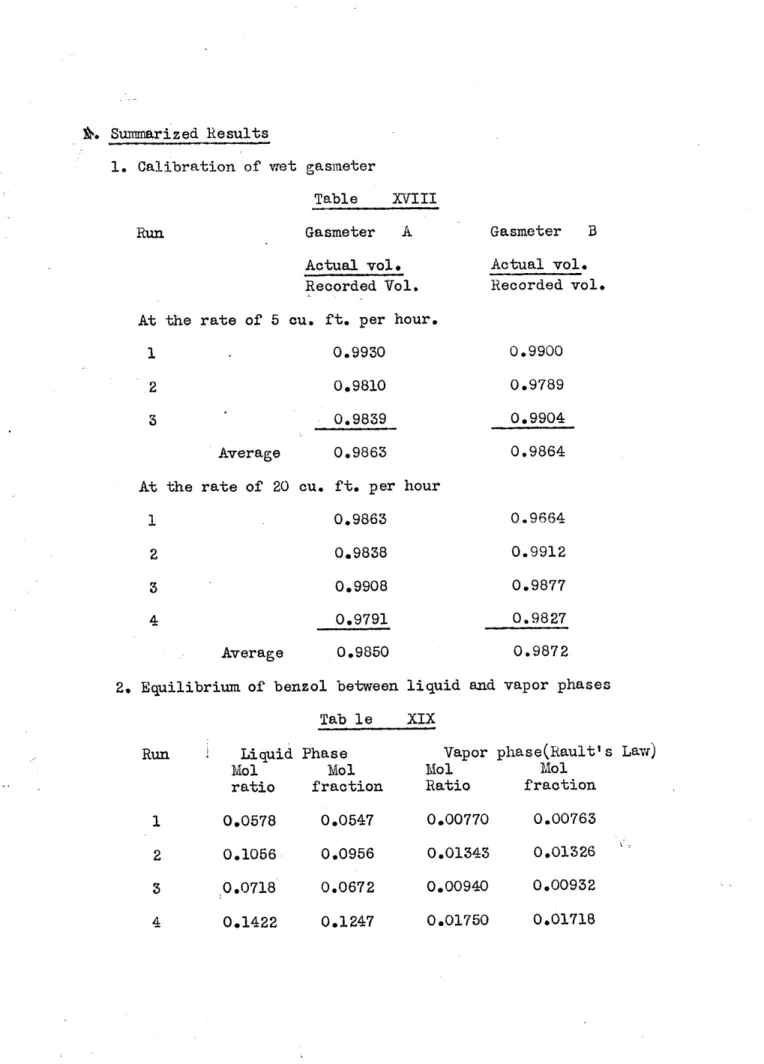
. Summarized Results
1. Calibration of wet gasmeter
Table XVIII
Run Gasmeter A Gasmeter B
Actual vol. Actual vol. Recorded Vol. Recorded vol. At the rate of 5 cu. ft. per hour.
1 0.9930 0.9900
2 0.9810 0.9789
3 0.9839 0.9904
Average 0.9863 0.9864
At the rate of 20 cu. ft. per hour
1 0.9863 0.9664
2 0.9838 0.9912
3 0.9908 0.9877
4 0.9791 0.9827
Average 0.9850 0.9872
2. Equilibrium of benzol between liquid and vapor phases Tab le XIX
Run Liquid Phase Vapor phase(Rault's Law)
Mol Mol Mol Mol
ratio fraction Ratio fraction
1 0.0578 0.0547 0.00770 0.00763
2 0.1056 0.0956 0.01343 0.01326 3 0.0718 0.0672 0.00940 0.00932
Table XIX -- continued Vapor phase(experimental) Mol Ratio 0.00662 0.01088 0.00729 0.01500 Mol fraction 0.00598 0.01075 0.00723 0.01475 Experimental Rault's Law
From mol From mol
ratio fraction 78.2
81.0 77;7 85.7 3. Specific gravity of straw oil
Table XX
True vol. of Weight of pipette c.c. gn Stripped Oil Inlet Oil Outlet Oil 25.13 25.13 25.13 oil 22.03 22.083 22.1027 . Summar ize-dAata. for PlantRuns.
Table XXI
I II,
Mol fraction of benzol in inlet rich gas Mol ratio of benzol in
inlet gas
Mol fraction of toluol in inlet gas
Mol ratio of toluol in inlet gas
Mol fraction of benzol in outlet gas
iMol ra .tio of benzol in outletalean gas
Mol fraction of tolu6l in outlet gas 0.00927 0.00939 0.00700 0.00703 0.00585 0.005875 0.001253 0.000056 0.0000541 0.001268 0.0000594 .0.00756 0.00757 0.00303 0.00304 0.000918 0.0000845 0.0000544 0.002306 0.0U2310 0.0000398 Run 1 2 3 4 78.4 81.2 77.7 86.0 Oil Specific gravity 0.877 0.878 0.880 Run III
30
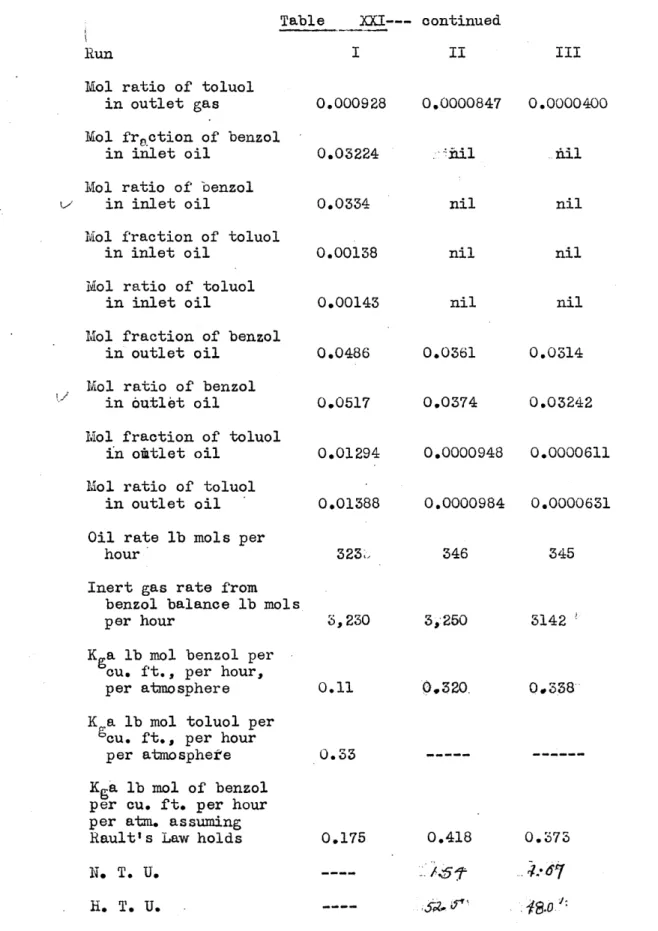
Table XXI--- continued
Run I II III
Mol ratio of toluol
in outlet gas 0.000928 0.0000847 0.0000400 Mol fraction of benzol
in inlet oil 0.03224 Ail
nil
Mol ratio of benzol
in inlet oil 0.0334 nil nil
Mol fraction of toluol
in inlet oil 0.00138 nil nil
Mol ratio of toluol
in inlet oil 0.00143 nil nil
Mol fraction of benzol
in outlet oil 0.0486 0.0361 0.0314 Mol ratio of benzol
in autlet oil 0.0517 0.0374 0.03242
Mol fraction of toluol
in ottlet oil 0.01294 0.0000948 0.0000611
Mol ratio of toluol
in outlet oil 0.01388 0.0000984 0.0000631
Oil rate lb mols per
hour 323'. 346 345
Inert gas rate from
benzol balance lb mols
per hour 3,230 3,250 3142
K a lb mol benzol per cu. ft., per hour,
per atmosphere 0.11 0.320. 0,338
K a lb mol toluol per
cu. ft., per hour
per atmosphefe 0.33
---K a lb mol of benzol
per cu. ft. per hour
per atm. assuming
Rault's Law holds 0.175 0.418 0.373
3/
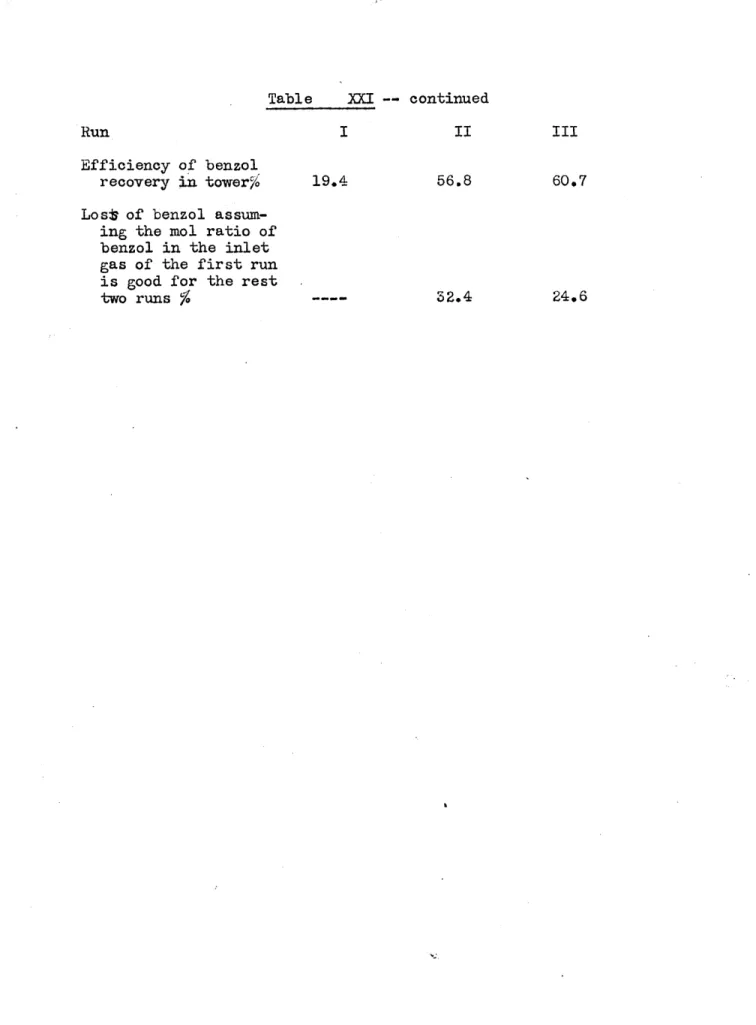
Table XXI -- continued
Run I II III
Efficiency of benzol
recovery in tower% 19.4 56.8 60.7
Lost of benzol assum-ing the mol ratio of benzol in the inlet gas of the first run is good for the rest
F IGURE VII t #4 4+ +4 H-+*--+H+*++ -41 TT -1 -. .I -t $ H+ $ j-* HE 4~ t -1-H+ 1 --- E t + ft 44 1 1+ 1 L. + # J. Ut) 00 cr N0 0 I- -J 0 N
z
m O 0 -j +- -! 1 1 1 i 4-4444-+4444 T+ as +m +H+ ++++HH+ INFIGURE VIII
-EQUILIBRIUM OF BENZOL BETWEEN VAPOR AND LIQUID PHASES ON MOL RATIO BASIS
H-FH4+h-111111111 I I II I 4-l-4-4-4-4-4-4--4-4--I-l--I-I--I---I-4-±-4--444--I--I-4-44-~tfth4ftt JrIA .m4" I~~~
H
T~ 4tt4
--- TTd 4ti K 2
yt t ~ 4$+
lis4
It 444 $Tr I
1
+ 4
1
4 i i-t-
-4I-t-#-L-T
tt-4+
AD-V -r 444 4UtTI -i- 44- s 1-- -
--
--
-.7..h..2
W--
02 4 8 10 12 14 16 18 2MOLRAIOOFBEZOTOSTAW ILINLIUI PAS X10
53 44 __4 rn z 0 r-0 UG) LA 0 1tj±_ LFIT
-1
FR I .4 .i- . FFH'4I
V 4 IV W - 4 4-Mjt-FIGURE IX
EQUILIBRIUM OF BEfNZOL BETWEEN VAPOR AND LIQUID PHASES ON MOL PERCENT BASIS
ili_ i~til-4r4114±ddB'47 fUTliIIik- -H++4M-4-HtP4-1-fT4t I I 4. I , i
-14tAt",EiE
WI
1T mTa 44 qIj-
4-tii
T
----
----
+-
-I T.44-H t-1 41 417
444
-- --- ----tit
-t
1~ ~ 4 SLA.4-#AIT 144T J- 454 TAL -4 4----_ 1 4 4ii
d-
I
44
471444+
T TITf
fTw
~f4ttV
41 ___ __ - ~HH~hN44~142 tjlA±Jt4 444'A-jtII
144-4-1 414n jtt ; 1-4 3-i ;+ F4+++J 1+41 j _viffi 40 fl * #t# it-444 14 H_ rnn
0 r-0 o 2 4 6 8 10 [2 14 16 18MOL PERCENT OF BENZOL IN LIQUID PHASE
i i i it
--M
1mT
N
Hz
R dil f 144 I I-P4b Qp T T _ t t--I I-4 4- f r -4 t C G 91 44 -F F fa 4*tt 4 A4r ti Tr"_ F --- .E..n..I
TEMPERATU8.E INCENTIGRADE P o> -4 O> c0 0 0 C 0 0 0 C0 W 0 (A) .. U 0 0 0 K Kt
<V
L -Vi Kitill I L bj:Li ,tI u 4 4 -4' t4 ii -,I
I ii diie
+
ti-Al t f -- -4 4- trA J- -Tf $ T,- tj t tj-] t t I -i t 4 t tp -1 t !JL H+TT ' 4 4C + t -4 z{ u t I 4 t r -4 J 7 4 Ri t A 1 4- 1-LJ ItF I T ij 44- +4 A fI-a): 4- 4 "JA f4_LL T 44 L- 4 11 e p 1 -r7t 'T :
-G
~4 4- Tt 44 -1 -1 J 4~ 2 i 4 '4-A 4 4 _LI i' 4111 1 T~' 40ra -ma im L~mi L;'UmKm+ mme~+s+s *+9I ~ II t 1] H'lU 1- 44 -~ -~ 1c 0.i'7z zjzIT t _" 1---- ~htiL __ T_ -. 04 44 4___ <jt4'A - i.__f-'44 14 '- A hi'- -t14 + 5 -. 4~~~~ -1 __ TIL '4 --Ot4I-,+ 414 1 , 4 4 H-! ' + -LmL LLL I LLL 0 r c K O 0 -4 Fz
0 c 6w 5rF IGTURE X I ,$ F bt ttt : 4-4 ~. ... u+ If 10) flj -t- Tft 4--- ---2 -1-1It -t M-A ~ ~ I t .
-56 FIGURE XIII f4 4 ### -H4-i t 4 --tt J--- --- -C -4 -_ 4 -T - --+
4
rr i Ip 1 -, ~-j C --t -3T$_4
T1
-f-i- 4 -14-3i
I- ___ti FIG____ ET1X-
-
*Ttp I ra _ + 4 1+
b
T-1 -4-< . .t
H
E
i2 1
-1h 41- 47 * TL 2 A r" * *-4t _-- f
VFNGRG
rr
s
pE +~ JT rr rO -- N 14-1To 'TW
42w,
P~ ~tAJ --t--- I -I - - t- -i - - - fl 1144 12 t i4' I+ I , ~ i 'md4tt 4 11 aI - 4, T 4 -I + 4t 2t II ~ ~~ 4 7 -4 +11 -. I4 -4 ill Ii4
.I'11
-T '1 446 4 q 1jt A 1 $$ It% tT4 lilt1t U- T' T4 4 A 1-p0 + +a -T--;ii pIT ' 1 1 --. -
1
+- t _t I :r ji 'I T44>-1-;
III t' 44Hi 7 __lt T<i 4!11
4
_ 1~~~-I1. 1_ {{ -m 11-4 1 V 24 4 14 1 l-jI ', i -" '-- 4,H.441 -T1< $ J:y J-'4
. 21 4 f8,1
2214 i 7 - D A N' I EN M-:4-
-~40
4+t-4 1 4' 147 <Wl 14p+21 ni j-'Uu4- C TIEER44 ~F IGTPT XV -i-l-1Th-t-FtFH Ift 1-H
II
I I I I I I T j T I I f f + Ht-*1 -I -I--- -. --nI-i-W
4-H~Nffi-Fflj41
.fl ttittI4~
Q4j 77 hiftf~fl~~ LO L 4 I -I--J-tt
. 4lh ' O-- ' + -M --.-i--1 t 1 _ Ht
~ytfo
1 44~ 4--11 --I d- 4 I-t441 ~ ~ ~ ~ ~ 1 -4I 1t- itHd-iiI +II
I I . 1 1 , , 1 -+ IIIIIIII IIITIiT[iiI!I]'iIII 11 Ill 1 [11 11 1[] 1.1 Ili, r-t.f t
T-"tt
ijl
4+4-dr
I
LIL-1475
it-ir' f f+++ H H i-H444 1+ 4A # 4-4#1
4-iliIIIIIiIIIIIIJ IIIIIIIIItIIIIIIIIIIIIIIiiIIII iIIIII111TIlTill1-I, F IGURE XVI ; - 7-4x -4 --- -+3
-.-
-4.1
1*
4
t t4- t~jIJ T . T Lt TJ1H44
... .t4 . -... 1: T F -II 41x 't -e .t 4 c r $ * $ $ e $FIGURE XVII
'F
77)~
!~(
I
~~17
T-,Z ?h#L
- 4 r--'4 LLi-~ CVF-+ T-9%44:4 Ta +F Thf~ii~iHTh~tVHVi--+44 i4+1. 4-T~4 -4-4-+ NGUR R-A4IAA4XV1I '4 1N4-R I t-OL Illt ii1I J H' -T r-2z2Tt~41~ - r' 4+4~7
--- "4-4-t, J ij- --4 ~4 1t~t4i4z~ -F--- + #T 1! 41 f+±t±HFj-H~4 4-'i ~44-
2-4044 OiO~VriOVO~IO±t#
- B &CE TMEE -4--4-4~~ -F-F-F-'-H±H-lc ----4 F~ I(GT+-G9[L'-SAML ~rJ H 4) H H -~ 4-- I-' -i N~. (A~ - rir~rI 44- +rl H4--H4+ H 1 1;! 1 1 1-44--I Hiti; Tt t-r 1-mt -T 0-~HH F ICGURE IX I-1-41Th7441 VT4 'I' 4-±
-4-U....
-t, -14-A- i -- 14 -4 1 -t- -- T + 4i4~A -z -4 4-11 X ITt [r ( ( ( t-41 _0 T43-( 1$ T
A
t-LO -~oT
rW_
Wo, flot~ -4 -T 0 IV if- 0 I I TTT I 1 1 1 -HE _41H 4_ _ R" mfi, it
Ill
4 I i I 44-HA+H44+4 H4t-H++t+ t-H +4-+ F IGURE XX 4-+ ++ +4 tn 444+-444-4 4--Ff4 44 1
w
T --- , u ---- -- ---- --0 ---0-- 7~ ~~~4iW 1 $ 4 $p$p 4 I i I i I- r -l 1 1 t l 1 1 1 1 11 1 1 1 I !i il if 1 1 1 1 ~ ~ l t l ! 1 i ! H l i i -i --±±H -±tE --7 ITI T-T= = -= LEE-' +f+ 44-4-. lillilliIiiii -L-.Fp
4+4++44+H+ F-FTA +f f + -H H -HT I I I H ill I I I I I I I I 1 1 1 1 1 1 1 1 1 1 i 1 1 1 1 1 1 IT i i I
I
H
' ' I
r l i
l
i
H
1 1 1 1
Hill
11
ill
i
I
I T I j 1 I l L I I I I I I 1 111 1 1 1 1 1 1 1 1 1 1 1 1 1 I I I I I Z I I I I I I I Mill HIM I I I I I I I I H ill W ill I I I I iJ i i I I 1 1 101"11 c I HlH Will 11 1 11 m i i T T I I I T I 11:1 Joor 1 1 i H ill I I i i i I I I i I I :V I i I HIM . 111 i I I I 1 1 1 1 :Z :, i I H H H IM I I i I I I I I I 1 1 i 1 H I 1 1 1 T W ill! I I I i I I H 11 1 1 1 1 N i I I OF P 1i 1 H ill ill!ii k if oeeo" I 111W 111111 11 1 1 if I I I if Ill] H IM I I I I I Ill I I I i I I H ill I I E l I i I I I I I I I i I I I I I I Ill I H ill I I I 1 11 1 11 1 11 1 if 1 1 1 1 1 T H ill I I I I I I I I I I i I II I I I I I I I I I I 101T I I I I 11111H I; I i I I I I I I I 1 1 11 11111 1 1 1 1111 111 1 1 1 ill W ill 1 111111 1 1 1 1 IJ I OT I I I I I I II H ill! 1 1111 I l l I I H I! !1; 1 111111 M IM I 11 Ili] I I Ill I I 111 H IM 1 111111 Ill 'A T 11. 11 1 Ili W ill I H ill i l l Ill I I I I If f 11 HIM I Hill 1 1 1 1 h I I I IIIIIIII I I I I I LJ O ' Ill I I I If '001 1 1 1 11 11 H W ! i M ill iW il 1: i 11 M ill Ill ILK 1 1 1 1 Ill 11 IN lilifflilli 1 1 1 1 if on I I 1 11 1 QLL I I I i L LL. i I T TF If 71 ij -1) 11 0 E-4 0 m m t 11 m -0 0 N (D to I m IN -0 m rl- (D LO-7- -T- 4 -' T .,--- -1 --..--- -+1i1 t1 4-4-L 4-.14 1 1 1 L TTT-* T+ -I.._ __--ITT --~ ~~~~~~~ LL L4- ' '- -4 -4 4 4 4 i 0 O) CC r- 0i In 'I m ky -~~~ 14-- -4 44 -~+4'+4-T--i t+-4 I4 I-~~-- I -'4~~4~4+*~~-4i~44-4- ~ 44- ----4 -~4 4-~ ~~~~~~~~~~~~~~~~~ 14 H--14-4 ----'f± -''- ~ ' ~ -4 -~ i-+ +p--r 4i 4i ~ -4''-~~ -4 '--+ -. 4* --**-- p-*.--44-+4 T +--- 4 444- +--.l IIi i 4 ~~4-4-4-4- '+4+4 - --H--- --4 I I~ ~ ~ I I i of' --'4 ii -- 44--__T_
__
_ _ _ _ _ IIIr p 0 0 0 a. 0 E4 -w w " %V 1 % 11MOL FRACTION OF BENZOL IN GAS X 1000 W ~ (o _P, LP 0) __ 0 4- T ... ... 4t --- ...... - ---,N_ g f I p 4 + J -- -- ---M1, + V tI ---.... 4 4-- 44-4:,_ L + -ij 1-T vnt -4 __TT ITI - --- ---T T;T- I T tT . .I I I I A # I I I ... 4-1 + _44 4 'TT f t J Tyl '44 T1 IF '4 V4 Ir p -T FTT 41 TIT --- :# dit 4 H_ 4+ 4 .4-fill H j-:jj --- + -44- 4t IT J1 _T7 -IT44 T I I I + + -fl-H #4411 -44 tL II]C EE1IE 9 0* 0
r
0 -i 0z
0z
0r
x 0 0 0 m g 4",+rr
t-rT1
KI
ti -n .i IT! *1 d K i pr irr4.1~Ti. i 11,~i- ,-T * -4~-i----i<'IL~i-~h--i -1 LI ~1~TjT~1}ji4i4TfiiVtjiM~ T ft ~ I1.i~k
41tiu2~Iti~IitVi[LtiTt
i
I
J~i
11
L
I~t
;4~2~f 2k V -~ t-H<t~-it~ 1 +1 frT ft7; 4-. -''4-4444-.~~10~00
I
t T 14 4j- l TI: t4 4- + it -i-, -,+ +, T ltl :-i- T iT --"-I F T ;- t-.-11
viDISCUSSION OF RESULTS
Method of Gas Analysis for Equilibrium Data
The exact reason why it was impossible to obtain check results of vapor pressure data from the method of gas analysis, is not clear. One possible source of
error was thought to result from the method of introduc-tion of the gas sample into the gas measuring burette. This was accomplished by raising a leveling bottle,
hold-ing water, and connected to the bottle containhold-ing the benzene-straw oil mixtures. The resultant increase in pressure was used to force the gas, above the straw oil surface, into the gas measuring-burette. At first, the pressure of the gas was not measured and variations may have occurred during several analyses. However, by in-troducing a manometer in parallel with the line leading from the straw-oil vessel to the gas burette and keeping a constant pressure during several analyses, no improve-ment was noted in the agreeimprove-ment of results.
The possibility was considered that the use of water as the confining fluid in the gas burette might
cause error. The solubility of benzene in water is very low (6 ) but with the very weak benzene-air mixtures em-ployed, any possibility of diffusion of bezene into or out
of the confining fluid had to be obviated. Consequently, mercury was employed as the confining fluid, both in com-bustion and gas measuring burettes. Still no improvement
was noted in the ability to check results.
Methods of manipulation could not be blamed for non-concordance of results, because several operators carried out the analyses with the greatest of care and differing lengths of time were employed for both the slow oombustion and absorption of carbon dioxide.
The sole remaining possibility was that the com-bustion of the weak benzene-air mixtures was very irregular. For the concentrations used, there was at all times excess air for the combustion and no errors could have resulted from this cause. The filament temperature was varied from a dull red to a white heat and it was endeavored to pass every small portion of the gas sample past this fila-ment several times. However, no agreement of results was obtained by this method and the authors can offer no
further explanations.
Method of Vapor Pressure Measurement for Equilibrium Data
The method of breaking a bulb containing benzene proved satisfactory for obtaining vapor pressure equilibrium data. However, certain conditions must be strictly observed if this method is to be successful. In the first place, the containing vessel and tube leading to the mercury man-ometer should be kept at a constant temperature. The
sys-tem behaves not only as a means of measuring increased vapor pressure due to the addition of benzene to the straw oil but
also as a gas thermometer. This latter property must be strictly controlled and to ensure this condition a very sensitive thermometer should be employed in conjunction with a well-constructed, constant-temperature bath. The authors experienced some difficulty in maintaining
con-stant temperature conditions with the present bath and a somewhat improved set-up would be advantageous. Room temperature conditions should also be controlled. The vent connected to the pressure vessel and shown in
Figure F1 should always be opened, to obtain atmospheric pressure, before breaking the bulb. Certain conditions with respect to the bulb had to be met. Since the
ini-tial pressure in the straw oil vessel was atmospheric, it was necessary that the same total pressure should exist over the benzene in the bulb. The manner of filling the bulbs was such, that care had to be exercised to ensure the benzene was cooled to the- temperature of the thermostat before sealing the end of the bulb. Bulbs made and sealed on one day should therefore not be used on a second day when atmospheric pressure is much different. An error that ap-peared in several of our runs resulted from insufficient
shaking after the breaking of the benzene-containing bulb. In these cases, benzene tends to remain in the top portion of the liquid and inordinately high vapor pressures are shown. It was assumed that in the miaesing of the benzene and straw oil that no net expansion or contraction took place. The method of breaking the glass bulbs, by shaking
J-oz
the container, proved rather tedious and it is suggested that some other means of accomplishing this end, be
devised.
By observing the above rather numerous
condi-tions, as closely as possible, a number of runs were made on benzene-straw oil mixtures of varying concentrations at
26.60C. The results of these runs are shown in Figures VII-IX and agree fairly well with a linear relationship over the employed range of concentrations. The straight
line on Figures 1JA, drawn through the experimentally determined points, represents equilibrium vapor pressures
of benzene over benzene-straw oil mixtures as being 81.0
percent of those calculated from Raoult's Law. On first thought, it would seem that the vapor pressure of benzene over these mixtures should obey Raoult's Law more closely but when we consider the dissimilarity in both molecular structure and weight between benzene and the components which make up the straw oil, our results are not illogical.
It should be further noted that we assumed the de-viation from Raoult's Law, for the temperature at which our plant runs were made, was the same as at the temperature which was employed for our equilibrium runs. This seems logical because the temperatures were only slightly differ-ent and we have no reason to suppose that the change in the deviation from Raoult's Law is large with respect to tempera-ture changes.
Plant Scrubber Runs
The run on the north-east rich tower gave us a value of K
g
of 0.11#
mole of benzene per hour percu-bic feet per atmosphere at a gas rate of 212 and oil rate
of 520 #/hr./ft . This value seems inordinately low compared to the figure obtained from the lean tower of
2
-.320 and .338
#
mols benzene/hr. ft . - atm. It isvery probable that all the xylenes and a large part of the toluene will be absorbed in the rich tower due to the relatively lower volatility of these substances and
the consequently larger driving force. On the other hand, the straw-oil and gas rates are such that, if the conditions
in the rich tower are depicted graphically, the operating line and benzene equilibrium line are close to each other
which means a low driving force for diffusion. Consequently there is only a small amount of benzene absorption in the tower. As a result of this, samples of the entering and exit gas streams, although they may show easily measurable quantities of benzene, may show only a very small difference in the amounts of benzene contained in the two streams. Since
these differences are the quantities used directly for the calculation of Kgge, it is easily seen that the inaccuracy
in Kg,% for the north-east rich tower may be large. For example, with a benzene difference of maybe to mls.
in the two samples and an unavoidable fractionation error of approximately 0.5 m.l., the inaccuracy in this measurement is apparent.
The possibility exists that greater accuracy may be obtained by recovering the benzene from much larger gas and liquid samples. The objection to this procedure rests in the great length of time required to obtain such large gas samples.
An additional factor which would reduce the ben-zene absorption in the rich tower, is the higher oil tem-peratures encountered. This would also tend to reduce the driving force for diffusion of benzene from gas into
the liquid.
The physical condition of the wood cribbing in the rich tower will greatly affect absorption coefficients. It is known that these towers accumulate, in time, a
con-siderable amount of tar, naphthalene and other foreign materials; the direct result, of which, is to reduce to a considerable extent the active surface area employed for absorption. This would, in turn, yield a lower value for the calculated K a. The length of time which had
elapsed since the last cleaning of the tower was not known but was probably much longer than a year. It was known
that the lean south-east tower had been cleaned about a year previously and the rich tower had been cleaned some time previous to that date.
Lean Tower Results
The results obtained from two runs made on the
south-east lean tower checked fairly well. The values obtained for the Kg a's were 0.320 and 0.338
#
molsben-zene/hr.Lft) +atm) at an average gas rate of 210 #/hr.1ft5 and oil rate of
557
#/hr.lft2). As mentioned before, the accuracy with which we could determine values for Kgadepended to a large extent on the magnitude of the differ-ence in the amounts of benzene collected from the inlet and outlet gas samples. Fortunately, in the case of the
lean tower this difference was fairly large, about 53 m/ m.l. in contradistinction to a/ m.l. in the case of
the rich tower. These easily measurable differences
allowed us to calculate our Kg a with a fair degree of ac-curacy, and we believe that the values obtained approach closely the true figure for the present operation of the south-east scrubber at the Bethlehem Steel Company. Data given in Sherwood (8) indicate rather higher values of Kga than obtained by the present investigators; about .6 # mols/
2
(hrhtcu.ft.) -atml at a gas rate of 240 #/hr./ft). and a liquid rate of 680 #/hr.Ift 2 We believe there are several
reasons for this. The previous investigators ( J ) assumed
that the vapor pressure of benzene in benzene-straw oil mixtures obeyed Raoult's Law. This assumption would, con-sequently, lead to smaller values for the log 4p term, for comparable conditions of operation, and, resulting from
this, larger values for Kga were obtained in this report. On the other hand no data has been obtained on the indivi-dual film coefficients and the resulting effect of varying liquor and gas rates. It follows that the value of Kg a
may be considerably changed by variations in the gas or liquor rate. It is very likely that the gas-film is controlling and we should expect the gas rate to have the major effect on the value of Kga and the liquor rate to play only a minor part. To check our results for both the effects of the deviation from Raoult's Law and
differ-ent gas rate, our average Kga has been recalculated assum-ing Raoult's Law to hold and the resultassum-ing Kgahas been assumed to vary with the 0.8 power of G(# gas/hr.(ft 2)
By doing so, we obtain a value of Kga equal to .36 compared
to .6 # mols/hr)./ft ).LatmI at the same gas rate as
employed by ( S~) . It would appear that there must be some further reason why the Kgo as obtained by the
present investigators are lower than those formerly obtained.
A third reason for a lower value of Kg a in the
present report is the aforementioned effect of the clogging of the wood packing by foreign material. The values for
Kg a, obtained by (S~) , were done shortly after the tower had been cleaned; our values were obtained after the tower had been in operation for one year.
r7
KG. as for toluene and xylene
In the present investigation it was impossible to obtain absorption coefficients for toluene and xylene. The mechanical difficulties encountered in obtaining even satisfactory amounts of benzene in the gas samples, prac-tically precluded obtaining measurable quantities of
tolu-ene and xyltolu-ene. However, the design of a somewhat larger ether bubbler and condenser coil equipment should not
prove difficult, thereby allowing an increased gas flow resulting in the collection of sufficient amounts of
tolu-ene and xyltolu-ene in a reasonable period of time. A Kga of
0.3
#
mol of toluene/hrl/ft.,3 atml1 was calculated fromrather meager data obtained from the run on the rich tower. It should be noted that.the use of the oil rate has been employed in obtaining the.material balance around the tower. The greater with which the oil rate could be measured led to its adoption for calculation purposes.
Sample Treatment
In the collection of light oil from the gas samples, one very important point was noted. Previous
investiga-tors (2 ) had noted that the occurrence of ethanol in the ether used for absorption of light oil was not uncommon.
Since the boiling points of ethanol and benzene are so close,
intro-duced into the fractionation analysis for benzene if un-known amounts of ethanol were present. To guard against this possibility, all the ether used for absorption pur-poses was not only redistilled but also kept over calcium chloride, metallic sodium and clean iron nails.
On the temperature + volume graphs obtained from the fractionation of the light oil-ether mixtures, the a-mount of pure substance present was taken as that volume which distilled in the range of approximately +,C. of
the true boiling point for the given material. Reference to Figures T - will show that this was a logical
assumption. This procedure was very satisfactory for benzene but, in the case of toluene and xylene, the a-mounts of these two substances present were so small that a reasonably flat portion in the distillation curve was very difficult to obtain. As mentioned before, the only means of securing accuracy in the measurement of the a-mounts of toluene and xylene would be the absorption of light oil from larger gas samples or the employment of a somewhat thinner, or possibly shorter, fractionation
column in which the "hold-up" would be considerably re-duced. The use of 1/4" copper wire spirals proved to be
successful as packing material in the fractionation column and by the addition of naphthalene to the distillation
flask practically all of the light oil fractions could be distilled off. Heat loss, however, was considerable from


![[PDF] Support d’initiation au Graphisme avec GIMP | Cours informatique](data:image/gif;base64,R0lGODlhAQABAIAAAP///wAAACH5BAEAAAAALAAAAAABAAEAAAICRAEAOw==)