HAL Id: hal-01129578
https://hal.archives-ouvertes.fr/hal-01129578
Submitted on 29 May 2020
HAL is a multi-disciplinary open access archive for the deposit and dissemination of sci-entific research documents, whether they are pub-lished or not. The documents may come from teaching and research institutions in France or abroad, or from public or private research centers.
L’archive ouverte pluridisciplinaire HAL, est destinée au dépôt et à la diffusion de documents scientifiques de niveau recherche, publiés ou non, émanant des établissements d’enseignement et de recherche français ou étrangers, des laboratoires publics ou privés.
Expression of seasonality in Merinos d’Arles ewes of
different genotypes at the MT1 melatonin receptor gene
Jacques Teyssier, Martine Migaud, Nathalie Debus, Celine Maton, Emmanuel
Tillard, Benoit Malpaux, Philippe Chemineau, Loys Bodin
To cite this version:
Jacques Teyssier, Martine Migaud, Nathalie Debus, Celine Maton, Emmanuel Tillard, et al.. Expres-sion of seasonality in Merinos d’Arles ewes of different genotypes at the MT1 melatonin receptor gene. animal, Published by Elsevier (since 2021) / Cambridge University Press (until 2020), 2011, 5 (3), pp.329-336. �10.1017/S1751731110001813�. �hal-01129578�
doi:10.1017/S1751731110001813
Expression of seasonality in Merinos d’Arles ewes of different
genotypes at the
MT1
melatonin receptor gene
J. Teyssier
1,2,3-, M. Migaud
4,5,6,7, N. Debus
1,2,3, C. Maton
1,2,3, E. Tillard
1,2,3, B. Malpaux
4,5,6,7,
P. Chemineau
4,5,6,7and L. Bodin
8-1
INRA, UMR868 Elevage des Ruminants en Re´gions Chaudes, 2 place Viala, F-34060 Montpellier, France;2Montpellier SupAgro, F-34060 Montpellier, France;
3
CIRAD, F-34060 Montpellier, France;4INRA, UMR85 Physiologie de la Reproduction et des Comportements, F-37380 Nouzilly, France;5CNRS, F-37380 Nouzilly, France;6Universite´ Franc¸ois Rabelais de Tours, F-37041 Tours, France;7Haras Nationaux, F-37380 Nouzilly, France;8INRA, UR631 Station d’Ame´lioration Ge´ne´tique
des Animaux, F-31326 Castanet-Tolosan, France
(Received 24 September 2009; Accepted 20 July 2010; First published online 29 September 2010)
Spontaneous ovulatory activity (SOA) in spring has been used to study the out-of-season breeding ability of Merinos d’Arles (MA) ewes. Within this breed, an association was found between more intense seasonality and genotype 2/2 at aMnlI restriction site (allele 2 for its absencev.1for its presence) in Exon II of theMT1receptor gene. This study was designed to ascertain whether this association results in a direct effect of theMT1genotype on the expression of seasonality in MA ewes. In the first year of the study, genotyping of 314 MA ewes at locusMnlI was carried out and resulted in frequencies of 43.0%, 44.9% and 12.1% for genotypes 1/1, 1/2 and 2/2, respectively. The SOA of these ewes was determined in early April of two consecutive years by assaying plasma progesterone concentrations in two blood samples taken 9 days apart. Groups of 30 ewes of each homozygous genotype (1/1 and 2/2) were identified from this population and their SOA was followed by taking blood samples at regular intervals between January and mid-April of the second and third year of the study. In the second year, groups of ewes were managed together on rangelands, whereas in the third year each group was split into two subgroups given differential feed levels. The results clearly showed that genotype had no significant effect on SOA during the 2- to 3-month period preceding the introduction of rams for spring mating. In the second year of the study, in which the experimental procedure allowed a fair comparison of the fertility of ewes in spring mating, fertility was similar for both genotypes. The reciprocity of the association was not demonstrated and theMnlI polymorphic site could not be used as a genetic marker of selection for out-of-season breeding ability, at least not in the MA breed. The percentage of cycling ewes significantly decreased between January and April, and older ewes (5 or 6 years old depending on the year of the study) were more cyclic than younger ones (2 and 3 years old, respectively). The differential feeding level of ewes from early February did not significantly affect their SOA during the time period studied in the third year of the study.
Keywords: sheep, seasonality, ovulatory activity, melatonin receptor gene, feeding level
Implications
Seasonality of reproduction in sheep has a genetic compo-nent; however, the results of classical polygenic selection for the traits associated with spring breeding are limited. The use of polymorphic quantative trait loci or associated genetic markers could improve the efficiency of selection. Various studies on different sheep breeds suggest that polymorphism in the MT1 receptor gene may be a potential marker of selection. This study of Merinos ewes, tests the linkage between this polymorphism and the expression of seasonality. The results do not support the use of genotyping forMT1as a means of selection for aseasonality.
Introduction
Seasonality of reproduction remains an important constraint in temperate sheep breeds in which ovulatory activity generally is inhibited in spring. Measurements of spontaneous ovulatory activity (SOA) in early spring, before the introduction of males into the flock, has been used to study out-of-season breeding ability in several low seasonal sheep breeds such as Merinos d’Arles (MA; Hanocqet al., 1999), Latxa (Beltran de Heredia
et al., 2002) and Chios (Avdiet al., 2003). Very similar results
with regard to SOA have been found in the above studies; this trait is repeatable and its heritability ranges from 0.12 to 0.22. In the MA breed, a strong association has been observed between breeding value for SOA in April and restriction poly-morphism at position 605 in Exon II of the MT1 melatonin
receptor gene, corresponding to the presence (allele 1) or absence (allele 2) of aMnlI restriction site (Pelletieret al., 2000). More intense seasonality was associated with genotype 2/2. The discovery of this association extended previous results of Messeret al. (1997) and could point to a specific role of theMT1 genotype in seasonal anoestrus; this study was designed to test this hypothesis. After genotyping MA ewes in a single flock in the first year of the study, groups of ewes from each homozygous genotype (1/1 and 2/2) were identified and their SOA was assessed between the end of drying-off (January) and the beginning of spring mating (April) over two consecutive years. In the first year of this observation period (year two of the study), groups of ewes were managed toge-ther on rangelands (experiment 1). In the following year, they were kept in a sheepfold where half of the ewes of each genotype were fed at a higher level than the other half to also test the effect of feeding levels on SOA (experiment 2). This study provides results on genotype frequencies in MA, on SOA in early April for the genotyped ewes, and on the follow-up of SOA of 1/1 ewes and 2/2 ewes between January and mid-April (before spring mating) under different experimental conditions.
Material and methods
Association study between genotype at the
MnlI locus and SOA
Following genotyping of 314 MA ewes for theMnlI site early in 2003, their SOA was assessed in April of two consecutive years (2003 and 2004) by measuring peripheral progester-one levels twice in a 9-day period. These ewes from progester-one flock belonging to an experimental farm, Le Merle (south-eastern France, latitude 43.58N), were born in autumn lambing from 1998 to 2001, that is, aged 1 to 4 years at the beginning of 2003. The flock was established in the 1920s and at the time of the study included approximately 1100 pure MA ewes and 30 rams. Renewal was about 20% per year and the foreign breeding material introduced, consisting only of rams or semen, came from a regional breeding centre where male lambs from different sheep flocks were raised to pro-vide breeding rams. These rams were the offspring of ewes qualified as ‘ram dams’ whose selection criteria were unre-lated to seasonality with the exception that the male lambs had to be born in autumn to enter the breeding centre. Over the last 14 years, the percentage of ewes from identified sires has remained above 50%. Genotyping was performed on 314 DNA samples prepared from ewes using the proce-dure described in detail by Pelletier et al. (2000). The resulting genotypes were represented as 1/1, 1/2 and 2/2 according to the presence (allele 1) or absence (allele 2) of theMnlI restriction site. In addition, the physiological status for SOA of the genotyped ewes (anovulatory or ovulatory) was determined in early April for 2 years (2003 and 2004). For this, we used the criteria established by Thimonier (2000), which hold that plasma progesterone concentrations in two blood samples taken 7 to 11 days apart are adequate for the detec-tion of ovulatory activity at a given period in ewes with regular
ovarian cycles of 17 days on average and to discriminate the two physiological statuses. The most accurate results are obtained at an interval of 9 days between blood samples. Out of the 314 genotyped ewes, 312 were sampled twice in April 2003; however, only 289 were sampled in April 2004 because some had died or had been culled over the inter-vening year. Ewes with a progesterone level above the threshold of 1 ng/ml in at least one of the two consecutive blood samples were considered to be ovulatory or cycling. Progesterone concentrations were measured by radio-immunoassay using the technique described by Terqui and Thimonier (1974).
As a rule, all of the MA ewes involved in the study were mated for the first time at 18 months of age and were joined with rams between April and June in subsequent years. They were kept completely separate from males during the months between the annual spring mating.
Assessment of SOA over a long period in 1/1 and 2/2 ewes
Experiment 1. In early 2004, two groups of 30 1/1 and 30
2/2 ewes of similar age distribution (2, 3 and 5 years old) were identified from the population of genotyped ewes. The other sampling criteria for adults (3 and 5 years old) were fertility and the number of lambs suckled during the previous autumn lambing. The paternity of all of the ewes was not known; however, when possible, we tried to include ewes from different sires. From 15 January to 14 April, the SOA of ewes was assessed by measuring progesterone concentra-tions in blood samples taken 7 days apart. As the period of observation was long, the 7-day interval was chosen for logistical reasons, that is, to have a fixed day each week to take blood samples in the ewe groups. With this collection interval, the detection of ovulation is similar to that obtained with an interval of 9 days, especially when one can examine the progesterone levels in more than two consecutive blood samples to determine the status of SOA at a given period (Thimonier, 2000). The ewes were kept on separate range-lands to avoid repeated sorting of animals during the experiment, and their shearing was carried out over a single day at the end of March. At the end of blood sampling, the two groups of ewes were reunited on 15 April and three rams were introduced into this combined group for 1 month. They then joined the rest of the spring mating MA flock from mid-May to mid-June.
Experiment 2. In January of the following year (2005),
60 ewes from the population of genotyped ewes were divi-ded into two groups of 30 ewes each; in each group, 15 ewes were 1/1 and 15 ewes were 2/2. These groups of ewes of similar age distribution (3, 4 and 6 years old) were balanced in terms of live weight (LW), body condition score (BCS), fertility and the number of lambs suckled during the previous autumn lambing. Several ewes involved in this experiment (15 1/1 and 7 2/2) were not the same as in the previous year due to the sampling procedure and the replacement of dead or culled animals. The two groups of ewes were Teyssier, Migaud, Debus, Maton, Tillard, Malpaux, Chemineau and Bodin
transferred to a sheepfold with natural light and, after a 15-day period of acclimatization together, placed in two adjacent pens with different feeding levels from 3 February to 14 April. One group was fed at a low level (L): 70% of maintenance energy requirements, with a diet composed of straw and pelleted alfalfa. The other one was fed at a high level (H): about 170% of maintenance energy through the addition of pelleted alfalfa and pelleted beet pulp. Daily rations for the H and L diets were formulated to increase the BCS by about 1 point in 60 days (H diet) or to maintain the LW and BCS at the level at which they were at the end of drying-off (L diet). The H diet was reduced to maintenance requirements beginning in late March to prevent excessive fattening at mating. Daily rations were established on the basis of standard feeding values for the ingredients (Jarrige, 1988). They were distributed, between midday and 1400 h, in racks allowing simultaneous access to all ewes. In each pen, the ewes had free access to water, salt blocks and a mineral–vitamin pre-mix.
Immediately before the different diets were introduced, SOA was determined by the progesterone levels in the two blood samples taken 9 days apart, using the rules of inter-pretation already defined for the two samples. SOA was then assessed through blood samples collected at 9- to 10-day intervals from 25 February to 14 April. Ewes were weighed at this interval and their condition scored at a double interval on a 5-point graded scale (Russel et al., 1969) with 0.25 subdivisions. After an additional 12-day period of re-feeding (or feeding) at the maintenance requirement level in the sheepfold, the ewes were exposed to rams on pastures from 27 April to mid-June. For this experiment, shearing was delayed until the beginning of May, that is, during the mating period.
Periods of SOA
For the long-term experiments, determination of status (cycled or non-cycled) of a ewe at each blood sampling point of time was based on progesterone level at the time of sampling and additional information obtained from other progesterone measurements on the same ewe during the sampling period. Unlike the analysis of two consecutive blood samplings, interpretation of progesterone levels in sequential blood samples required taking into account the timing of observations. A measurement below the threshold of 1 ng/ml of progesterone (coded 0, non-cyclic or follicular phase) that followed a measurement above the threshold (coded 1, luteal phase) was therefore included systematically in the definition of periods of SOA. With the 7-day interval retained in experiment 1, the infrequent occurrence of two consecutive measurements below the threshold that both followed and preceded observations above the threshold also were included in periods of continuous activity. For example, in experiment 1, the vector ofnobservations for a ewe [1 0 1 1 0 0 1 0 0 0 0 1 1 0] was interpreted as [ 1 1 1 1 1 1 1 0 0 0 1 1 1]. In experiment 2, in which blood samples were taken 9 or 10 days apart, the vector [0 1 0 1 0 0] was interpreted as [ 1 1 1 1 0]. The first observation was used
to determine the SOA of ewes at the following date and analysis of modified data was carried out onn21 variables.
Statistical procedures
The repeatability of SOA for the 2 years of measurements in April on all genotyped ewes was estimated by the coefficient
f, which is a measure of the degree of association between all-or-nothing traits as two binary variables (Yule, 1912).
The effects of genotype and feeding level on SOA variables (0/1 modified data) were investigated by a logistic regression of longitudinal data sets from experiments 1 and 2 using a marginal model, generalized estimating equa-tions (GEE; Diggleet al., 2002). GEE can be regarded as an extension of GLM for the analysis of correlated data. In the general framework of longitudinal analysis, GEE takes into account the dependency of repeated observations within subjects by specifying a ‘working correlation structure’. In this case, the correction for within-ewe correlation was car-ried out by assuming an auto-regressive correlation structure for the repeated-in-time measurements. This option was retained in the model to obtain efficient estimates of the standard error (robust s.e.) of coefficients and hence efficient inference tests (Wald test), the Wald statistic being used for assessing significance of coefficients (Hosmer and Lemeshow, 2000). Under the null hypothesis, this statistic, also calledz, will follow a standard normal distribution.
In these analyses, the date of observation was introduced as a linear continuous variable (coded from 0 for the first date tonfor the last date) and genotype, age and diet as categorical variables. Interactions that are important for interpreting the effect of genotype, for example, genotype by date and genotype by diet, were introduced in a first step and were excluded from the final model if they had no significant effect (Wald test with aP-value .0.05). The geno-type 2/2, the first class of age (2 or 3 years old according to the studied data set) and the L diet were used as reference categories. Analyses were performed using R software: GEE function, binomial family, logit link, AR-M (M51) correlation structure (R Development Core Team, 2007).
Other comparisons between genotypes (and feeding levels) on SOA percentage were carried out using x2test and odds ratio (OR, and CI for its confidence interval). One-tailedt-test was used for the comparisons between feeding levels on ewe LW and ewe BCS.
Results
Genotypic frequencies and SOA in April
Frequencies of genotypes 1/1, 1/2 and 2/2 in the population of 314 genotyped ewes were 43.0% (n5135), 44.9% (n5141) and 12.1% (n538), respectively; this agrees with the Hardy–Weinberg equilibrium (p2, 2pq, q2
with p50.65 and q512p) and suggests that the MnlI locus is not under selection in the MA population under investigation. With regard to this large sample of MA ewes (Table 1), there was no significant difference between geno-types in the percentage of ovulatory ewes in early April in
either year of measurement (x2test:P50.83 andP50.35 in 2003 and 2004, respectively). Only 30 ewes were ovu-lating in early April in both of the 2 years, and none was of genotype 2/2 (17 1/1, 13 1/2). The repeatability of SOA for the two consecutive years was 0.28.
Time changes in SOA of homozygous ewes
Experiment 1. Two ewes of genotype 2/2 were eliminated
during the experiment: one at the beginning, the other died before the last blood sampling. The representation of changes in the percentage of cyclic ewes from January to mid-April (Figure 1) displays a similar change in SOA over time in both groups of ewes (30 1/1 and 29 to 28 2/2). This change was marked by the occurrence of a temporary rise in ovulatory activity triggered prior to shearing on 29 March. In early April, which is the usual period of SOA measurement before rams are introduced, no difference was observed between genotypes. The overall percentage of cyclic ewes on 14 April was 25.9%.
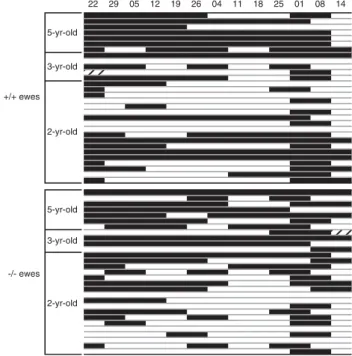
Patterns of SOA for individual ewes (Figure 2) show that many ewes of both genotypes exhibited discontinuities in their ovulatory activity. In several of these ewes, no ovulatory activity was detected for periods of 2 to 3 weeks, suggesting the failure of a single cycle. The proportion of ewes con-tinuously cycling at least until the apparent end of their SOA (11/30 and 6/29 for 11 and 2/2 ewes, respectively) did not differ significantly between genotypes (OR 5 2.22 with a 95% CI of 0.69, 7.12).
The results of the GEE analysis of this data set showed in the first place that the interaction between genotype and date was not significant. Therefore, the final fitted model was reduced to the main effects of genotype, age and date variables (Table 2). The effect of genotype on SOA was not significant (P50.68). For the age effect, the 5-year-old ewes were much more likely to be cyclic than the 2-year-olds (P,0.001), while no significant difference was observed between 3- and 2-year-old ewes (P50.38). The effect of date was highly significant (P,0.001) with a negative estimate of the coefficient; this linear variable indicates an overall decrease of SOA among the ewes from January to mid-April.
Experiment 2. Changes in ewe LW and ewe BCS during this
experiment are shown in Table 3 for the groups of ewes fed at high and low levels (15 or 14 1/1 and 15 2/2 ewes per group; one 1/1 ewe was eliminated early after the
Table 1Percentage of ovulatory ewes in early April in the MA genotyped for the MnlI site, according to genotype and year of measurement
2003 2004
Genotype Number of ewes1 Ovulatory ewes (%) Number of ewes1 Ovulatory ewes (%)
1/1 133 30.8 129 20.2
1/2 141 28.4 129 15.5
2/2 38 26.3 31 25.8
MA 5 Merinos d’Arles.
1Number of ewes sampled on 2 and 11 April 2003 (n5312); 5 and 14 April 2004 (n5289).
0 20 40 60 80 100
Jan22 Feb05 Feb19 Mar04 Mar18 Apr01 Apr14 Date
Cyclic ewes (%)
+/+ –/–
Figure 1 Changes in the percentage of cyclic ewes between January and mid-April for 1/1 ewes (n 5 30) and 2/2 ewes (n 5 29 to 28) in experiment 1. Jan 22 Jan 29 Feb 05 Feb 12 Feb 19 Feb 26 Mar 04 Mar 11 Mar 18 Mar 25 Apr 01 Apr 08 Apr 14 +/+ ewes -/- ewes 3-yr-old 2-yr-old 5-yr-old 3-yr-old 2-yr-old 5-yr-old
Figure 2 Periods of spontaneous ovulatory activity for individual ewes in experiment 1 sorted by age within genotype. Hatched areas indicate the absence of observation, open areas indicate periods of anovulatory activity.
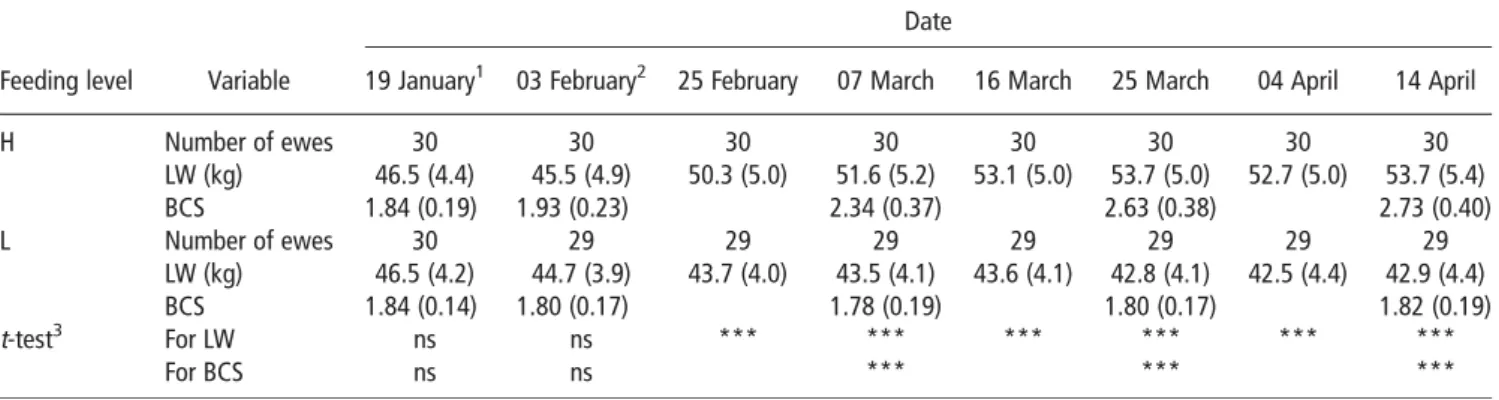
constitution of the ewe groups). Average values for LW and BCS, which were equal between groups when they were constituted, differed significantly after 1 month of differential diets. From early February until the end of the experiment, the H diet induced an increase of 8.2 kg for LW and 0.8 point for BCS, while these traits remained approximately constant until the end of experiment for the ewes on the L diet.
For this controlled group feeding experiment, results of the GEE analysis of the SOA data set from 7 March to mid-April, when the ewes had been fed at different levels since early February, indicated similar trends as in experiment 1. The interaction between genotype and date as well as between genotype and diet were not significant; they con-sequently were excluded from the final model whose results are given in Table 4. These results confirmed the absence of effect of genotype on SOA (P50.35); the presence of effect of age, with the 6-year-old ewes significantly more cyclic than the 3-year-olds (P,0.01); and the significant decrease in SOA among ewes during the period of study (P,0.001). In addition, the result for the diet variable (P50.32) showed that the feeding level had no significant effect on the cycli-city of ewes within this period. The corresponding changes in SOA according to genotype (irrespective of diet) or to diet
(irrespective of genotype) are presented in Figures 3 and 4, respectively. At the end of this experiment on 14 April, the average percentage of cyclic ewes was 16.9%.
Fertility in spring mating
In experiment 1, in which ewes were joined with rams the day after the last blood sampling, there was no significant difference between genotypes in fertility in spring mating: 90% of 1/1 ewes and 89.3% of 2/2 ewes later lambed the following autumn. There also was no difference in pro-lificacy (1.32 and 1.28, respectively). During the first 15 days after joining, on the basis of autumn lambing, there were a few more 1/1 ewes fertilized or conceiving than 2/2 ewes (6 and 3 ewes, respectively), but this difference was not significant. Furthermore, the cumulative distribution of lambing dates did not differ significantly between genotypes (P.0.05, non-parametric Kolmogorov–Smirnov two-sample test). In experiment 2, the comparison between genotypes of the fertility of ewes after the spring mating was not an objective because of the 12-day period of re-feeding of underfed ewes
Table 2Estimated coefficients, s.e., Wald statistics and P-values for the GEE model fitted to SOA data set from experiment 1, including genotype and age categorical variables and date continuous variable Variable Category1 Coefficient s.e.2 Wald statistic (z ) P . z Genotype 1/1 0.133 0.327 0.41 0.684 Age 3 years old 0.472 0.537 0.88 0.380 5 years old 1.264 0.335 3.77 ,0.001 Date 20.096 0.024 23.92 ,0.001
GEE 5 generalized estimating equations; SOA 5 spontaneous ovulatory activity.
1Reference categories for categorical variables are not included.
2Robust s.e. of the coefficients provided by the GEE method with the option of
an auto-regressive structure of correlation within each ewe. z5coefficient/s.e., withP-value calculated from a normal table.
Table 3Evolution of LW and BCS in the groups of ewes fed at H and L levels (170% and 70% of maintenance energy requirements, respectively) from early February: mean value (s.d.)
Date
Feeding level Variable 19 January1 03 February2 25 February 07 March 16 March 25 March 04 April 14 April
H Number of ewes 30 30 30 30 30 30 30 30 LW (kg) 46.5 (4.4) 45.5 (4.9) 50.3 (5.0) 51.6 (5.2) 53.1 (5.0) 53.7 (5.0) 52.7 (5.0) 53.7 (5.4) BCS 1.84 (0.19) 1.93 (0.23) 2.34 (0.37) 2.63 (0.38) 2.73 (0.40) L Number of ewes 30 29 29 29 29 29 29 29 LW (kg) 46.5 (4.2) 44.7 (3.9) 43.7 (4.0) 43.5 (4.1) 43.6 (4.1) 42.8 (4.1) 42.5 (4.4) 42.9 (4.4) BCS 1.84 (0.14) 1.80 (0.17) 1.78 (0.19) 1.80 (0.17) 1.82 (0.19) t-test3 For LW ns ns *** *** *** *** *** *** For BCS ns ns *** *** ***
LW 5 live weight; BCS 5 body condition score; H 5 high level; L 5 low level.
1Constitution of the groups of ewes. 2
Start of differential feeding levels.
3Unilateralt-test by the hypothesis that the mean value for H diet was greater than the mean value for L diet.
Table 4 Estimated coefficients, s.e., Wald statistics and P-values for the GEE model fitted to SOA data set from experiment 2 (7 March to 14 April), including genotype, age and diet categorical variables and date continuous variable
Variable Category1 Coefficient s.e.2 Wald statistic (z) P . z Genotype 1/1 20.478 0.506 20.94 0.345 Age 4 years old 0.977 0.686 1.43 0.154 6 years old 1.711 0.635 2.70 0.007 Diet H level 0.522 0.522 1.00 0.318 Date 20.368 0.091 24.04 ,0.001
GEE 5 generalized estimating equations; SOA 5 spontaneous ovulatory activity; H 5 high level.
1
Reference categories for categorical variables are not included.
2Robust s.e. of the coefficients provided by the GEE method with the option
of an auto-regressive structure of correlation within each ewe. z5Coefficient/s.e. withP-value calculated from a normal table.
before mating and the delayed shearing time, which had been postponed until after mating began.
Discussion
Pelletieret al. (2000) have shown that a mutation at position 612 in Exon II of the ovineMT1gene leads to the absence of a cleavage site for theMnlI enzyme at position 605 (allele 2). They showed that this mutation was always found to be asso-ciated with a single allelic isoform among the different isoforms described for this exon. This haplotype is characterised by the specific and constant presence of four mutations, including the one (612) responsible forMnlI polymorphism, two other silent mutations at positions 453 and 891, and a mutation at position 706 that results in one base change in the amino acid sequence of the predictedMT1receptor protein (substitution of a valine by an isoleucine). Several independent results point out a potential functional role of this locus on the control of seasonality:
1. Within breeds, Pelletier et al. (2000) found a highly significant difference in the frequency of homozygotes 2/2 between two groups of MA ewes screened for their SOA in
spring. Ewes homozygous for the absence of theMnlI site were not observed in the group of ewes cycling in April over three consecutive years (1995 to 1997). This study conducted on the same flock showed that 2/2 ewes also were not found in the group of 30 ewes that cycled in April over two consecutive years (2003 and 2004). Furthermore, a significant effect ofMnlI polymorphism on fertility in spring mating has been reported (Notter et al., 2003) for adult ewes from a composite line (50% Dorset, 25% Rambouillet, 25% Finnsheep). Adult ewes with the genotype 2/2 had lower spring fertility. Significant differences between 1/1 or 1/2, and 2/2 genotypes in lambing frequency also were reported among Dorset ewes managed by an accelerated lambing system (Mateescuet al., 2009). 2. Comparisons between breeds also support the
func-tional role of theMT1genotype. Substantial changes in allelic frequencies at the MnlI site with the degree of seasonality of breeds have been described by several different authors (Messeret al. 1997; Pelletieret al. 2000; Notter and Cockett, 2005). For example, ewes of seasonal breeds had relatively higher frequencies of genotype 2/2 than ewes of low seasonal breeds. Thus, genotype 2/2 was not found in a large sample of ewes from the non-seasonal small-tailed Han breed in China
(Chu et al., 2003) and the following gradient of the
percentage of 2/2 ewes was encountered in samples of several breeds: 9% in Blackbelly; 7% in Barbarine; 10% in MA; 31% in Ile-de-France; 35% in Suffolk; 100% in wild Mouflon (Trecherel, 2007).
3. Various physiological studies reinforce the assumption of a close relationship between the expression of season-ality and polymorphism of theMT1receptor gene. In MA 2/2 ewes, a higher density of melatonin receptors has been found in the pars tuberalis (Pelletieret al., 2000) as well as in four other brain areas (Trecherel, 2007). One of these areas belongs to the pre-mammillary hypothalamus, which is an important site of melatonin action regulating the reproductive function in sheep (Malpauxet al., 2001). 4. Moreover, the contrast between the unique allelic isoform of Exon II associated with higher seasonality in several breeds and large variability of other haplotypes suggests a common origin of this particular haplotype, which had not been lost through selection and dissemination due to the selective advantage it confers.
Despite these findings, the relationship between the studied part of Exon II of theMT1gene and the phenotype of seasonality remains unclear. First, this study indicates that in MA, no difference was observed between ewes of geno-type 1/1 and 2/2 in the rate of SOA in early spring or on fertility in spring mating. Second, various attempts failed to find a difference by various criteria (beginning, end or length of the breeding season) within the genotyped progeny (1/1 and 2/2) of heterozygous sires in Ile-de-France (Hernandez
et al., 2005) and Latxa breeds (Ugarteet al., 2007).
How may these two contradictory sets of findings be reconciled? It is unlikely that the relationship between the
0 20 40 60 80 100 Date Cyclic ewes (%) +/+ –/–
Feb03 Mar07 Mar16 Mar25 Apr04Apr14
Figure 3 Changes in the percentage of cyclic ewes between February and mid-April for 1/1 ewes (n 5 29) and 2/2 ewes (n 5 30) in experiment 2 (irrespective of diet). 0 20 40 60 80 100
Feb03 Mar07 Mar16 Mar25 Apr04 Apr14
Date
Cyclic ewes (%)
H L
Figure 4 Changes in the percentage of cyclic ewes between February and mid-April for H level (n 5 30) and L level (n 5 29) ewes in experiment 2 (irrespective of genotype). Ewes were fed at different levels from 3 February.
expression of seasonality and polymorphism of theMT1gene found in MA (Pelletieret al, 2000), OOS (Notteret al., 2003) and Dorset (Mateescu et al., 2009) ewes is casual. On the other hand, the mutated haplotype has been observed in enough animals of different breeds to exclude a sampling artefact. One hypothesis explaining this discrepancy would be the existence of another non-conservative mutation on an independent gene. Selection for spring ovulation would increase the frequency of favourable alleles at both sites, including theMnlI site. This would explain the results observed by Pelletieret al. (2000). In contrast, the screening of animals only for the presence or absence of theMnlI site would not have any influence on the proportions of alleles at the other site, and this therefore would be insufficient to induce a change in the expression of seasonality. Support for this hypothesis would come when such a non-conservative muta-tion has been identified; however, it has not yet been found.
With regard to environmental effects, it is important to note that the beginning of the unexpected rise of SOA in the first experiment (experiment 1) was observed on 25 March, that is, 4 days before shearing. No other change in manage-ment, handling or treatment may be associated with the increase of SOA on this date. The amplitude of the peak of SOA was probably related to shearing; however, its start before shearing might reflect spontaneous changes in the Mediterranean environment of grazing ewes with an increase in pasture availability and forage intake on rangelands after the colder months (January and February). Such events (shearing, re-growth on rangelands) could partially explain the inter-annual variations of the cyclicity rate observed in early April for MA ewes from first generations of selection lines for SOA at this time (Teyssieret al., 2002). The intro-duction of controlled feeding levels in experiment 2 was also justified by different studies that have shown relationships between ovulatory activity and LW and BCS of ewes from Merino flocks (Hanocq et al., 1999; Kleemann and Walker, 2005). In this study, the occurrence of a small divergence between diets at the end of the study period might suggest a delayed effect of feeding level on SOA (Teyssieret al., 2006), but such a hypothesis was clearly challenged by the final analysis of results using a model suited to this type of data. The substantial differences in LW and BCS induced by differ-ential feeding levels from February thus had no significant effect on SOA at the beginning of April. This agrees with results on Barbarine ewes (Khaldi, 1984), which have shown that significant variations of ewe LW between drying-off and the spring introduction of rams had no significant effect on the percentage of cyclic ewes before the beginning of mating, whereas initial differences in LW established during a pre-experimental period before drying-off significantly affected this percentage.
In conclusion, results of this study show that genotype at locusMnlI of theMT1receptor gene cannot be used alone as a genetic selection marker for spring (out-of-season) breeding in sheep, at least not in the MA breed. Further studies are required to define the role of this genomic region in the expression of seasonality. In addition, while the results
illustrate the responsiveness of SOA to events such as shearing and spontaneous variations in the Mediterranean environment of grazing ewes, they do not show a significant effect of differential feeding of sheepfold ewes after drying-off on their SOA before spring mating.
Acknowledgements
We wish to thank especially P.M. Bouquet in charge of the experimental farm ‘Domaine du Merle’, J.D. Guyonneau, D. Montier and J.M. Capron for their contribution to the experiments and the staff of the INRA assay laboratory of Nouzilly for the progesterone assays. We are also grateful to A. Collet who per-formed genotyping of ewes. This work was supported by Institut National de la Recherche Agronomique (INRA): Departement PHASE (Grants CI 2004 and CI 2005), Departement GA.
References
Avdi M, Banos G, Kouttos A, Bodin L and Chemineau P 2003. Sources of variation and genetic profile of spontaneous, out-of-season ovulatory activity in the Chios sheep. Genetics Selection Evolution 35, 65–76.
Beltran de Heredia I, Urgate E, Malpaux B, Canepa S and Bodin L 2002. Genetic aspects of out of season breeding ability in Latxa sheep. In Proceedings of the 7thWorld Congress on Genetics Applied to Livestock Production, vol. 30.
pp. 717–720. Institut National de Recherche Agronomique (INRA), Castanet-Tolosan, France.
Chu MX, Ji CL and Chen GH 2003. Association between PCR-RFLP of melatonin receptor 1a gene and high prolificacy in Small Tail Han sheep. Asian-Australasian Journal of Animal Sciences 16, 1701–1704.
Diggle PJ, Heagerty P, Liang KY and Zeger SL 2002. Analysis of longitudinal data, 2nd edition. Oxford University Press, New York, USA.
Hanocq E, Bodin L, Thimonier J, Teyssier J, Malpaux B and Chemineau P 1999. Genetics parameters of spontaneous spring ovulatory activity in Merinos d’Arles sheep. Genetics Selection Evolution 31, 77–90.
Hernandez X, Bodin L, Chesneau D, Guillaume D, Chemineau P, Malpaux B and Migaud M 2005. Relationship between MT1 melatonin receptor gene polymorphism and seasonal physiological responses in Ile-de-France ewes. Reproduction Nutrition Development 45, 151–162.
Hosmer DW and Lemeshow S 2000. Applied logistic regression, 2nd edition. John Wiley & Sons, Inc., New York, USA.
Jarrige R 1988. Alimentation des bovins, ovins et caprins, 1st edition. Institut National de Recherche Agronomique (INRA), Paris, France.
Khaldi G 1984. Variations saisonnie`res de l’activite´ ovarienne, du comportement d’oestrus et de la dure´e de l’anoestrus post-partum des femelles ovines de race Barbarine: influences du niveau alimentaire et de la pre´sence du maˆle. PhD thesis, Montpellier University, France.
Kleemann DO and Walker SK 2005. Fertility in South Australian commercial Merino flocks: relationships between reproductive traits and environmental cues. Theriogenology 63, 2416–2433.
Malpaux B, Migaud M, Tricoire H and Chemineau P 2001. Biology of mammalian photoperiodism and the critical role of the pineal gland and melatonin. Journal of Biological Rhythms 16, 336–347.
Mateescu RG, Lunsford AK and Thonney ML 2009. Association between melatonin receptor 1A gene polymorphism and reproductive performance in Dorset ewes. Journal of Animal Science 87, 2485–2488.
Messer LA, Wang L, Tuggle CK, Yerle M, Chardon P, Pomp D, Womack JE, Barendse W, Crawford AM, Notter DR and Rothschild MF 1997. Mapping of the melatonin receptor 1a (MTNR1A) gene in pigs, sheep, and cattle. Mammalian Genome 8, 368–370.
Notter DR, Cockett NE and Hadfield TS 2003. Evaluation ofmelatonin receptor 1aas a candidate gene influencing reproduction in an autumn-lambing sheep flock. Journal of Animal Science 81, 912–917.
Notter DR and Cockett NE 2005. Opportunities for detection and use of QTL influencing seasonal reproduction in sheep: a review. Genetics Selection Evolution 37 (suppl. 1), S39–S53.
Pelletier J, Bodin L, Hanocq E, Malpaux B, Teyssier J, Thimonier J and Chemineau P 2000. Association between expression of reproductive seasonality and alleles of the gene for Mel1areceptor in the ewe. Biology of Reproduction 62, 1096–1101.
R Development Core Team 2007. R: a language and environment for statistical computing. R Foundation for Statistical Computing, Vienna, Austria. http://www.R-project.org
Russel AJF, Doney JM and Gunn RG 1969. Subjective assessment of body fat in live sheep. The Journal of Agricultural Science 72, 451–454.
Terqui M and Thimonier J 1974. Nouvelle me´thode radioimmunologique rapide pour l’estimation du niveau de progeste´rone plasmatique. Application pour le diagnostic pre´coce de gestation chez la brebis et la che`vre. C. R. de l’Acade´mie des sciences, Paris, Se´rie D 279, 1109–1112.
Teyssier J, Canepa S, Chemineau P, Malpaux B, Migaud M and Bodin L 2002. Preliminary results on selection lines for spontaneous spring ovulatory activity in Merinos d’Arles sheep. In Proceedings of the 7th World Congress on Genetics Applied to Livestock Production, vol. 30, pp. 685–688. Institut National de Recherche Agronomique (INRA), Castanet-Tolosan, France.
Teyssier J, Migaud M, Debus N, Maton C, Bouquet PM, Bocquier F, Chemineau P, Malpaux B and Bodin L 2006. Expression of seasonality in the Merinos d’Arles ewe according to the genotype of the melatonin receptor (MT1) gene and the feeding level. In 8th World Congress on Genetics Applied to Livestock Production, CD-ROM comm. 11–14. Sociedade Brasileira de Melhoramento Animal (SBMA), Belo Horizonte, Brazil.
Thimonier J 2000. Progesterone level analysis for the determination of the physio-logical status of female farm animals (in French). Productions Animales 13, 177–183. Trecherel E 2007. Relationship between MT1melatonin receptor polymorphism
and seasonality of reproduction in sheep through genotyping and functional studies (in French). PhD thesis, Tours University France.
Ugarte E, Beltran de Heredia I and Bodin L 2007. Exploring the relationship between the polymorphism of the melatonin receptor gene and the variability of sheep seasonality. 58thAnnual EAAP Meeting, Dublin, Ireland.
Yule GU 1912. On the methods of measuring association between two attributes, (with discussion). Journal of the Royal Statistical Society 75, 579–652.