HAL Id: insu-02080759
https://hal-insu.archives-ouvertes.fr/insu-02080759
Submitted on 27 Mar 2019HAL is a multi-disciplinary open access
archive for the deposit and dissemination of sci-entific research documents, whether they are pub-lished or not. The documents may come from teaching and research institutions in France or abroad, or from public or private research centers.
L’archive ouverte pluridisciplinaire HAL, est destinée au dépôt et à la diffusion de documents scientifiques de niveau recherche, publiés ou non, émanant des établissements d’enseignement et de recherche français ou étrangers, des laboratoires publics ou privés.
metals? The lead example
Mélanie Davranche, Cloé Veclin, Anne-Catherine Pierson-Wickmann, Hind El
Hadri, Bruno Grassl, Laura Rowenczyk, Aline Dia, Alexandra ter Halle,
Florent Blancho, Stephanie Reynaud, et al.
To cite this version:
Mélanie Davranche, Cloé Veclin, Anne-Catherine Pierson-Wickmann, Hind El Hadri, Bruno Grassl, et al.. Are nanoplastics able to bind significant amount of metals? The lead example. Environmental Pollution, Elsevier, 2019, 249, pp.940-948. �10.1016/j.envpol.2019.03.087�. �insu-02080759�
Accepted Manuscript
Are nanoplastics able to bind significant amount of metals? The lead example Mélanie Davranche, Cloé Veclin, Anne-Catherine Pierson-Wickmann, Hind El Hadri, Bruno Grassl, Laura Rowenczyk, Aline Dia, Alexandra Ter Halle, Florent Blancho, Stephanie Reynaud, Julien Gigault
PII: S0269-7491(19)30540-8
DOI: https://doi.org/10.1016/j.envpol.2019.03.087
Reference: ENPO 12359
To appear in: Environmental Pollution
Received Date: 27 January 2019 Revised Date: 19 March 2019 Accepted Date: 21 March 2019
Please cite this article as: Davranche, Mé., Veclin, Cloé., Pierson-Wickmann, A.-C., El Hadri, H., Grassl, B., Rowenczyk, L., Dia, A., Halle, A.T., Blancho, F., Reynaud, S., Gigault, J., Are nanoplastics able to bind significant amount of metals? The lead example, Environmental Pollution (2019), doi: https:// doi.org/10.1016/j.envpol.2019.03.087.
This is a PDF file of an unedited manuscript that has been accepted for publication. As a service to our customers we are providing this early version of the manuscript. The manuscript will undergo copyediting, typesetting, and review of the resulting proof before it is published in its final form. Please note that during the production process errors may be discovered which could affect the content, and all legal disclaimers that apply to the journal pertain.
M
AN
US
CR
IP
T
AC
CE
PT
ED
Pb(II)
+
Pb(II)
Pb(II)
Pb(II)
Pb(II)
Pb(II)
Pb(II)
Pb(II)
Pb(II)
Pb(II)
Pb(II)
Pb(II)
Pb(II)
Pb(II)
Pb(II)
Pb(II)
Pb(II)
Pb(II)
Pb(II)
Pb(II)
Pb(II)
Pb(II)
Pb(II)
Pb(II)
Pb(II)
Pb(II)
Pb(II) :surface bound Pb(II)
Pb(II) : intraparticle diffused Pb(II)
Time
(min
)
0
25
M
AN
US
CR
IP
T
AC
CE
PT
ED
1Are nanoplastics able to bind significant amount of metals?
1The lead example
23
Mélanie Davranche1, Cloé Veclin1, Anne-Catherine Pierson-Wickmann1, Hind El Hadri2, Bruno Grassl2,
4
Laura Rowenczyk3, Aline Dia1, Alexandra Ter Halle3, Florent Blancho1, Stephanie Reynaud2 and
5
Julien Gigault1
6 7
1
Univ. Rennes, CNRS, Géosciences Rennes, UMR 6118, F35000 Rennes, France
8
2
IPREM, UMR 5254, CNRS-Université de Pau et des Pays de l’Adour, F64000 Pau, France
9
3
Laboratoire des Interactions Moléculaires et Réactivité Chimique et Photochimique (IMRCP), UMR
10
CNRS 5623, Université Paul Sabatier-UPS, Batiment 2R1, 3ème étage, 118, route de Narbonne, 31062
11
Toulouse Cedex 09, France
12 13 Corresponding author: 14 Mélanie Davranche 15 E mail: melanie.davranche@univ-rennes1.fr 16 Tel: +33 223 235 769 17 Fax: +33 223 238 787 18 19 Main finding 20
Nanoplastics are able to sorb high amount of Pb(II) through sorption and intraparticle diffusion
21
processes. They could be important vector of metallic pollutant in the environment.
22 23
Highlights 24
25
• Pb(II) binding experiments onto nanoplastics extracted from environmental micro-plastics
26
were performed.
27
• Pb(II) was largely bound onto nanoplastics by specific adsorption and intraparticle diffusion.
28
• Nanoplastics could be significant vectors of metals in the environment
29 30
Abstract 31
The nanoscale size of plastic debris makes them potential efficient vectors of many pollutants
32
and more especially of metals. In order to evaluate this ability, nanoplastics were produced from
33
microplastics collected on a beach exposed to the North Atlantic Gyre. The nanoplastics were
34
characterized using multi-dimensional methods: asymmetrical flow field flow fractionation and
35
dynamic light scattering coupled to several detectors. Lead(II) adsorption kinetics, isotherm and
M
AN
US
CR
IP
T
AC
CE
PT
ED
2edge were then carried out. The sorption reached a steady state after around 200 min. The
37
maximum sorption capacity varied between 97% and 78.5 % for both tested Pb concentrations.
38
Lead(II) adsorption kinetics is controlled by chemical reactions with the nanoplastics surface and to a
39
lesser extent by intraparticle diffusion. Adsorption isotherm modeling using Freundlich model
40
demonstrated that NPG are strong adsorbents equivalent to hydrous ferric oxides such as
41
ferrihydrite (log = 8.36 against 11.76 for NPG and ferrihydrite, respectively). The
42
adsorption is dependent upon pH, in response to the Pb(II) adsorption by the oxygenated binding
43
sites developed on account of the surface UV oxidation under environmental conditions. They could
44
be able to compete with Fe or humic colloids for Pb binding regards to their amount and specific
45
areas. Nanoplastics could therefore be efficient vectors of Pb and probably of many other metals as
46
well in the environment.
47
Keywords. 48
nanoplastics, Pb(II), adsorption, kinetics, DLS, A4F
49 50
Main finding 51
Nanoplastics are able to sorb high amount of Pb(II) through sorption and intraparticle diffusion
52
processes. They could be significant vectors of metallic pollutants in the environment.
53 54
1. Introduction 55
Due to the exceptional properties of plastics materials such as their low density and high
56
durability, the industrial production of plastics has intensely and exponentially grown since 1940s.
57
The reason of their success is explained by their multiples uses (e.g. food packaging, building,
58
transport, agriculture, etc.). However, these properties result also in their exceptional persistence in
59
the environment. Whereas marine pollution by plastics was the most highlighted (low et al., 2010;
60
Eriksen et al., 2014), microplastic contamination of freshwater, urban water, urban dust, flood plain
M
AN
US
CR
IP
T
AC
CE
PT
ED
3soil and atmosphere were also pointed out in several studies (Gaspery et al., 2014; Dris et al. 2016;
62
Dehghani et al., 2017; Scheurer and Bigalke, 2018; Dris et al. 2018).
63
Among plastic contaminants, microplastics have been the most studied (Andrady, 2011; Wright et
64
al., 2013). However, the existence of nanoplastics, was quite recently demonstrated by Ter Halle et
65
al. (2017) and Gigault et al. (2018). They defined nanoplastics as particles unintentionally produced,
66
whose size was varying from 1 to 1000 nm and displaying a colloidal behavior (Gigault et al., 2018).
67
They are produced from the use of manufactured objects but especially from aged-microplastics in
68
response to the photo-, chemical and physical degradation mechanisms that take place under
69
environmental conditions (Bouwmeester et al., 2015; Ter Halle et al., 2017). Their occurrence was
70
demonstrated under laboratory conditions from degradation of plastics items (Lambert and Wagner,
71
2016), environmental microplastics collected in seawater (Gigault et al., 2018) and under
72
environmental conditions in seawater samples (Ter Halle et al., 2017).
73
Nanoplastics display a nanoscale size. They are polydisperse with an open structure and a
74
heterogeneous and asymmetrical shape. They present an inhomogeneous charged surface and they
75
are able to aggregate relative to the environmental physico-chemical conditions (Gigault et al., 2018).
76
All these properties make them formidable potential adsorbents of contaminants and especially of
77
trace metals. However, regards to their extremely recent highlighting, no studies have ever been
78
interested in their ability to bind trace metals and the involved governing mechanisms. Nevertheless,
79
several studies demonstrated that both plastics pellets collected from beaches and micro-plastics
80
recovered from seawater of the North Alantic gyre contain very variable amounts of trace metals
81
(e.g. Holmes et al., 2012; Turner and Holmes, 2015; Vedolin et al., 2018; Prunier et al., 2019). This
82
trace metal loading could result of the use of trace metals as additives in the plastics production and
83
also in sorption processes (Massos and Turner, 2017; Wang et al., 2017; Prunier et al. 2019). Wang et
84
al. (2017) suggested that the majority of metals carried by microplastics were derived from internal
85
load. However, Holmes et al. (2014) compared the sorption capacity of virgin pellets and pellets
86
collected from beaches. They provided evidence that trace metal adsorption was considerably
M
AN
US
CR
IP
T
AC
CE
PT
ED
4greater for the beach-sourced pellets. They attributed these results to the pellets weathering and to
88
the resulting specific adsorption onto charged mineral sites or to non-specific interaction between
89
the hydrophobic surface and the neutral or organic trace metal species. Adsorbed trace metals were
90
both cations and oxyanions. Ashton et al., (2010) suggested also that trace metals may co-precipitate
91
with or be sorbed onto hydrous oxides present onto the microplastic surface. Brennecke et al. (2016)
92
studied the sorption of Cu and Zn from antifouling paint onto virgin polystyrene (PS) pellets and
93
environmental aged polyvinyl chloride (PVC) fragments. They demonstrated that sorption of Cu was
94
higher onto aged PVC than virgin PS in response to the PVC higher surface aera and polarity.
95
In such context, the nano size of the nanoplastics and their exceptional surface properties (charge
96
and asymmetrical shape) make them better vectors of trace metals than pellets and microplastics.
97
Their precise role in trace metal transfer and the involved mechanisms have therefore to be
98
elucidated.
99
For this purpose, we studied the sorption of Pb(II) onto ‘model’ nanoplastics obtained from
100
physical alteration of ‘environmental’ nanoplastics produced by sonication of microplastics collected
101
on a beach exposed to the North Atlantics gyre in Guadeloupe (France). Lead was chosen regards to
102
its high affinity for surface and to its toxicity. We developed an in situ polarography method allowing
103
performing adsorption kinetics, isotherm and pH-sorption edge experiments in a single reactor. The
104
evolution of the nanoplastic size and aggregation were monitored throughout the experiment using
105
dynamic light scattering (DLS).
106
2. Materials and methods 107
All used chemicals were of analytical grade. The solutions were prepared with ultrapure water
108
(Milli-Q system, Millipore). The containers used were (i) trace-metal cleaned with 10% (v/v) HNO3 for
109
24 h at 45°C, (ii) soaked in and then rinsed with ultrapure water for 24 h at 45°C, and (iii) finally dried
110
at 30°C. All solutions were prepared with ultrapure water (18.2 Ω, MilliQ, Millipore). The Pb(II)
111
solutions were prepared using a 1000 mg L-1 standard solution of Pb (NO3)2 (standard Metrohm
M
AN
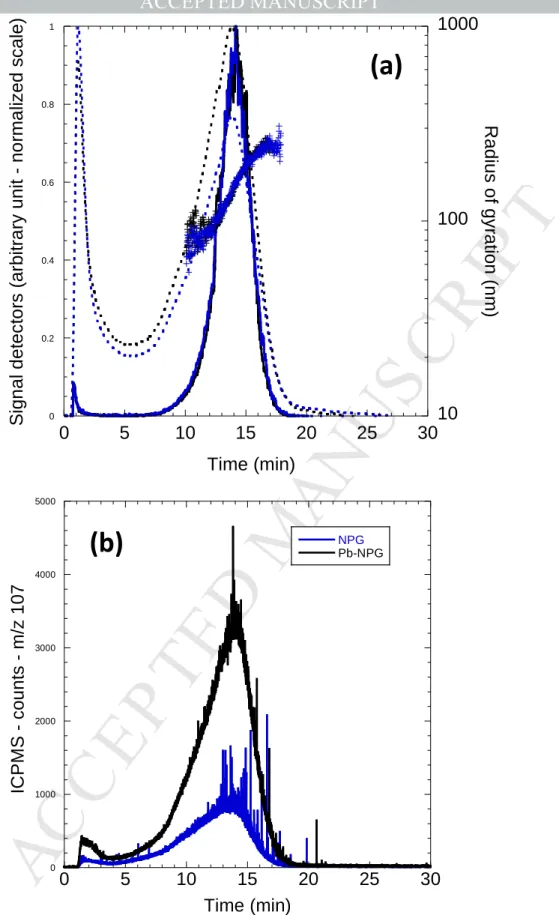
US
CR
IP
T
AC
CE
PT
ED
599.5% ion, VWR Chemicals). The analysis of Pb2+ in solution was carried out by polarography
113
(Metrohm 884 professional voltammetric meter).
114
2.1. Nanoplastics production
115
Environmental nanoplastics were produced by the sonication of 58 g of microplastics (5 mm to 2
116
cm) in 300 mL of ultrapure water. Sonication was performed during 5 days. The suspension was
117
filtrated at 0.8 µm (Sartorius). Microplastics were collected in 2017 on the beach of Baie Sainte-Marie
118
in Guadeloupe (France), which is exposed to the North Atlantic gyre. This sample corresponding to
119
Guadeloupean nanoplastics was called NPG. Microplastics were isolated from the sand by a sea
120
water extraction method relative to their density. Dynamic light scattering (DLS) displayed that both
121
samples were poly-dispersed with an average hydrodynamic diameter 150-450 nm. Zeta-potential
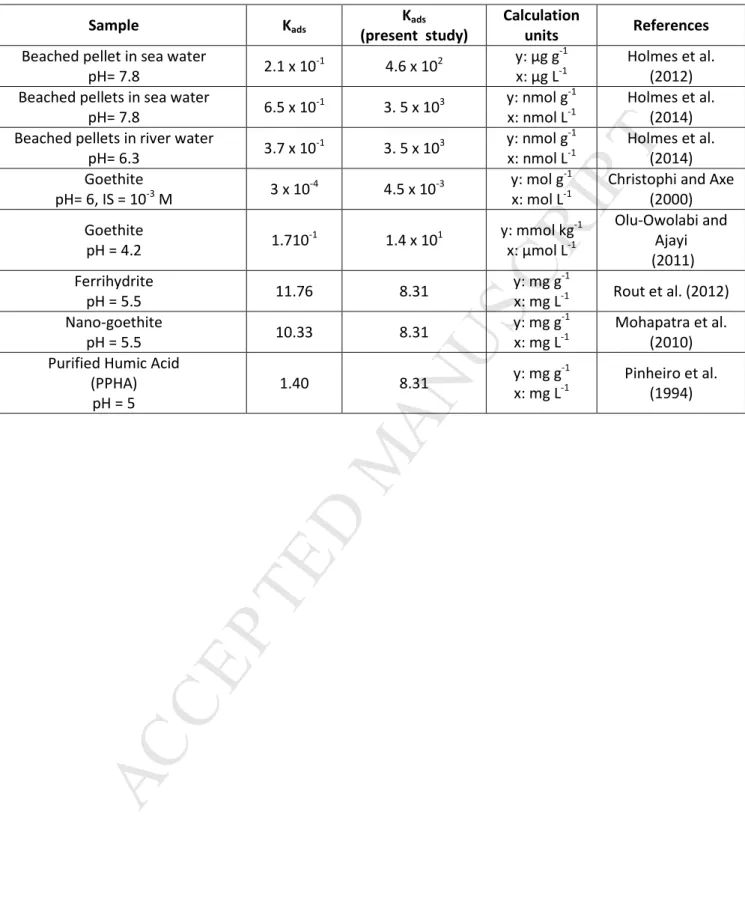
122
analysis demonstrated that they are negatively charged on the 2-to-14 pH range. At pH 6,
zeta-123
potential was equal to -30.2 mV. Their final concentration in the suspension was determined by
124
measuring the dissolved organic carbon (DOC). The NPG sample displayed a DOC concentration of 50
125
mg L-1. Note that it cannot be excluded that a few amount of the measured DOC corresponds to
126
organic matter.
127
2.2. Adsorption experiments
128
Kinetic experiments. Kinetic experiments of Pb(II) adsorption onto NPG were performed in situ, 129
namely directly in a polarographic cell. This in situ methodology avoids any external treatment of the
130
sample, Pb2+ concentration being continuously measured in the cell. Ten ml of the NPG solution were
131
introduced in a polarographic cell. The pH of the NPG suspensions was fixed at 7 using HNO3 and/or
132
NaOH at 0.1 M and their ionic strength was fixed at 10-2 mol L-1 using KCl. Before adding Pb(II), a first
133
polarographic measurement was performed to check (if any) the Pb2+ concentration release by NPG.
134
Then, Pb(II) was added to obtain a concentration of 2 and 6 mg g-1 (g of dissolved organic carbon,
135
DOC). The concentration of Pb2+ in the suspension was measured every 2 min during 5 h.
M
AN
US
CR
IP
T
AC
CE
PT
ED
6Adsorption isotherms. They were carried out in situ directly in a polarographic cell. Ten ml of 137
the NPG solution was introduced in a polarographic cell. The pH of the NPG suspensions was fixed at
138
7 using HNO3 and/or NaOH at 0.1 M. The ionic strength was fixed at 10 -2
mol L-1 using KCl. Before
139
adding Pb(II), a first polarographic measurement was performed to check (if any) the initial Pb2+
140
concentration. Then, Pb(II) was added every 4h (as assessed by the steady state) in order to obtain
141
Pb(II) total concentration of 4, 8, 12, 16, 20 and 24 mg g-1 (g of DOC). The Pb2+ concentration was
142
measured by polarography.
143
pH-adsorption edge experiment. This experiment was carried out in situ directly in a 144
polarographic cell and not as classically performed in distinct batches. Fifteen mL of NPG solution
145
were introduced in a polarographic cell. Its initial pH was fixed at 2 using HNO3 at 0.1 M. The ionic
146
strength was fixed at 10-2 mol L-1 using KCl. Lead(II) was added in order to obtain a concentration of 6
147
mg g-1 (g of DOC). After 4h, the Pb2+ concentration was measured by polarography. Then, every 4 h,
148
the pH was increased using an automatic titrator in SET mode (Titrino 719, Metrohm). The pH was
149
successively fixed at 3, 4, 5, 6 and 9. The Pb2+ concentration was measured at steady state for each
150
pH.
151
2.3. Chemical Analysis
152
Dissolved organic carbon (DOC). DOC concentrations were determined using a Total Carbon 153
Analyzer (Shimadzu TOC-V CSH) by a standard solution of potassium hydrogen phthalate (Sigma
154
Aldrich). The uncertainty of the measurement was 5%.
155
Pb(II) measurement. Pb(II) concentrations were determined as Pb2+ species concentrations
156
using polarography directly in the NPG suspensions. They were determined using a Methrohm
157
polarogaph (Methrom 884 professional ASV) under Anodic Stripping Voltammetry (ASV) mode using
158
a hanging dropping mercury electrode (HDME). The analytical conditions are summarized in Table S1
159
(supplementary file). Deoxygenation of the medium was carried out using a continuous N2 bubbling.
160
The analyses were carried out under stirring at 3000 rpm.
M
AN
US
CR
IP
T
AC
CE
PT
ED
7All experiments being performed directly in a polarographic cell, the metered addition method
162
could not be carried out. A calibration curve was therefore performed for a Pb2+ concentration
163
ranging in between 0 and 400 µg L-1. To evaluate the impact of the NPG presence on the
164
measurement, calibration curve were carried out with and without NPG. Moreover, to avoid any
165
Pb(II) sorption onto NPG and ensure that all the Pb(II) was under Pb2+ species, the pH was fixed at 2.
166
None influence of the NPG presence was observed. The calibration curve realized with NPG at pH 2
167
was therefore used to determine the experimental Pb2+ concentration (supplementary file Fig. S1).
168
The detection limit of the method was 0.05 µg L-1 for Pb.
169
2.4. Nanoplastics size measurement.
170
Dynamic Light Scattering (DLS). DLS was used to determine the size of the nanoplastics both in 171
the initial suspension and during the adsorption experiments. The in situ DLS measurements were
172
performed using a Vasco Flex model of nanoparticle size analyzer (Cordouan Technology, Pessac,
173
France). The probe was placed in front of the polarographic cell and measured directly in the
174
solution. The detection limit of the DLS instrument was investigated with PSL 100 nm standards
175
within the range of 2 × 10⁻⁵ g L−1 to 2 × 10⁻¹ g L−1. Although detection remains possible over the entire
176
concentration range, an average size analysis is only possible over the concentration range of 2 × 10⁻²
177
to 2 × 10⁻⁴ g L−1 using the Pade-Laplace algorithm. Each measurement corresponds to a statistical
178
average of six measurements. In addition, each of the six measurements is composed of six
179
acquisitions of light scattered for 80 s.
180
Asymmetrical Flow Field Flow Fractionation (A4F) coupled to static light scattering (SLS) and 181
inductively coupled plasma-mass spectrometry (ICP-MS). A4F-SLS-ICP-MS was used to fractionate 182
and size sort nanoplastics with metallic composition associated to. The A4F fractionation running
183
conditions are summarized in table S2 (supplementary file).
184
The detection consisted in a static light scattering (SLS, Multi Angle Light Scattering - MALS, Dawn
185
Heleos 2, Wyatt Technology) to characterize the particles size. The incident laser wavelength of the
186
SLS is λ=658nm. A Berry formalism that allows giving the more suitable fit of the light scattered
M
AN
US
CR
IP
T
AC
CE
PT
ED
8according to the angle was used. UV detector was fixed at 254 nm, which corresponds to the
188
absorption peak of the colloidal materials. Finally, an inductively coupled plasma-mass spectrometer
189
(ICP-MS 7700x, Agilent technologies) was directly coupled at the end of the detection chain without
190
using the nebulizer pump. No online quantification was performed. Here ICP-MS was used to localize
191
the Pb(II) on the colloidal size range. The ICP-MS was operated without the collision cell, because of
192
the lack of interferences for the mass isotope of interest (207Pb). The sample and skimmer cones were
193
in nickel. The RF power and the plasma gas flow rate were fixed at 1500 W and 15 L min−1,
194 respectively. 195 3. Results 196 3.1. Adsorption kinetics 197
Lead concentration decreased extremely rapidly (Fig. 1a). After 2 min, the concentration
198
decreased from 2 to 0.43 mg g-1 (78.5 % of binding) and 6 to 0.17 mg g-1 (97.2 % of binding) for both
199
concentrations, respectively. Lead was therefore significantly adsorbed to NPG. The kinetic profile
200
consisted of a rapid adsorption following by a subsequent approach to steady state, which was
201
reached after around 200 min (Fig. 1a).
202
The kinetics was modeled using a order. However, the Lagergreen
pseudo-first-203
order equation was not applicable to our Pb(II)-NPG system, no linearization of the experimental
204
data was obtained. The pseudo-second order was then tested. In this model, the rate-limiting step is
205
the surface adsorption that involves chemisorption. The model is based on the solid phase
206
adsorption capacity (Ho et al. 1996 a-b) and predicts the behavior over the whole range of
207
adsorption (Ahsu et al. 1991). The corresponding equation is:
208
= K Q − Q (eq.1)
209
With Qt, the adsorbed Pb(II) concentration at time t (mg g -1
of DOC), Qe the adsorbed Pb(II)
210
concentration at steady state (mg g-1 of DOC), and K the rate constant of adsorption for the
pseudo-211
second-order (g mg-1 min-1).
212
The integrated equation is:
M
AN
US
CR
IP
T
AC
CE
PT
ED
9=
. t +
". # or=
% ".$ . (eq.2) 214Where h can be considered as the initial sorption rate. When t tends to 0, h = KQ
215
The linearity of the plots, the R2 and the coherence between the theoretical and the
216
experimental Qe indicated that chemical reaction is the main rate-controlling step of the binding
217
process (Fig. 1b and Table 1). The rate constant (K) decreased with the increasing Pb(II) initial
218
concentration as previously observed and discussed by Ho and Ofomaja (2006) and Ho et al. (2006)
219
for Pb(II) adsorption onto palm fiber and peat.
220
Since the pseudo-second-order kinetic model did not allow identifying potential diffusion
221
mechanism, the kinetic results were then analyzed using an intraparticle diffusion model. The
222
following equation was used (El-Ashtoukhy et al., 2008):
223
Q = K'. t(.)+ C (eq. 3)
224
K' is the rate constant of the intraparticle diffusion, whereas C corresponds to the intercept and
225
provides information on the thickness of the boundary layer.
226
The Qt was plotted relative to the √, in Fig. 1c and the kinetics parameters in Table 3. If the
227
intraparticle diffusion model is involved the plot of Qt relative to √, should be linear and if the
228
intraparticle diffusion model is the rate-controlling step, the plot should pass through the origin (C =
229
0). However, if C ≠0, it indicates some degree of boundary layer control. The intraparTcle diffusion
230
model is therefore not the rate-controlling step, but it could operate simultaneously with other
231
processes. The diffusion gradient can be linearized into four regions representing the external mass
232
transfer, and the intraparticle diffusion in the macro, meso and micropore structure of the adsorbent
233
(Allen et al., 1989; Tan et al. 2007; Ho and McKay, 1998). Multilinear lines were obtained for both
234
initial concentrations of Pb(II) (Fig. 1c). Moreover, any of them passed through the origin indicating
235
that the intraparticle diffusion process was not the rate-controlling step. However, the first linearity
236
can be considered as a first step of an instantaneous adsorption or adsorption on the outer surface
237
which was produced during the first 25 min of the sorption and corresponded to 83% and 89 % of
M
AN
US
CR
IP
T
AC
CE
PT
ED
10total bound Pb(II) for 6 and 2 mg g-1 initial concentration, respectively. The second part represented a
239
more slow and progressive part of the adsorption that could be driven by an intraparticle diffusion
240
process that limited the adsorption process and corresponded to 4% and 5 % of total bound Pb(II) for
241
6 and 2 mg g-1 initial concentration, respectively.
242
Therefore, Pb(II) seemed to be rapidly sorbed by a chemisorption processes which was
243
confirmed by the pseudo-second order model parameter, that may be followed by an intraparticle
244
diffusion process lasting up to 25 min.
245
3.2. Adsorption isotherm
246
Experimental data of the adsorption isotherm are reported in Fig. 2. The adsorbed Pb(II)
247
concentration increased with the increasing initial Pb(II) concentration. However, the proportion of
248
adsorbed Pb(II) was higher for the low concentration than for the high concentration, suggesting a
249
progressive saturation of the surface.
250
The isotherm was fitted using the non-linear Langmuir and Freundlich models. Since no linearity
251
was obtained for Langmuir model, Freundlich model was therefore the only model described in this
252
work. The Freundlich isotherm assumes a multilayer sorption onto a heterogeneous surface. The
253
Freundlich isotherm corresponds to:
254
Q = K- . C / (eq. 3)
255
Where Qe is the adsorbed Pb(II) concentration (mg g-1), Kads is the Freundlich adsorption constant, Ce
256
is the concentration of Pb(II) in solution (mg g-1) and n is the non-linearity coefficient.
257
In Fig. 2 were plotted the linearized data. Values for the Freundlich constant and coefficient are
258
derived from the linear regression analysis of the log Qe versus log Ce. The obtained values are n=
259
0.34, Kads = 4.89. The correlation coefficient R² equal to 0.98 indicates that the Freundlich model is
260
suitable to describe the sorption processes between Pb(II) and NPG. The coefficient n, ranging
261
between 0 and 1, is indicative of a cooperative adsorption (here n=0.38).
M
AN
US
CR
IP
T
AC
CE
PT
ED
11These results showed that Pb(II) adsorption onto NPG was expected to be non-linear, namely
263
produced through the formation of multilayer or through the formation of heterogeneous surface
264
complexes. The surface complexes heterogeneity is the result of the variability of the binding sites
265
(carboxylic, phenolic, hydroxyl, etc.) or of the denticity of the complexes (monodentates, bidentate,
266
etc.).
267
3.3. pH adsorption-edge
268
The evolution of the Pb(II) adsorption relative to pH was non-conventionally plotted (Fig. 3).
269
Since the experiments were both in situ and non-sequentially performed, it was not possible to
270
evaluate, as done with the previous experiment, the Pb(II) concentration released by NPG at each
271
pH. We therefore chose to present the evolution of the Pb2+ concentration (Fig. 3).
272
A Pb2+ concentration decrease following the increasing pH is displayed in Fig. 3. Several
273
mechanisms could explain such result and notably the complexation of Pb(II) by the OH- ligand,
274
whose concentration increased with the increasing pH up to the precipitation of Pb(II) as hydroxide
275
at pH > 7. The Pb(II) speciation was calculated through VisualMinteq 3.1 considering the
276
experimental conditions but, without NPG (Fig. 4). To allow a better comparison between the
277
experimental and the modeled data, the Pb(II) concentration was presented in mg g-1 (g of DOC even
278
if no DOC was input in the calculation, namely to convert mol L-1 as mg g-1). Without any NPG, the
279
modeling demonstrated that Pb2+ decreased from pH 6 in response to its complexation as PbOH+ and
280
from pH 7.5 to the precipitation of Pb(OH)2s. By contrast, with NPG, Pb 2+
decreased from pH>2, the
281
largest decrease proceeding from pH 4. These results clearly demonstrated that the Pb2+ decrease
282
was provided in response to the NPG occurrence, namely in response to the Pb2+ adsorption onto
283
NPG.
284
3.4. Size and elemental composition characterization
285 286
DLS analysis was performed on NPG associated to Pb(II) on the studied pH range, concentrations
287
and contact-time(kinetics) (Fig. S2, supplementary file). No significant changes were observed in the
M
AN
US
CR
IP
T
AC
CE
PT
ED
12auto-correlation function (ACF) and in the dzH according to the different conditions. Nevertheless,
289
some difference on the polydispersity could have occurred and could not be identified by DLS. The
290
structural and physical changes of environmental nanoparticles are usually difficult to identify with
291
DLS due to their high polydispersity in size and composition (Gigault et al., 2018). To isolate,
292
fractionate and characterize, free-Pb(II) and Pb(II)-doped NPGs, A4F-SLS-ICPMS was further used (Fig.
293
5). The fractograms displayed a signal with a retention time covering the size range from 50 nm up to
294
400 nm (in diameter) based on A4F calibration (Gigault et al., 2017) (Fig. 5.a). The intensity of the UV
295
signal was slightly higher for Pb(II)-doped NPG than for free-Pb(II) NPG. Such results might be
296
produced in response to the Pb(II) adsorbed onto the NPG surface or to the NPG dispersion in
297
presence of Pb(II). The retention time was not modified indicating no modification of the size
298
distribution range. However, the UV signals showed a large colloidal fraction (from 10kDa to 60kDa)
299
at a retention time tR=2 min. Residues of polymers, additives and organic matter remaining on the
300
microplastics surface, possibly released during the sonication. The SLS analysis validated these
301
observations. They displayed that NPG have a gyration radius ranging from 70 to 250 nm using Berry
302
formalism for both Pb(II)-doped and free-Pb(II) NPG. Angular dependence of the light scattered did
303
not fit using the spherical formalism indicating an indirect shape deviating from the ideal sphere (SI,
304
Fig. S2. The on-line coupling of ICPMS and A4F-UV-SLS allow obtaining the elemental composition
305
associated to the UV and SLS signals (Fig. 5b). The m/z 207 trace, corresponding to Pb(II) increased
306
from tR=5min to tR=17min for Pb(II)-doped NPG (black trace) as compared to free-Pb(II) NPG (blue
307
trace) indicating that Pb(II) was associated to NPG. Noted that for free-Pb(II) NPG, the m/z 207 trace
308
presented some spikes, starting especially at tR=12min, namely at approximately 100 nm size. Such
309
spiked signal corresponds to the signal generally observed with ICP-MS in single particle mode. When
310
a significant amount is localized in a nanometer resolved surface, the quantity of ionized metal is
311
significantly higher, which corresponds to either metal nanoparticles trapped inside colloids or metal
312
accumulation within a cavity of a porous material. Nevertheless, for the Pb(II)-doped NPG, the spiked
M
AN
US
CR
IP
T
AC
CE
PT
ED
13signal was attenuated suggesting either, a Pb(II) surface adsorption or ,that the equilibrium time was
314
long enough to allow a significant Pb(II) accumulation in the porosity.
315
4. Discussion 316
4.1. NPG is a significant Pb(II) adsorbent
317
Adsorption kinetic experiments displayed that 78.5 and 97 % of Pb(II) were sorbed onto the
318
nanoplastics at pH 7. These proportions are high and suggest that nanoplastics are strong Pb(II)
319
adsorbent. The Freundlich Kads defined for Pb(II)-NPG in the present study was compared to the
320
Freundlich Kads of various adsorbents. For the comparison, it was necessary to recalculate our
321
constants using the same calculation units than those of the literature. They are reported in Table 2.
322
Since in the literature, no data exist for the Pb(II) binding to nanoplastics, our results were therefore
323
compared to those obtained for plastics pellets collected on beaches on which Pb(II) was
324
experimentally adsorbed using sea and river water samples (Holmes et al., 2012; 2014). Note that the
325
beached pellets are micrometric and that they were submitted to sonication during 5 min before
326
being used. Although pH values were close to each other, the present Freundlich Kads is 3 to 4 order
327
of magnitude higher than those of beached pellets (Table 2). The environmental nanoplastics (NPG)
328
are therefore stronger Pb(II) adsorbent than environmental micrometrics plastics. Note however,
329
that the sonication step submitted to the beached pellets could have released many nanometric
330
parts decreasing thus their binding capacity. Regards to these results, the present Freundlich Kads was
331
compared to the Kads calculated for Pb(II) binding to minerals known to be strong metals adsorbents,
332
namely the Fe oxyhydroxides. First, Kads was compared to those calculated for Pb(II)-goethite
333
sorption. Goethite is a well-crystallized Fe oxyhydroxides with a low specific surface around 45 g m-2.
334
The present Freundlich Kads was 1 or 2 orders of magnitude higher than those of goethite (Table 2).
335
However, the binding experiments of Pb(II) to goethite were performed at lower pH. The metal
336
sorption onto Fe oxyhydroxides being strongly dependent to pH, the difference noted in between the
337
Freundlich Kads could be involved by this pH difference, see notably the Olu-Owolabi and Ajayi (2011)
M
AN
US
CR
IP
T
AC
CE
PT
ED
14study where pH was 4.2. By contrast, Freundlich Kads of Pb(II)-ferrihydrite sorption is in the same
339
order of magnitude than the present Kads. Ferrihydrite is a Fe oxyhydroxide with a high specific
340
surface varying between 250 to 600 g m-2 and is considered to be the strongest metal sorbent
341
amongst various particulate Fe oxyhydroxides. The similarity of the ferrihydrite and the present
342
Freundlich Kads therefore suggests that NPG are strong adsorbent of Pb(II). Finally, the Freundlich Kads
343
was compared to that obtained for nano-goethite, to eventually identify the role of the nano-size on
344
the sorption. Both Freundlich Kads are in the same order of magnitude although they were highly
345
different for particulate goethite. Finally, our data were compared to that obtained for a purified
346
humic acid (PPHA). The Freundlich Kads wascalculated from data extracted from the Pb-humic acid
347
data compilation performed by Milne et al., (2001). Freundlich isotherm was not able to model
Pb-348
humic acid binding data except that of Pinheiro et al. (1994), the Langmuir isotherm providing better
349
modeling. Regarding the pH conditions, we can consider that both Freundlich Kads are in the same
350
order of magnitude.
351
All these comparisons demonstrated that NPG are strong adsorbent of Pb(II), much stronger
352
than beached micrometric plastics pellets. Their sorption capacity seems to be similar to strong metal
353
sorbent such as ferrihydrite, nano-goethite and humic acid. Their sorption properties can thus be
354
attributed to their nano-size and subsequent high specific surface area such as those of ferrihydrite,
355
nano-goethite and humic acid.
356
4.2. Mechanisms involved in Pb(II) adsorption
357
We demonstrated that NPG is a strong adsorbent of Pb(II). Let us go further to elucidate which
358
are the mechanisms involved in the Pb(II) binding to NPG.
359
The first interesting results are provided by the adsorption kinetic study. The kinetic rate could
360
not be modeled using the pseudo first-order model demonstrating that the adsorption kinetics was
361
not controlled by the diffusion. By contrast, the pseudo-second order model allowed with success to
362
model the kinetic data, indicating that the major rate limiting step was the surface adsorption
363
involved by chemical interactions in between Pb(II) and NPG. Although this process dominates the
M
AN
US
CR
IP
T
AC
CE
PT
ED
15adsorption, intraparticle diffusion seems also to partly control the mechanism of Pb(II) adsorption
365
onto NPG.
366
Lead(II) sorption onto NPG was strongly dependent to pH as shown by the pH-adsorption-edge
367
experiment (Fig. 3). With the increasing pH, the surface electronegativity increased in response to
368
the surface functional groups deprotonation. In such conditions, Pb(II) affinity for the surface
369
increased, Pb(II) being able to be bound through electrostatic interactions (outer sphere complex)
370
and/or covalent binding (inner sphere complex). The formation of inner spheres supposes the
371
presence of surface sites able to exchange electron such as, hydroxyl, carboxylic and phenolic
372
functional sites. Figure 3 shows that Pb2+ concentration strongly decreased from pH > 4 (i.e. Pb(II)
373
adsorption strongly increased). This pH corresponds to pH from which carboxylic groups generally
374
become significantly deprotonated (pKa R-COOH≈ 4.8). If no data are available for nanoplastics, several
375
studies showed that plastics debris collected on beach or seawater displayed a higher oxidation state
376
than the reference sample (Ter Halle et al., 2017). Fourier Transform Infra-red Spectroscopy (FTIR) of
377
weathered plastics showed that oxygenated moieties such as, aldehydes, ketones, alcohol,
378
hydroperoxides and carboxylic acids groups increase in the plastics with the duration exposure
379
(Andrady, 2017). The increase of the oxygen moieties and oxygenated function is involved by the UV
380
irradiations weathering. The modeling of the adsorption isotherm data with the Freundlich model
381
demonstrated that the adsorption was not only favorable but, heterogeneous in response to either a
382
multilayer sorption or the formation of heterogeneous surface complexes (surface sites and complex
383
denticity heterogeneity). Since Pb(II) is a transition metal whose potential to form covalent binding is
384
high, the multilayer binding is therefore unlikely. However, regarding the oxidation state of the NPG
385
surface, the formation of heterogeneous complexes with various sites such as, carboxylic, hydroxyl or
386
phenolic sites is more than expected. Note, however, that Pb(II) sorption onto NPG surface does not
387
affect the aggregation/dispersion of the NPG, since no difference in their size and Rg variation was
388
observed with or without Pb(II).
M
AN
US
CR
IP
T
AC
CE
PT
ED
16As previously explained, fractograms of free Pb(II) and Pb(II)-doped NPG obtained with
A4F-390
ICPMS, exhibited spikes in the Rg range over 100 nm. Passing 100 nm in Rg, the frequency of
high-391
intensity spikes increases. Nevertheless, the present A4F-ICPMS set up is not optimized to
392
characterize nanoparticle size using the single particle-ICPMS mode (Schwertfeger et al., 2016;
393
Bustos and Winchester, 2016). Dwell and settling times are not indeed sufficient to obtain a robust
394
correlation between the intensity of the spike and the exact size distribution. These spikes and
395
single-particle event in the fractograms could be explained by the absorption and accumulation of
396
Pb(II) in the NPG structure/porosity, confirming the intraparticle diffusion of Pb(II). Note that the
397
Pb(II) occurring in the porosity and in the residual structure of the free-Pb(II) NPG are strongly
398
trapped since very fewly released at acidic pH as shown by the polarographic measurements. The
399
number and intensity of spikes was higher for free-Pb(II) than for Pb(II)-doped NPG in response to
400
the Pb(II) adsorption in high proportion onto the NPG surface that partly hid the spike signal. Such
401
result confirms the large surface adsorption of Pb(II) to NPG as previously evidenced by experimental
402
data and modeling.
403
All this results demonstrated that Pb(II) is adsorbed on the NPG in high amount through its
404
binding as surface complexes with the oxygenated binding sites produced by the UV irradiation
405
under environmental conditions. This major process is, however, coupled to a physical
406
trapping/concentration of Pb(II) in the structure/porosity of the largest NPG in response to an
407
intraparticle diffusion mechanism.
408
4.3. Is this sorption mechanism environmentally significant?
409
The present results clearly demonstrate that nanoplastics have strong affinity for metals. The
410
question becomes then to identify whether this affinity could impact significantly the metal
411
environmental fate. The answer depends on two major parameters: (i) the nanoplastics
412
environmental amount and (ii) their ability to compete with the other significant metal ligands such
413
as, Fe(III) nano-oxides and/or organic matter.
M
AN
US
CR
IP
T
AC
CE
PT
ED
17No thorough quantitative information exists on the true amount of nanoplastics occurring in the
415
environment. However, hypotheses regarding their presence within environment allow some
416
estimations to be performed as follows. Although across the oceans, the total mass of microplastics
417
was estimated, using circulation models, to vary in between 9.3 to 23.6 103 tons, only 1% of this
418
estimated amount is actually found in the ocean (Jambeck et al., 2015). Several authors suggested
419
that this difference could be explained by the alteration of the micro-plastics as nanoplastics in
420
response to the ultraviolet radiation, physical wave forces and hydrolysis in ocean (Andrady et al.,
421
2011; Gigault et al., 2016; Ter Halle et al. 2017). If nanoplastics would be equally distributed in the
422
whole ocean water (liquid water), their hypothetic concentration would vary from 7 to 18 pg L-1,
423
which is rather low. However, accumulation zones of microplastics have been identified in several
424
regions such as, Artic water or oceanic gyres where microplastics can exceed 6x10⁵ pieces km-2,
425
which represent for the average depth of oceans 2.3 x10¹⁸ pieces L-1 (Law et al., 2010; Bergman et
426
al., 2016, Peeken et al. 2018). Considering that these microplastics represent 1% of the plastics
427
present in ocean, the nanoplastics amount in such samples can potentially reach 2.3 1020 piecesL-1
428
which is rather high. In soils, the quantitative occurrence of microplastics and nanoplastics are
429
considered as scarce and inexistant, respectively (Rillig et al., 2012). However, the plastic particle
430
loading in agroecosystems should be high due to inputs of both recycled organic wastes and plastic
431
film mulching (Ng et al., 2018). Therefore, in some specific worldwide microplastic accumulation
432
areas, nanoplastics concentrations could be significant making them alternative actors to be
433
considered in the metal cycles and accumulation.
434
Concerning their ability to compete with strong soluble or solid ligands for metal binding a first
435
answer can be found in Table 1. The Freundlich Kads compilation indeed demonstrates that for
436
equivalent mass, the Freundlich Kads being in the same order of magnitude, nanoplastics could be
437
potential competitors for Fe nano-oxides and humic substances. However, this competition will
438
depend on the specific area and the binding sites density between the competitive ligands and the
439
nanoplastics. Finally, the key points to be considered before starting regarding such competition are
M
AN
US
CR
IP
T
AC
CE
PT
ED
18the interactions that could be performed between these ligands and the nanoplastics (aggregation,
441
coating, repulsion, etc.). These interactions could, indeed, increase the potential of nanoplastics to
442
bind metals (through additive effects) or by contrast limit their sorption capacities by recovering their
443
surface limiting as a consequence their binding sites availability.
444
5. Conclusion 445
Nanoplastics, recently identified and characterized, are emerging pollutants. Their size makes
446
them potential vectors of other pollutants such as metals. This study provided evidence that
447
nanoplastics, formed in natural conditions under which they are mechanically degraded and
448
especially oxidized by UV irradiations, are able to adsorb Pb(II). Lead(II) adsorption seems to be
449
controlled by chemical and physical interactions with NPG. Adsorption is strongly dependent to pH.
450
A large increase in the adsorption was evidenced for pH > 4 that corresponds to the carboxylic sites
451
deprotonation. This observation suggests that Pb(II) could be bound to the surface oxygenated
452
binding sites through inner sphere complexes, which result in an heterogeneous adsorption process.
453
To a lesser extent, sorption seems to depend on a Pb(II) intraparticle diffusion as evidenced by
454
modeling and analytical results.
455
The sorption capacity of nanoplastics are high, with Pb(II) Freundlich binding constants close to
456
those of ferrihydrite, nano-goethite and humic acid, known to be strong adsorbents of metals. If no
457
evidence were provided that microplastics are able to load high amount of metals, by contrast the
458
present study demonstrated that the nanometric size and surface properties of nanoplastics
459
produced under environmental conditions, can allow nanoplastics to be efficient vectors of Pb(II) and
460
probably of many other metals. Moreover, both modalities of Pb binding to NPG raise the question
461
of the subsequent bioavailability of the bound metals. Are adsorbed Pb(II) more available than
462
porosity trapped Pb(II) or inversely?
463 464
Acknowledgements 465
M
AN
US
CR
IP
T
AC
CE
PT
ED
19This work was supported by the ANR PRC program through the PEPSEA project coordinated by Julien
466 Gigault. 467 468 References 469
Aksu, Z., 2001. Equilibrium and kinetic modelling of cadmium(II) biosorption by C. vulgaris in a batch system: 470
effect of temperature, Separation and Purification Technology, 21, 285-294. 471
Allen, S.J., Mckay, G., Khader, K.Y.H., 1989. Intraparticle diffusion of a basic dye during adsorption onto 472
sphagnum peat. Environ. Pollut., 56(1), 39-50 473
Andrady, A.L., 2017. The plastic in microplastics: a review. Mar. Pollut. Bull., 119(1), 12-22. 474
Ashton, K., Holmes, L., Turner, A., 2010. Association of metals with plastic production pellets in the marine 475
environment. Mar. Pollut. Bull., 60(11), 2050-2055. 476
Bergmann, M., Sandhop, N., Schewe, I., D’Hert, D. 2016. Observations of floating anthropogenic litter in the 477
Barents Sea and Fram Strait, Arctic. Polar biol., 39, 553-560. 478
Bouwmeester, H., Hollman, P. C., Peters, R. J., 2015. Potential health impact of environmentally released micro-479
and nanoplastics in the human food production chain: experiences from nanotoxicology. Environ. Sci technol., 480
49(15), 8932-8947. 481
Brennecke, D., Duarte, B., Paiva, F., Caçador, I., Canning-Clode, J., 2016. Microplastics as vector for heavy metal 482
contamination from the marine environment. Estuar. Coast. Shelf Sci., 178, 189-195. 483
Bustos, A.R.M., Winchester, M.R., 2016. Single-particle-ICP-MS advances. 5051-5052 484
Christophi, C A., Axe, L., 2000. Competition of Cd, Cu, and Pb adsorption on goethite. J. Environ. Eng., 126(1), 485
66-74. 486
Dehghani, S., Moore, F., Akhbarizadeh, R., 2017. Microplastic pollution in deposited urban dust, Teheran 487
metropolis, Iran. Environ. Sci. Pollut. Res., 24(25), 20360-20371. 488
Dris, R., Gasperi, J., Saad, M., Mirande, C., Tassin, B., 2016. Synthetic fibers in atmospheric fallout: a source of 489
microplastics in the environment? Mar. Pollut. Bull., 104(1-2), 290-293. 490
Dris, R., Imhof, H.K., Löder, M.G., Gasperi, J., Laforsch, C., Tassin, B., 2018. Microplastic Contamination in 491
Freshwater Systems: Methodological Challenges, Occurrence and Sources. In Microplastic Contamination in 492
Aquatic Environments (pp. 51-93). 493
El-Ashtoukhy, E.S., Amin, N.K., Abdelwahab, O., 2008. Removal of lead (II) and copper (II) from aqueous 494
solution using pomegranate peel as a new adsorbent. Desalination, 223(1-3), 162-173. 495
Eriksen, M., Lebreton, L.C., Carson, H.S., Thiel, M., Moore, C.J., Borerro, J.C., Galgani, F.,Gasperi, J., Dris, R., 496
Bonin, T., Rocher, V., Tassin, B., 2014. Assessment of floating plastic debris in surface water along the Seine 497
River. Environ. Pollut., 195, 163-166. 498
Gigault, J., El Hadri, H., Reynaud, S., Deniau, E., Grassl, B., 2017. Asymmetrical flow field flow fractionation 499
methods to characterize subjulienmicron particles: application to carbon-based aggregates and nanoplastics. 500
Anal. Bioanal. Chem., 409(29), 6761-6769. 501
Gigault, J., Pedrono, B., Maxit, B., Ter Halle, A. 2016. Marine plastic litter: the unanalyzed nano-fraction. 502
Environ. Sci. Nano, 3, 346-350. 503
Gigault, J., Ter Halle, A., Baudrimont, M., Pascal, P.Y., Gauffre, Phi, T. L., El Hadri, H., Grassl, B., Reynaud S., 504
2018. Current opinion: What is a nanoplastic? Environ. Pollut., 235, 1030-1034. 505
Ho Y.S., Wase D.A.J., Forster C.F., 1996b. Kinetic studies of competitive heavy metal adsorption by sphagnum 506
moss peat, Environ. Sci. Technol.. 17, 71–77. 507
M
AN
US
CR
IP
T
AC
CE
PT
ED
20Ho, Y.S., McKay, G., 1998. Kinetic models for the sorption of dye from aqueous solution by wood. Pro. Safe. 508
Environ. Protect., 76(2), 183-191. 509
Ho, Y.S., Wase, D.A.J., Forster, C.F., 1996a. Removal of lead ions from aqueous solution using sphagnum moss 510
peat as adsorbent. WATER SA-PRETORIA-, 22, 219-224. 511
Holmes, L.A., Turner, A., Thompson, R.C., 2012. Adsorption of trace metals to plastic resin pellets in the marine 512
environment. Environ.l Pollut., 160, 42-48. 513
Holmes, L.A., Turner, A., Thompson, R.C., 2014. Interactions between trace metals and plastic production 514
pellets under estuarine conditions. Mar. Chem., 167, 25-32. 515
Jambeck, J. R., Geyer, R., Wilcox, C., Siegler, T. R., Perryman, M., Andrady, A., Narayan R, Law, K. L. 2015. Plastic 516
waste inputs from land into the ocean. Science, 347, 768-771. 517
Law, K. L., Morét-Ferguson, S., Maximenko, N. A., Proskurowski, G., Peacock, E. E., Hafner, J., & Reddy, C. M. 518
(2010). Plastic accumulation in the North Atlantic subtropical gyre. Science, 329(5996), 1185-1188. 519
Massos, A., Turner, A., 2017. Cadmium, lead and bromine in beached microplastics. Environ. Pollut., 227, 139-520
145. 521
Milne, C. J., Kinniburgh, D. G., Van Riemsdijk, W. H., Tipping, E. 2003. Generic NICA− Donnan model parameters 522
for metal-ion binding by humic substances. Environ. Sci. Technol., 37, 958-971. 523
Mohapatra, M., Mohapatra, L., Singh, P., Anand, S., Mishra, B.K., 2010. A comparative study on Pb (II), Cd (II), 524
Cu (II), Co (II) adsorption from single and binary aqueous solutions on additive assisted nano-structured 525
goethite. Inter. J. Eng. Sci. Technol., 2, 89-103. 526
Ng, E. L., Lwanga, E. H., Eldridge, S. M., Johnston, P., Hu, H. W., Geissen, V., Chen, D. 2018. An overview of 527
microplastic and nanoplastic pollution in agroecosystems. Sci. Tot. Environ., 627, 1377-1388. 528
Olu-Owolabi, B.I., Ajayi, S.O., 2011. Adsorption thermodynamics of cations onto goethite and goethite-humic 529
acid complex. J. Chem. Mat. Sci., 1, 14-24. 530
Peeken, I., Primpke, S., Beyer, B., Gütermann, J., Katlein, C., Krumpen, Bergmann, M., Hehemann, L., Gerdts, G. 531
2018. Arctic sea ice is an important temporal sink and means of transport for microplastic. Nature Com., 9, 532
1505. 533
Pinheiro, J. P., Mota, A. M., Goncalves, M. S. 1994. Complexation study of humic acids with cadmium (II) and 534
lead (II). Analytica Chimica Acta, 284, 525-537. 535
Prunier, J., Maurice, L., Perez, E., Gigault, J., Pierson-Wickmann, A.C., Davranche, M., Ter Halle, A., 2019. Trace 536
metals in polyethylene debris from the North Atlantic subtropical gyre. Environ. Pollut., 245, 371-379. 537
Rillig, M. C. 2012. Microplastic in Terrestrial Ecosystems and the Soil? Environ. Sci. Technol., 46, 6453-6454. 538
Rout, K., Mohapatra, M., Anand, S., 2012. 2-Line ferrihydrite: synthesis, characterization and its adsorption 539
behaviour for removal of Pb (II), Cd (II), Cu (II) and Zn (II) from aqueous solutions. Dalton Transac., 41(11), 3302-540
3312. 541
Ryan, P.G., Reisser, J., 2014. Plastic pollution in the world's oceans: more than 5 trillion plastic pieces weighing 542
over 250,000 tons afloat at sea. PloS one, 9(12), e111913. 543
Scheurer, M., Bigalke, M., 2018. Microplastics in Swiss floodplain soils. Environ. Sci. Technol. , 52(6), 3591-544
3598. 545
Schwertfeger, D.M., Velicogna, J.R., Jesmer, A. H., Scroggins, R.P., Princz, J.I., 2016. Single particle-inductively 546
coupled plasma mass spectroscopy analysis of metallic nanoparticles in environmental samples with large 547
dissolved analyte fractions. Anal. Chem., 88(20), 9908-9914. 548
Tan, I.A.W., Hameed, B.H., Ahmad, A. L., 2007. Equilibrium and kinetic studies on basic dye adsorption by oil 549
palm fibre activated carbon. Chem. Eng. J., 127(1-3), 111-119. 550
Ter Halle, A., Jeanneau, L., Martignac, M., Jardé, E., Pedrono, B., Brach, L., Gigault, J., 2017. Nanoplastic in the 551
North Atlantic subtropical gyre. Environ. Sci. Technol., 51(23), 13689-13697. 552
Vedolin, M.C., Teophilo, C.Y.S., Turra, A., Figueira, R.C.L., 2018. Spatial variability in the concentrations of 553
metals in beached microplastics. Mar. Pollut. Bull., 129(2), 487-493. 554
M
AN
US
CR
IP
T
AC
CE
PT
ED
21Wang, J., Peng, J., Tan, Z., Gao, Y., Zhan, Z., Chen, Q., Cai, L., 2017. Microplastics in the surface sediments from 555
the Beijiang River littoral zone: composition, abundance, surface textures and interaction with heavy metals. 556
Chemosphere, 171, 248-258. 557
Wright, S.L., Thompson, R.C., Galloway, T.S., 2013. The physical impacts of microplastics on marine organisms: 558
a review. Environ. Pollut., 178, 483-492. 559
M
AN
US
CR
IP
T
AC
CE
PT
ED
Table 1: Kinetic parameters calculated using the pseudo second order model and the intraparticle diffusion
model for the kinetic adsorption experiment at [Pb(II)] = 2 mg g-1 and [Pb(II)] = 6 mg g-1.
Kinetic parameters Kinetic experiment at [Pb(II)] = 2 mg g-1
Kinetic experiment at [Pb(II)] = 6 mg g-1
Pseudo-second order model Qe theorical (mg g -1 ) 1.89 5.44 K (g mg-1 min-1) 0.24 0.072 h (mg g-1 min-1) 0.88 2.14 R2 1 0.999 Qe experimental (mg g -1 ) 1.89 5.46 Intra-particle diffusion Ki1 (mg g -1 min-1/2) 0.07 0.16 C1 (g mg -1 min-1) 1.5 4.2 R21(mg g-1 min-1) 0.98 0.98 Ki2 (mg g -1 min-1/2) 0.008 0.023 C2 (g mg-1 min-1) 1.76 5.06 R22(mg g -1 min-1) 0.87 0.78
M
AN
US
CR
IP
T
AC
CE
PT
ED
Table 2: Comparison of the present calculated Freundlich Kads and the Freundlich Kads of Pb(II) binding to
various adsorbents. Sample Kads Kads (present study) Calculation units References
Beached pellet in sea water
pH= 7.8 2.1 x 10 -1 4.6 x 10² y: µg g -1 x: µg L-1 Holmes et al. (2012) Beached pellets in sea water
pH= 7.8 6.5 x 10 -1 3. 5 x 10³ y: nmol g -1 x: nmol L-1 Holmes et al. (2014) Beached pellets in river water
pH= 6.3 3.7 x 10 -1 3. 5 x 10³ y: nmol g -1 x: nmol L-1 Holmes et al. (2014) Goethite pH= 6, IS = 10-3 M 3 x 10 -4 4.5 x 10⁻³ y: mol g -1 x: mol L-1
Christophi and Axe (2000) Goethite pH = 4.2 1.710 -1 1.4 x 101 y: mmol kg -1 x: µmol L-1 Olu-Owolabi and Ajayi (2011) Ferrihydrite pH = 5.5 11.76 8.31 y: mg g-1 x: mg L-1 Rout et al. (2012) Nano-goethite pH = 5.5 10.33 8.31 y: mg g-1 x: mg L-1 Mohapatra et al. (2010) Purified Humic Acid
(PPHA) pH = 5 1.40 8.31 y: mg g -1 x: mg L-1 Pinheiro et al. (1994)
M
AN
US
CR
IP
T
AC
CE
PT
ED
ACCEPTED MANUSCRIPT
Figure 1: a) Time-dependent Pb(II) sorption onto NPG for b) Pseudo second order kinetics modelling,
c)Intraparticle diffusion kinetic model for [Pb(II)]initial=0.3 mg L
-1
and [Pb(II)]initial=0.1 mg L
-1
, corresponding to red and green symbols, respectively
0 1 2 3 4 5 6 7 0 50 100 150 200 250 300 [P b 2 +] m g .g -1 Time (min) [Pb]= 2 mg g-1 [Pb]= 6 mg g-1 y = 0.5269x + 1.1298 R² = 1 y = 0.1829x + 0.4651 R² = 0.9998 0 100 200 0 50 100 150 200 250 300 t/ Qt Time (min) [Pb]= 2 mg g-1 [Pb]= 6 mg g-1 y = 0.1621x + 4.2114 R² = 0.9854 y = 0.023x + 5.0633 R² = 0.7826 y = 0.008x + 1.7619 R² = 0.8692 y = 0.0678x + 1.4669 R² = 0.975 1 2 3 4 5 6 0 5 10 15 20 Qt (m g g -1) √t
b)
c)
M
AN
US
CR
IP
T
AC
CE
PT
ED
Figure 2: Adsorption isotherm of Pb(II) onto NPG at pH 7: a) experimental and modeled data and b) linearization of the experimental data using the Freundlich model.
M
AN
US
CR
IP
T
AC
CE
PT
ED
Figure 3: Evolution of the Pb2+ concentration relative to pH in presence of NPG at 50 mg g-1.
0
2
4
6
8
10
0
2
4
6
8
10
[P
b
2 +]
(m
g
g
-1)
pH
M
AN
US
CR
IP
T
AC
CE
PT
ED
Figure 4: Pb(II) speciation under pH-adsorption-edge experimental condition but without NPG: a) corresponds
to the Pb2+ speciation in solution and b) the evolution of the saturation index of Pb(OH)2s, the unique species
that was identified to precipitate. 0 2 4 6 8 10 2 4 6 8 10 [P b ] (m g g -1) pH Pb+2 Pb(OH)2 (aq) Pb(OH)3-PbOH+ -10 -8 -6 -4 -2 0 2 4 2 4 6 8 10 sa tu ra ti o n i n d e x pH Pb(OH)2(s)
M
AN
US
CR
IP
T
AC
CE
PT
ED
Figure 5: A4F fractograms of free Pb(II) and Pb(II)-doped NPG (a) the UV and SLS detection with the Rg variation
(blue cross), (b) the ICP-MS detection with m/z 207(Pb(II)).
0 0.2 0.4 0.6 0.8 1
![Table 1: Kinetic parameters calculated using the pseudo second order model and the intraparticle diffusion model for the kinetic adsorption experiment at [Pb(II)] = 2 mg g -1 and [Pb(II)] = 6 mg g -1 .](https://thumb-eu.123doks.com/thumbv2/123doknet/13725737.435840/25.892.144.798.154.1074/kinetic-parameters-calculated-intraparticle-diffusion-kinetic-adsorption-experiment.webp)
![Figure 1: a) Time-dependent Pb(II) sorption onto NPG for b) Pseudo second order kinetics modelling, c)Intraparticle diffusion kinetic model for [Pb(II)] initial =0.3 mg L -1 and [Pb(II)] initial =0.1 mg L -1 , corresponding to](https://thumb-eu.123doks.com/thumbv2/123doknet/13725737.435840/27.892.206.751.51.1008/figure-dependent-sorption-kinetics-modelling-intraparticle-diffusion-corresponding.webp)