HAL Id: halshs-02153473
https://halshs.archives-ouvertes.fr/halshs-02153473
Submitted on 12 Apr 2021HAL is a multi-disciplinary open access archive for the deposit and dissemination of sci-entific research documents, whether they are pub-lished or not. The documents may come from teaching and research institutions in France or abroad, or from public or private research centers.
L’archive ouverte pluridisciplinaire HAL, est destinée au dépôt et à la diffusion de documents scientifiques de niveau recherche, publiés ou non, émanant des établissements d’enseignement et de recherche français ou étrangers, des laboratoires publics ou privés.
J. Ringard, Bastien Dieppois, Sandra Rome, A. Diedhiou, T. Pellarin, A.
Konare, A. Diawara, D. Konaté, B. Dje, G.L. Katiellou, et al.
To cite this version:
J. Ringard, Bastien Dieppois, Sandra Rome, A. Diedhiou, T. Pellarin, et al.. The intensification of thermal extremes in west Africa. Global and Planetary Change, Elsevier, 2016, 139, pp.66-77. �10.1016/j.gloplacha.2015.12.009�. �halshs-02153473�
The intensification of thermal extremes
in west Africa
Ringard, J. , Dieppois, B. , Rome, S. , Diedhiou, A. , Pellarin, T. ,
Konaré, A. , Diawara, A. , Konaté, D. , Dje, B.K. , Katiellou, G.L. ,
Seidou Sanda, I. , Hassane, B. , Vischel, T. , Garuma, G.F. ,
Mengistu, G. , Camara, M. , Diongue, A. , Gaye, A.T. and
Descroix, L.
Author post-print (accepted) deposited by Coventry University’s Repository Original citation & hyperlink:
Ringard, J. , Dieppois, B. , Rome, S. , Diedhiou, A. , Pellarin, T. , Konaré, A. , Diawara, A. , Konaté, D. , Dje, B.K. , Katiellou, G.L. , Seidou Sanda, I. , Hassane, B. , Vischel, T. , Garuma, G.F. , Mengistu, G. , Camara, M. , Diongue, A. , Gaye, A.T. and Descroix, L. (2015) The
intensification of thermal extremes in west Africa. Global and Planetary Change, volume 39 : 66-77
http://dx.doi.org/10.1016/j.gloplacha.2015.12.009
DOI 10.1016/j.gloplacha.2015.12.009 ISSN 0921-8181
Publisher: Elsevier
NOTICE: this is the author’s version of a work that was accepted for publication in Global and Planetary Change. Changes resulting from the publishing process, such as peer review, editing, corrections, structural formatting, and other quality control mechanisms may not be reflected in this document. Changes may have been made to this work since it was submitted for publication. A definitive version was subsequently published in Global and Planetary Change, [VOL 39, (2015)] DOI: 10.1016/j.gloplacha.2015.12.009
© 2015, Elsevier. Licensed under the Creative Commons Attribution-NonCommercial-NoDerivatives 4.0 International
http://creativecommons.org/licenses/by-nc-nd/4.0/
Copyright © and Moral Rights are retained by the author(s) and/ or other copyright owners. A copy can be downloaded for personal non-commercial research or study, without prior permission or charge. This item cannot be reproduced or quoted extensively from without first obtaining permission in writing from the copyright holder(s). The content must not be changed in any way or sold commercially in any format or medium without the formal permission of the copyright holders.
the peer-review process. Some differences between the published version and this version may remain and you are advised to consult the published version if you wish to cite from it.
The intensification of thermal extremes in west Africa
J. Ringard, B. Dieppois, S. Rome, A. Diedhiou, T. Pellarin, A. Konar´e, A. Diawara, D. Konat´e, B.K. Dje, G.L. Katiellou, I. Seidou Sanda, B. Hassane, T. Vischel, G.F. Garuma, G. Mengistu, M. Camara, A. Diongue, A.T. Gaye, L. Descroix
PII: S0921-8181(15)30162-4
DOI: doi:10.1016/j.gloplacha.2015.12.009
Reference: GLOBAL 2369
To appear in: Global and Planetary Change
Received date: 10 December 2014 Revised date: 14 November 2015 Accepted date: 15 December 2015
Please cite this article as: Ringard, J., Dieppois, B., Rome, S., Diedhiou, A., Pellarin, T., Konar´e, A., Diawara, A., Konat´e, D., Dje, B.K., Katiellou, G.L., Seidou Sanda, I., Hassane, B., Vischel, T., Garuma, G.F., Mengistu, G., Camara, M., Diongue, A., Gaye, A.T., Descroix, L., The intensification of thermal extremes in west Africa, Global and
Planetary Change (2015), doi: 10.1016/j.gloplacha.2015.12.009
This is a PDF file of an unedited manuscript that has been accepted for publication. As a service to our customers we are providing this early version of the manuscript. The manuscript will undergo copyediting, typesetting, and review of the resulting proof before it is published in its final form. Please note that during the production process errors may be discovered which could affect the content, and all legal disclaimers that apply to the journal pertain.
ACCEPTED MANUSCRIPT
THE INTENSIFICATION OF THERMAL EXTREMES
IN WEST AFRICA
Ringard J.(1), Dieppois B. (2, 3, 4), Rome S.(5), Diedhiou A.(6), Pellarin T.(7), Konaré A.(8),
Diawara A.(8), Konaté D. (9), Dje B. K.(9), Katiellou G.L.(10), Seidou Sanda I.(11), Hassane
B.(12), Vischel T.(5), Garuma G.F.(13), Mengistu G.(13), Camara M.(14), Diongue A.(15), Gaye
A.T.(16), DescroixL.(17)
(1) Université de Guyane, IRD, UMR ESPACE-DEV, F97300 Cayenne, Guyane (2) Centre for Agroecology, Water and Resilience, Coventry University, UK. (3) African Climate & Development Initiative, University of Cape Town, RSA. (4) Department of Oceanography, MARE Institute, University of Cape Town, RSA (5) Université Grenoble Alpes, LTHE UMR 5564, BP 53, 38041 Grenoble, France (6) IRD, LTHE UMR 5564, 38041 Grenoble, France [arona.diedhiou@ird.fr] (7) CNRS, LTHE UMR 5564, 38041 Grenoble, France.
(8) Université Félix Houphouët Boigny, UFR SSMT / LAPA-MF, Abidjan, Ivory Coast (9) SODEXAM, Meteorological Dept., 15 BP 990 Abidjan, Ivory Coast
(10) Niger Meteorological Office, BP. 218 Niamey, Niger
(11) Centre Régional AGRHYMET/CILSS; BP 11011 Niamey, Niger (12) University Abdou Moumouni, Niamey, Niger
(13) Addis Ababa Univ., Physics Department, Arat Kilo Campus, Addis Ababa, Ethiopia. (14) Université AssaneSeck of Ziguinchor, BP 523, Ziguinchor, Senegal
(15) ANACIM, Météorological Dept., BP 8257 Dakar-Yoff, Dakar, Senegal (16) Université Cheikh Anta Diop of Dakar, ESP / LPAOSF, Dakar, Senegal (17) Muséum National d’Histoire Naturelle, UMR 208 PALOC, Paris, France
ACCEPTED MANUSCRIPT
Abstract
This study aims in filling the gap in understanding the relationship between trend and extreme
in diurnal and nocturnal temperatures (Tx and Tn) over the Gulf of Guinea area and the Sahel.
Time-evolution and trend of Tx and Tn anomalies, extreme temperatures and the
time-evolution and trend of heat waves are examined using regional and station-based indices over
the 1900–2012 and 1950–2012 periods respectively. In investigating extreme temperature
anomalies and heat waves, a percentile method is used (T90p). At the regional and local
scales, rising trends in Tx and Tn anomalies, which appear more pronounced over the past 60
years, are identified over the two regions. The trends are characterized by an intensification
of: i) nocturnal/Tn warming over the second half of the 20th century; and ii) diurnal/Tx
warming over the post-1980s. This is the same scheme with extreme warm days and warm
nights. Finally annual number of diurnal and nocturnal heat waves has increase over the Gulf
of Guinea coastal regions over the second half of the 20th century, and even more substantially
over the post-1980s period. Although this trend in extreme warm days and nights is always
overestimated in the simulations, from the Coupled Model Intercomparison Project Phase 5
(CMIP5), those models display rising trends whatever the scenario, which are likely to be
more and more pronounced over the two regions in the next 50 years.
Keywords: West Africa, Trend, Daily temperature anomalies, Extreme temperature, Heat
ACCEPTED MANUSCRIPT
1. Introduction
Post-1970s warming temperatures over West Africa, and in particular over the Sahel, have
been reported somewhat faster than at the global scales (ECOWAS-SWAC/OECD/CILS,
2008; Hulme, 2001): Saharo-Sahelian, Sahelian and Sudano-Sahelian temperatures have risen
by between 0.2°C and 0.8°C. Current state-of-the-art CMIP5 coupled models (Taylor et al.,
2012) are reasonably consistent in predicting warm conditions over West Africa, but there are
large discrepancies in terms of intensity of changes (Stocker et al., 2013). According to the
last report of the Intergovernmental Panel on Climate Change, land areas might warm by as
much as 1.6°C by 2050 over the Sahara and semi-arid parts of southern Africa (Stocker et al.,
2013).
At the global scale, Braganza et al. (2004), have reported a decrease in daily temperature
range (i.e., maximal/diurnal minus minimal/nocturnal daily temperatures [Tx-Tn]), which is
characterized by greater rises in minimal/nocturnal temperatures (Tn) than in maximal/diurnal
temperatures (Tx). According to Stone and Weaver (2002), the observed decrease in daily
temperature range could be the climate system’s response to the increase in greenhouse-gas
concentrations in the atmosphere. However, such a discrepancy in between the trend of Tx
and Tn trend have never been studied over the West-African regions. In addition, as proposed
at the global scale (e.g., Christensen et al., 2007; Pachauri and Reisinger, 2008; Stocker et al.,
2013), warming temperatures is likely to contribute in increasing occurrences of extreme
temperatures, as well as heat wave (HW) events. For instance, at the global scale, Meehl and
Tebaldi (2004) noted that warming nocturnal temperatures is associated with an increase in
the number of HWs.
HWs have been defined as a period of consecutive days where conditions are excessively
hotter than normal at that time of the year. There is therefore no universal definition of heat
ACCEPTED MANUSCRIPT
2004; Alexander et al., 2006; Donat et al., 2013). Since the Chicago HW of July 1995 and that
of Western Europe in August 2003 – both followed by supernumerary rises in death rates –
such events have been extensively studied in the mid-latitudes of the Northern Hemisphere
(e.g., Beniston and Diaz, 2004; Bessemoulin et al., 2004; Black et al., 2004; Trigo et al.,
2005). Extreme heat events in the tropics have been much less studied, even though it also
concerns the tropical areas, as shown by the extreme heat experienced in Niamey in April
2010 (daily Tx overtaking 44.5°C from 18 till 22 April). This event had significant effects on
agriculture, hydrological processes and health of populations. HWs can indeed be
accompanied by increased rates of atmospheric pollution. Air pollution is a major threat to
population health, as it is the cause of a number of respiratory and cardiovascular diseases
(World Health Organisation, 2002).
This study aims in filling the gap in understanding the relationship between trend and extreme
in diurnal and nocturnal temperatures (Tx and Tn) over the Gulf of Guinea area (4°–10°N;
10°W–10°E; cf. Figure 1) and the Sahel (10°–20°N; 10°W–10°E; cf. Figure 1). This study
also helps to determine whether this relationship, which is here discussed through seasonal
fluctuations, is different from that reported at the global scale. For instance, are the trend
greater in Tn than in Tx, and are this associated with an increase of nocturnal HWs. In
addition, potential definition of thermal extreme and HW indices will be discussed for the
Gulf of Guinea coastal regions and the Sahel. Data and methods are described in Section 2.
We then present the seasonal temperature fluctuations in the West African region, before to
focus on two regions: the Gulf of Guinea (Abidjan) coastal regions and the Sahel (Niamey).
In Section 3.1, time-evolution and trend of Tx and Tn anomalies during the 20th century is
investigated. In Section 3.2, we focus on the extreme values in the seasonal temperature
anomalies through different indices, which allow to examine the time-evolution and trend of
HWs. Finally, in Section 3.3, observed trends of extreme heat events are compared to those
ACCEPTED MANUSCRIPT
2. Data and methods
2.1. Data
We use National Centers for Environmental Prediction / National Center for Atmospheric
Research Reanalysis data (NCEP/NCAR-1; Kalnay et al., 1996), with a horizontal resolution
of 2.5° × 2.5°, to represent the seasonal evolution of mean temperatures (at 2 metres above the
ground) over West Africa between 1951 and 1980 (i.e., baseline period of seasonal
temperature anomalies in Sections 3.1-3).
Tx and Tn trends are analysed at the regional and local scales. At the regional scale, the daily
homogenised Berkeley Earth Surface Temperatures (BEST) observation data set has been
used. Between 1900 and 2012, these data show daily Tx and Tn anomalies with a spatial
resolution of 1°× 1° (Rohde et al., 2013). These daily anomalies were calculated by
subtracting for each day its monthly climatology (i.e., the monthly mean) with respect to the
1951–1980 base period. Gridded temperature anomalies from BEST are derived from,
approximately, 39000 weather stations distributed around the world, which is five times more
than other data sets (e.g., CRU/Hadley Centre, NCDC/NOAA and GISS/NASA). Despite this,
density of observation network remains an intractable problem over the Sahara. A variety of
treatments (e.g., filter, interpolation and merge) have been done on the raw data. The different
steps are listed in Berkeley Earth website in http://berkeleyearth.org/about-data-set. At the
local scale, daily Tx and Tn anomalies are examined in Abidjan and Niamey between 1950
and 2012. This data were provided by the Société D’EXportation et de dévelopement
Aéroportuaire, Aéronautique et Météorologique (SODEXAM) of Abidjan Port-Bouët, and the Direction de la Météorologie Nationale (DMN) of Niger. These stations have been selected
for their long temporal lengths (i.e., 60 years) without big gaps, but also for their quality.
Several homogeneity tests, such as Pettitt, Mann-Whitney-Wilcoxon Buishand, Cumulative
ACCEPTED MANUSCRIPT
and 1986 for Abidjan (not shown), which were not associated with modifications of
measurement conditions, such as gauge displacement, measurement instrument replacement,
change in gauge exposure or environment (Rome et al., 2015).
Finally, simulations from five coupled models of the CMIP5 project, and an ensemble mean
of 24 CMIP5 models (Taylor et al., 2012), have been used to be compared with observations
(Table 1). The “one model, one vote” approach of Santer et al. (2009), i.e., the first realisation
of each model, has been used. It ensures that each model has the same weight and that the
results are due to “outlier” model or to stronger weight for given climate centre. Comparisons with observations have been done using “historical” runs. Between 1900 and 2005, these
simulations provide a realistic representation of global climate variation due to anthropogenic
and natural forcing (e.g., solar, volcanic, sulphates, aerosols and greenhouse gases, land use).
Historical trends were then compared with those projected over the 21st century under two
Representative Concentration Pathway (RCP) scenarios: RCP 2.6 and RCP 8.5, i.e. the most
optimistic and the most pessimistic emissions of well-mixed greenhouse gases (in W.m–2).
Models Resolution
(Lat × Lon) Institution
Country
CMIP5 Mean 2.5° × 2.5°
CNRM-CM5 1.4° × 1.4°
Centre national de Recherche Météorologique (CNRM) / Centre Européen de Recherche et de
Formation Avancée en Calcul Scientifique (CERFACS)
France
IPSL-CM5A-LR
1.865° ×
3.75° Institut Pierre-Simon Laplace (IPSL) France MPI-ESM-LR 1.865° ×
1.875° Max Planck Institut (MPI) Germany HadGEM2-ES 1.25° ×
1.875° Met Office Hadley Center (MOHC)
United Kingdom CanESM2 2.79° ×
2.813°
Canadian Centre for Climate modelling and
analysis (CCCma) Canada
Table 1. Summarised information on CMIP5 models used in the study.
ACCEPTED MANUSCRIPT
A set of statistical analyses has been designed to identify trends in temperatures at the
regional (i.e., the regionalised temperature index for the Sahel and the Gulf of Guinea area)
and local scales (i.e., Niamey and Abidjan stations). The daily Tx and Tn anomalies are
calculated by subtracting for each day its monthly climatology with respect to the 1951–1980
base period. This reduces uncertainties associated with the absolute temperature (Rohde et al.,
2013; Cowtan and Way, 2014), but also reduces the influences of seasonal fluctuations. Daily
Tx and Tn anomalies are then averaged on a seasonal time-step (i.e., JFM, AMJ, JAS, SON).
To examine the time-evolution of extreme temperature anomalies and HWs, we used the 90th
percentile of daily Tx and Tn anomalies (Tx90p and Tn90p), with respect to the 1951–1980
base period, as threshold. The Tx90p and Tn90p have been widely used through international
projects about the detection of extreme temperatures and HWs at the regional and global
scales, e.g., IMFREX ("IMpact des changements anthropiques sur la FRéquence des
phénomènes EXtrêmes de vent, de température et de précipitations"; Déqué, 2005)),
STARDEX ("STAtistical and Regional dynamical Downscaling of EXtremes for European
regions"; Goddess, 2005) and ClimdEX (Alexander et al., 2006; Donat et al., 2013).
According to Zhang et al. (2005), great care is required to estimate the Tx90p and Tn90p to
ensure that inhomogeneities are not introduced into the index time series at the boundaries of
the base periods that are used to determine the thresholds (i.e., 1951–1980). A bootstrap
procedure, which proposed to replicate the Tx90p and Tn90p calculations using a geometric
block resampling over the base period, has therefore been used. Time-evolution of extreme
temperature indices is then discussed for every significant Tx90p and Tn90p values, i.e., in
the nonparametric bootstrap confidence intervals at 95%, as determined from a normal
distribution. Eight indices of extreme temperatures anomalies are derived from this procedure
for each region: i) the seasonal percentage of days when Tx exceeds the 90th percentile (i.e.,
Tx90p); ii) the seasonal percentage of nights warmer than the Tn90p; iii) the maximal
ACCEPTED MANUSCRIPT
maximal duration of nocturnal HWs, i.e., maximal consecutive nights exceeding the Tn90p;
v) the mean duration of diurnal HWs; vi) the mean duration of nocturnal HWs; vii) the annual
number of diurnal HWs, which is defined as annual count of spells with at least n consecutive
days when Tx anomalies exceed the Tx90p; viii) the annual number of nocturnal HWs, which
is defined as annual count of spells with at least n consecutive days when Tn anomalies
exceed the Tn90p. However, the number of consecutive days n, which is required to define
HWs, varies greatly in the literatures; it is very sensitive to the study region. At least 6
consecutive days was proposed at the global scale by the ClimDEX project (Alexander et al.,
2006; Donat et al., 2013), but other studies also reduce that value to 3 (e.g., Perkins et al.,
2012; Perkins and Alexander, 2013). In the present study, to discuss this choice with regards
to the West African region, the annual number of diurnal and nocturnal HWs has been
investigated for 3 ≤ n ≤ 8 consecutive days.
Next, monotonic trends in time series were calculated using a modified Mann-Kendall trend
test accounting for serial correlation (Hamed and Rao, 1998; Yue and Wang, 2004). To
eliminate the effect of serial correlation, the effective sample size, which allows us to modify
the Mann-Kendall S statistic, has been estimated according to a theoretical relationship based
on first-order auto-regressive model of each time series considered. The Sen’s slopes
associated with trend intensity are then calculated (Sen, 1968), while the statistical
significance is assumed by the p-value (hereafter, at p = 0.05). Note that in analysing extreme
temperature indices every possible values of the Sen’s slope derived from the bootstrapping
are summarized in violin plots, which, basically, show the kernel density estimation of the
underlying distribution. Finally, seasonal trends of Tx and Tn anomalies are displayed using
linear regressions for the 1950–2012 period, and by adjusting a locally weighted
nonparametric polynomial regression (LOESS) with appropriate degree of smoothing (i.e.,
span; Figures 2-9). This method, which allows us to discuss non-linear characteristics of the
ACCEPTED MANUSCRIPT
analysis (Cleveland and Devlin, 1988). Different span have been used to account for the time
series with different lengths. For instance, a span of approximately 0.58 has been used for the
regional indices (spanning the period 1900–2012), while the span is equal to 1 for the
local/station time series (spanning the period 1950–2012). Similar adjustments of the span
have been used to compare observed and simulated trends by the CMIP5 models in Sect. 3.3.
In addition, the contribution of trends in daily Tx and Tn anomalies, which can be considered
as climatic signals, to extreme temperatures and HWs, which, basically, refer to intraseasonal
events, has been discussed. A statistical sensitive experiment is performed by repeating the
extreme index calculations and monotonic trend analysis after subtracting the influence of
non-linear trends (i.e., LOESS) in daily Tx and Tn anomalies using a generalized linear
model.
3. Results
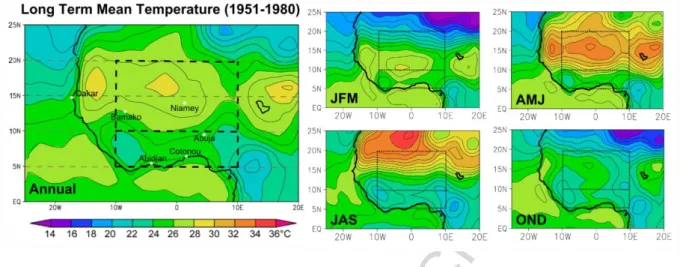
Annual and seasonal climatology over the 1951–1980 period, which is used as baseline period
in Sects. 3.1 and 3.2, is displayed in Figure 1. The West African region is clearly
characterized by a meridional large-scale temperature gradient between the northern and
southern regions, partly driven by sea-surface temperature in the equatorial Atlantic (Figure
1). As an annual average, temperature maxima are located over the Sahara, while lowest
temperatures aligned along the Guinea Coast (Figure 1). This pattern, however, mainly
reflects spring (AMJ) and summer (JAS) months, in which this temperature gradient
contributes to the development and northward displacement of the West-African Monsoon. In
the Sahel, the hottest season occurs during the pre-monsoon months, i.e., in AMJ (up to 32°C
at 15°N and 0°E; Figure 1). This pattern is shifted southward in winter (or dry season; JFM);
warm temperature are therefore identified over the Gulf of Guinea coastal region. Meanwhile,
autumn months (OND) are cold throughout West Africa compared to the annual mean (Figure
ACCEPTED MANUSCRIPT
Figure 1. Mean air temperatures in West Africa between 1951 and 1980 (in °C) using the
NCEP/NCAR-1 reanalysis. The yearly mean is shown on the left; Seasonal means are shown
on the right. The dotted rectangles correspond to the two regions studied: the Central Sahel
(10°–20°N; 10°W–10°E) and the Gulf of Guinea area (4°–10°N; 10°W–10°E).
3.1. Seasonal trends in diurnal and nocturnal daily temperature anomalies
Seasonal time-evolution and trend of daily Tx and Tn anomalies is displayed for the Gulf
Guinea coastal region in Figure 2, and for the Sahel in Figure 3. These daily Tx and Tn
anomalies are analysed at the regional (via regionally aggregated indices) and local scales (via
station data; Figures 2-3). Regionally aggregated indices have been computed over the Sahel
(10°–20°N; 10°W–10°E) and the Gulf of Guinea coastal regions (4°–10°N; 10°W–10°E)
using the BEST data set. As mentioned in Sect. 2.1, this data set provides Tx and Tn
anomalies, which were calculated for each-grid point and each day with regards to the
monthly average temperature of the 1951–1980 period. The same procedure has therefore
ACCEPTED MANUSCRIPT
Figure 2. Seasonal time-evolution of daily Tx and Tn anomalies over the Gulf of Guinea
coastal region (GG). (a-d) Daily Tx (light red) and Tn (light blue) anomalies of the GG
regional index from BEST data set for each season (i.e., JFM, AMJ, JAS, OND) between
1900 and 2012. (e-h) as for (a-d) but using Abidjan station data between 1950 and 2012.
Dashed bold lines indicate linear trends for the 1950–2012 period. Solid bold lines indicate
locally weighted nonparametric polynomial regressions (LOESS) with adjusted degree of
smoothing between regional and local anomalies (cf. Sect. 2.2). Daily Tx and Tn from BEST
has been plotted using 30-days moving window for display purpose.
In JFM, at the regional scale, the Gulf of Guinea coastal regions display increasing trends in
Tx and Tn from the beginning of the 20th century, but these trends are non-linear (i.e.,
derivations to the linear regression trend lines; Figure 2a). These regional trends are more
pronounced, and significant at p = 0.05 (Figure 4a-b), over the second half of the 20th century,
especially in Tn (Figure 2a). The Tn warming is almost linear since 1950, while the Tx
warming is accentuated over the post-1980s period (Figures 2a, 4a-b). This is clearer using
Abidjan station data (Figure 2e). In JFM, the nocturnal/Tn warming trend is greater than the
diurnal/Tx warming since the 1950, but this pattern tend to reverse over the post-1980s period
ACCEPTED MANUSCRIPT
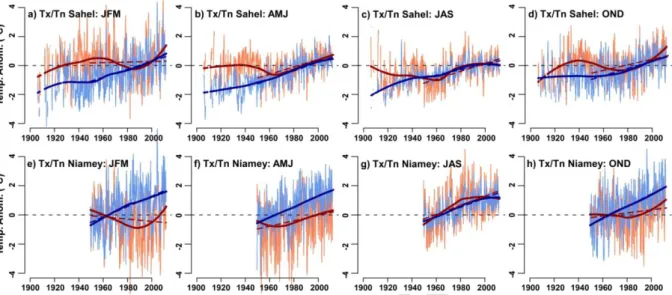
During the same season, the Sahel regional index shows an almost linear warming trend in Tn
during the 20th century, while the Tx trend, which is highly non-linear, shows multidecadal
fluctuations (Figure 3a). This is also evident between 1950 and 2012 using Niamey station
data (Figure 3e). In JFM, at the regional and local scales, since 1950, a significant warming is
identified in Tn, while there is no significant trend in Tx (Figure 4c-d). However, using the
Sahel regional index and Niamey station data, the Tx trend is increasing significantly over the
post-1980s period (Figures 3a, e, 4c). In JFM, during the post-1980s period, diurnal/Tx
warming is greater than nocturnal/Tn warming over the Sahel (Figures. 3a, e, 4c-d).
In AMJ, over the Gulf of Guinea coastal regions, we note an almost linear warming in Tn
during the 20th century, while the Tx trend shows multidecadal fluctuations (Figure 2b). This
difference between the trend in Tx and Tn is even more pronounced between 1950 and 2012
using Abidjan station data (Figure 2f). Since 1950, significant Tn warming trend is detected at
the regional and local scales (Figure 4a-b). This is only significant at the local scale in Tx
(Figure 4a-b). In AMJ, between 1950 and 2012, nocturnal/Tn warming is greater than
diurnal/Tx warming over the Gulf of Guinea coastal regions. The Tx trend is however
increasing significantly at the regional and local scales during the post-1980s period (Figures
2b-f, 4a).
Over the Sahel, in AMJ, at the regional and local scales, we note an almost strictly linear
warming trend in Tn during the 20th century (Figures 3b, f). Warming Tx trend is only
identified since 1960 (Figures 3b, f). Significant trends at p = 0.05, which seems to be linear
throughout the second half of the 20th century, are therefore identified in Tx and Tn between
1950 and 2012 (Figure 4c-d). We nevertheless note non-significant trend in Niamey Tx and in
the Sahel Tn regional index during the post-1980s period (Figure 4c-d). In AMJ, throughout
the 20th century, nocturnal/Tn warming is greater than diurnal/Tx warming over the Sahel
ACCEPTED MANUSCRIPT
Figure 3. Seasonal time-evolution of daily Tx and Tn anomalies over the Sahel. (a-d) Daily
Tx (light red) and Tn (light blue) anomalies of the Sahel regional index from BEST data set
for each season (i.e., JFM, AMJ, JAS, OND) between 1900 and 2012. (e-h) as for (a-d) but
using Niamey station data between 1950 and 2012. Dashed bold lines indicate linear trends
for the 1950–2012 period. Solid bold lines indicate locally weighted nonparametric
polynomial regressions (LOESS) with adjusted degree of smoothing between regional and
local anomalies (cf. Sect. 2.2). Daily Tx and Tn from BEST has been plotted using 30-days
moving window for display purpose.
In JAS, at the regional scale, the Gulf of Guinea coastal regions show an almost linear trend in
Tn from the beginning of the 20th century, while the Tx trend is warming almost linearly since
1960 (Figure 2c). However, using Abidjan station data, these warming trends in Tx and Tn do
not seem to be linear between 1950 and 2012 (i.e., large deviations to the linear regression
trend lines; Figure 2g). Between 1950 and 2012, we note significant Tn warming at the
regional and local scales, while this is only identified at the regional scale in Tx (Figure.
4a-b). In JAS, this warming is slightly more pronounced in diurnal/Tx than in nocturnal/Tn over
the 1950–2012 period (Figure 4a-b). However, Tx are significantly rising at the regional and
local scales over the post-1980s period, while this is only noted in Tn using Abidjan station
ACCEPTED MANUSCRIPT
regional scale over the Gulf of Guinea coastal regions (Figure 4b). Nocturnal/Tn is therefore
warming up earlier (throughout the 20th century) than the diurnal/Tx trend (Figure 2c, g,
4a-d). However, the Tx warming trend might be greater than Tn warming over the post-1980s
period (Figure 2c, g, 4a-d).
In JAS, over the Sahel, the Tn trend is increasing non-linearly at the regional scale since the
beginning of the 20th century (Figures 3c). The Tx Sahel warming is only identified since
1960 at the regional scale, but this trend is non-linear (Figure 3c). At the regional and local
scales, Tx and Tn anomalies show significant trends at p = 0.05 between 1950 and 2012
(Figure 4c-d). During that period, diurnal/Tx warming is greater than nocturnal/Tn warming
in the Sahel (Figures 3c, g, 4c-d). However, these trends are substantially weakened after the
1970s (Figure 3c, g). There are therefore no significant trends in Tx and Tn (except using
Niamey station data) over the post-1980s period (Figure 4c-d),
In OND, at the regional scale, the Gulf of Guinea coastal regions display warming trends in
Tx and Tn over the 20th century (Figure 2d). However, these trends are also not linear. For
instance, the Tn regional warming trend is more pronounced since 1960 (Figures 2d, 4b).
During that period, the Tn warming trend is almost linear using a regional index, but shows an
intensification over the post-1980s period using Abidjan station data (Figure 2d). Between the
1950–2012 and 1980-2012 periods, linear trends are significant at p = 0.05 (Figure 4b). The
Tx warming trend, which is already significant between 1950 and 2012, is more pronounced
over the post-1980s period at the regional and local scales (Figure 2d, h, 4a). In OND,
nocturnal/Tn warming is therefore slightly greater than diurnal/Tx warming between 1950 and
2012, but it might not be verified over the post-1980s period (Figure 2c, g, 4a, b).
In OND, similar results are identified over the Sahel (Figures 3d, h). Non-linear warming
ACCEPTED MANUSCRIPT
scales, the Tn trend is more pronounced, and almost linear, during the second half of the 20th
century (Figure 3d, h). Since 1950, significant Tn warming trends at p = 0.05, which slightly
increase over the post-1980s period, are detected over the Sahel (Figure 4d). Significant Tx
trends during the 1950–2012 period, which are highly non-linear, are much more pronounced
over the post-1980s period (Figure 3d, h, 4c). In OND, over the Sahel, nocturnal/Tn warming
is therefore greater than diurnal/Tx warming between 1950 and 2012. This pattern, however,
tends to reverse over the post-1980s period.
Figure 4. Seasonal trends of regional and local Tx and Tn over the Gulf of Guinea coastal
region (GG) and the Sahel during the 1950–2012 (dark colours) and 1980–2012 (light
colours) period. (a-b) Mann-Kendall Sen’s slope estimations of Tx (red) and Tn (blue) using a
GG regional index (circle) and Abidjan station data (triangle). (c-d) as for (a-b) but using a
Sahel regional index and Niamey station data. Little circle and triangle indicate
non-significant trends at p = 0.05 with regards to a Mann-Kendall trend test accounting for serial
correlations.
In summary, non-linear warming trends are identified in Tx and Tn anomalies over the Gulf
ACCEPTED MANUSCRIPT
particular, by an intensification of: i) nocturnal/Tn warming over the second half of the 20th
century; and ii) diurnal/Tx warming over the post-1980s. These results are therefore
consistent with Fontaine et al. (2013), who found a warming in mean temperatures over the
Sahel. However, in the present study, we show that, since 1980, there is no diurnal and
nocturnal warming during the Sahel Monsoon season (i.e., JAS). In addition, we found
non-linear trends, which are likely to alter the daily temperature ranges. As reported at the global
scale (Braganza et al., 2004), nocturnal/Tn warming is greater than diurnal/Tx warming since
the mid-20th century. However, the opposite tends to occur over the post-1980s period.
Diurnal/Tx warming is thus increasing for each season over the Gulf of Guinea coastal region,
and for winter seasons (i.e., JFM and OND) over the Sahel.
3.2. Trends in extreme temperature anomalies, and heatwave events.
3.2.1 Extreme warm days and nights
Time-evolution and trend of the percentage of days of each season with daily Tx and Tn
anomalies above the Tx90p and Tn90p, i.e., extreme warm days and nights, is displayed for
the Gulf of Guinea coastal region in Figure 5, and for the Sahel in Figure 6.
In JFM, percentage of extreme warm days and nights increases since the 1960s, at the
regional and local scales, over the Gulf of Guinea coastal regions (Figure 5a-b). Significant
trends at p = 0.05 are detected in more than 75% of bootstrap simulations in extreme warm
days (except using Abidjan data) and extreme warm nights between 1950 and 2012 (Figure
5c). During this period, increasing trend of extreme warm nights is slightly greater than that of
extreme warm days (Fig. 5c). However, these trends are not linear, in particular, using
Abidjan station data (Figure 5a-c). Sen’s slope values of both extreme warm days and nights,
which are significant in most of the bootstrap simulations, are more pronounced over the
post-1980s period (Figure 5c). Increasing trend in extreme warm days also tends to be greater than
time-ACCEPTED MANUSCRIPT
evolution of trends in extreme warm days and nights over the Gulf of Guinea are strongly
dependent on diurnal/Tx and nocturnal/Tn warming trends. There are no significant trends in
extreme warm days and nights after subtracting the influence of diurnal and nocturnal
warming trends (Figure 5c).
In the Sahel, in JFM, extreme warm nights increase regionally and locally over the second
half of the 20th century, while extreme warm days show multi-decadal fluctuations throughout
the 20th century (Figure 6a-b). Between 1950 and 2012, significant trends at p = 0.05 are
identified in extreme warm nights, but not in extreme warm days (Figure 6c). However,
during the post-1980s period, percentage of extreme warm days increases substantially; this is
significant between 50% and 75% of bootstrap simulations (Figure 6a-c). During that period,
extreme warm nights slightly increase using a regional index, while there is no significant
trend using Niamey station data (Figure 6a-c). Note, however, that the regional trend in
extreme warm nights does not seem robust regarding the bootstrap results (less than 50% of
simulations are significant at p = 0.05; Figure 6c). In JFM, trends in Sahel extreme warm days
and nights are strongly dependent to diurnal/Tx and nocturnal/Tn warming trends. There are
no significant trends in Sahel extreme warm days and nights when subtracting the influence of
ACCEPTED MANUSCRIPT
Figure 5. Percentage of days each season with daily Tx and Tn above the Tx90p and Tn90p, i.e., extreme warm days and nights, over the Gulf of Guinea coastal regions (GG). (Top
panels) Seasonal percentage of extreme warm days (light red polygons) and nights (light blue
polygons) between 1900 and 2012, as determined through every Tx90p and Tn90p values
within the nonparametric bootstrap confidence intervals at p = 0.05, using the GG regional
index from BEST data set. (Middle panels) as for (top) but using Abidjan station data between
1950 and 2012. On the top and middle panels, solid bold (thin) lines indicate the average
(maximal and minimal) trends, i.e., LOESS regressions, of bootstrap simulations. Note that
the LOESS regressions have been adjusted degree of smoothing between regional and
station-based indices (cf. Sect. 2.2). (Bottom panels) Violin plot summarizing every possible Sen’s slope values from the bootstrap simulations over the 1950–2012 (dark colours) and the 1980–
2012 (light colours) periods. Grey violin plots indicate Sen’s slope values using extreme
warm day and nights calculated after subtracting linearly the influence of trends in daily Tx
and Tn anomalies. Percentage of chance to obtain significant trends at p = 0.05 has been
assessed through a Mann-Kendall trend test accounting for serial correlations.
ACCEPTED MANUSCRIPT
In AMJ, at regional and local scales, percentage of extreme warm nights increases during the
second half of the 20th century (in particular since 1960) over the Gulf of Guinea coastal
regions (Figure 5d-e). Percentage of extreme warm nights over the Gulf of Guinea coastal
regions displays multi-decadal fluctuations over the 20th century, but we note an increasing
trend since 1970/80 (Figure 5d-e). Between 1950 and 2012, significant trends in extreme
warm nights and days (except using Abidjan station data) are identified in more than 75% of
bootstrap simulations (Figure 5f). This increasing trend is, between 1950 and 2012, slightly
more pronounced in extreme warm nights than in extreme warm days (Figure 5f). However,
the percentage of extreme warm days is significantly rising over the post-1980s period (Figure
5d-f). During that period, increasing trend of extreme warm nights is less pronounced using
the regional index, and much more pronounced using Abidjan station data (Figure 5d-f).
Time-evolution of the trend in extreme warm days is strongly related to the diurnal/Tx
warming trend over the Gulf of Guinea coastal regions. This is also true for the post-1980s
trend of extreme warm nights (Figure 6f). However, between 1950 and 2012, significant
increasing trends are still identified in extreme warm nights over the Gulf of Guinea coastal
regions, even if we remove the influence of nocturnal/Tn warming trends (Figure 6f). The
climatic warming trend, therefore, might not be the only driver of the post-1960s increase in
extreme warm nights over the Gulf of Guinea coastal region.
Over the Sahel, in AMJ, percentage of extreme warm days and nights only increases since
1960 (Figure 6d-e). Between 1950 and 2012, significant trends in extreme warm night and
days are therefore identified in more than 75% of bootstrap simulations (Figure 6f). Over the
post-1980s period, contrasted patterns are observed using the Sahel regional index and
Niamey station data. For instance, although increasing trend of extreme warm days are much
more pronounced than between 1950 and 2012, there is no robust trends using Abidjan station
data (i.e., less than 50% of trends of bootstrap simulations are significant). Furthermore,
ACCEPTED MANUSCRIPT
nocturnal/Tn and diurnal/Tx warming trends. In AMJ, there are no significant trends in Sahel
extreme warm days and nights when subtracting the influence of diurnal and nocturnal
warming trends (Figure 6f).
In JAS, over the Gulf of Guinea coastal regions, percentage of extreme warm days and nights
increases over the second half of the 20th century (Figure 5g-h). At the regional and local
scales, significant trends in extreme warm nights and days, which are of the same order of
magnitude, are thus identified in more than 75% of bootstrap simulations between 1950 and
2012 (Figure 5i). However, these trends are highly non-linear, in particular using Abidjan
station data (Figure 5g-h). Over the post-1980s period, increasing trends of extreme warm
days and nights are both significantly more pronounced than during the 1950-2012 period
(Figure 5g-i). During that period, increasing trend of extreme warm days tends to be greater
than that of extreme warm nights (Figure 5i). Over the GG, time-evolution of trends in
extreme warm days and nights is thus strongly related to nocturnal/Tn and diurnal/Tx
warming trends. No significant trends in extreme warm days and nights over the Gulf of
Guinea coastal regions are identified after subtracting the influence of diurnal and nocturnal
warming trends (Figure 5i).
Over the Sahel, in JAS, percentage of extreme warm days and nights increase since 1960 at
the regional and local scales (Figure 6g-h). Between 1950 and 2012, significant increasing
trends, which are slightly more pronounced in extreme warm nights than in extreme warm
days, are detected in more than 75% of bootstrap simulations (Figure 6i). However, these
increasing trends are weakened over the post-1980s period (Figure 6g-h). Except in Niamey
extreme warm nights, there is no significant trend in extreme warm night and days over the
post-1980s (Figure 6i). In JAS, time-evolution of trends in Sahel extreme warm days and
ACCEPTED MANUSCRIPT
significant trends in Sahel extreme warm days and nights after subtracting linearly the
influence of diurnal and nocturnal warming trends (Figure 6c).
In OND, over the GG, percentage of extreme warm days and night increases regionally and
locally during the second half of the 20th century (Figure 5j-k). Significant trends at p = 0.05
are identified in most of bootstrap simulations between 1950 and 2012 (Figure 5l). These
trends are, however, non-linear. Increasing trend in extreme warm nights is more pronounced
over the post-1980s century, in particular using Abidjan station data (Figure 5j-l). Increasing
trend in extreme warm days, which is particularly inhomogeneous regarding the bootstrap
simulations, seems closely related to a very important rise over the post-1980s period (Figure
5j-l). Between 1950 and 2012, increase of extreme warm nights is slightly greater than that of
extreme warm days, but this pattern tends to reverse over the post-1980s (Figure 5l).
Furthermore, in OND, time-evolution of trends in Sahel extreme warm days and nights also
runs parallel with nocturnal/Tn and diurnal/Tx warming trends. Except in Abidjan extreme
warm nights, there are no significant trends in extreme warm days and nights over the GG
after subtracting the influence of diurnal and nocturnal warming trends (Figure 5l).
Over the Sahel, in OND, percentage of extreme warm days and nights increases non-linearly
throughout the 20th century (Figure 6j-k). Between 1950 and 2012, significant trends, which
are slightly greater in extreme warm nights than in extreme warm days, are identified in more
than 75% of bootstrap simulations (Figure 6l). These increasing trends are, however, more
pronounced over the post-1980s period in both extreme warm days and nights (Figure 6j-k).
Over the post-1980s period, increase of extreme warm days tends to be greater than in
extreme warm nights at least at the regional scale (Figure 6j-l). Furthermore, as for the other
seasons, time-evolution of extreme warm days and nights is closely related to those of diurnal
ACCEPTED MANUSCRIPT
days and nights after subtracting linearly the influence of diurnal and nocturnal warming
trends (Figure 6l).
In summary, we note non-linear increases in extreme warm days and nights from the second
half of the 20th century over the Gulf of Guinea coastal regions and the Sahel. These trends
are most of time more pronounced over the post-1980s periods, in particular for extreme
warm days. While, between 1950 and 2012, increasing trend of extreme warm nights is
greater than extreme warm days, this pattern tends to reverse during the post-1980s period.
There is, however, no post-1980s increase of Sahel extreme warm days during the Monsoon
season (i.e., JAS). Furthermore, increases in the percentage of extreme warm days and nights
are principally driven by the climatic diurnal and nocturnal warming trends. This only
partially explains the increase of extreme warm nights over the GG during the pre-Monsoon
season (i.e., AMJ), where additional drivers should be investigated.
3.2.2 Maximal and mean duration of diurnal and nocturnal warm spells
We examine the annual maximal and mean durations of extreme warm days and warm nights
over the two regions in Figure 7. Maximal (mean) durations of extreme temperature are
ACCEPTED MANUSCRIPT
Figure 7. Maximal and mean durations of diurnal and nocturnal warm spells over the Gulf of
Guinea coastal regions (GG) and the Sahel. (a-c) Time-evolution and trend of annual maximal
(dark colours) and mean (light colours) duration of diurnal (red polygons) and nocturnal (blue
polygons) warm spells, which are defined as maximal and mean consecutive days exceeding
the Tx90p and the Tn90p, using the GG regional index and Abidjan station data. (d-f) as for
(a-c) but using the Sahel regional index and Niamey station data. Note that polygons indicate
warm spell durations for every Tx90p and Tn90p values within the nonparametric bootstrap
confidence intervals at p = 0.05. Solid bold (thin) lines indicate the average (maximal and
minimal) trends, i.e., LOESS regressions, of bootstrap simulations. Note that the LOESS
regressions have been adjusted degree of smoothing between regional and station-based
indices (cf. Sect. 2.2). Violin plot summarizing every possible Sen’s slope values from the bootstrap simulations over the 1950–2012 (dark colours) and the 1980–2012 (light colours)
periods are displayed on the right hand panels. Grey violin plots indicate Sen’s slope values
using extreme warm day and nights calculated after subtracting linearly the influence of
trends in daily Tx and Tn anomalies. Percentage of chance to obtain significant trends at p =
0.05 has been assessed through a Mann-Kendall trend test accounting for serial correlations.
Over the Gulf of Guinea coastal regions, maximal and mean duration of diurnal and nocturnal
warm spells show, at the regional scale, multidecadal fluctuations over the 20th century
(Figure 7a). At the regional and local scales, non-linear increasing trends are identified since
1950 in maximal and mean duration of nocturnal and diurnal warm spells (Figure 7a-b).
Between 1950 and 2012, these trends are significant in more than 75% of bootstrap
simulations (Figure 7c). These trends become more marked over the post-1980s period, in
particular for the maximal duration of warm spells (Figure 7a-c). However, during these two
periods, maximal and mean duration of diurnal warm spells are greater than that of diurnal
warm spells (except at the regional scale for the mean duration of nocturnal warm spells;
ACCEPTED MANUSCRIPT
diurnal and nocturnal warm spells are closely related to those of diurnal and nocturnal
warming trends. Except for warm spell durations in Abidjan, which could highlight local
inhomogeneities, there is no significant increase of warm spell durations after subtracting the
influence of diurnal and nocturnal warming trends (Figure 7c).
In the Sahel, at the regional scale, maximal duration of diurnal and nocturnal warm spells
increase non-linearly throughout the 20th century, while mean duration of diurnal and
nocturnal warm spells show little change (Figure 7d). This is also evident between 1950 and
2012 using Niamey station data (Figure 7e). Between 1950 and 2012, increasing trends in the
maximal duration of nocturnal warm spells are detected in more than 75% of bootstrap
simulations (Figure 7f). Although this is not verified using a regional index, which display
large multidecadal fluctuations, maximal duration of diurnal warm spells also shows a
significant increase between 1950 and 2012 (Figure 7d-f). At the regional scale, such a
significant increase of maximal duration of diurnal warm spells is only identified between
50% and 75% of bootstrap simulations over the post-1980s period (Figure 7f). However,
increasing duration of diurnal (in Niamey) and nocturnal warm spells over the post-1980s,
which is evident through LOESS regressions, is not significant regarding a modified
Mann-Kendall test accounting for serial correlation (Figure 7d-f). At the same time, most of the
time, there are no robust significant changes in the mean duration of diurnal and nocturnal
warm spells (less than 50% of bootstrap simulations show significant trends; Figure 7f).
Furthermore, changes in the durations of Sahel diurnal and nocturnal warm spells are strictly
related to diurnal and nocturnal warming trends. There is no significant increase of warm spell
durations after subtracting the influence of diurnal and nocturnal warming trends (Figure 7c).
In summary, maximal and mean duration of diurnal and nocturnal warm spells has increase
over the Gulf of Guinea coastal regions, in particular, over the second half of the 20th century.
ACCEPTED MANUSCRIPT
that period in the Sahel; this increase is, however, statistically quite questionable in the over
the post-1980s period. We note that such increasing trends are primarily driven by the
climatic diurnal and nocturnal warming trends.
3.2.3 Annual number of diurnal and nocturnal heat waves.
Time-evolution of annual number of diurnal and nocturnal HWs over the 20th century is
examined in Figure 8 for the two regions. As mentioned in Section 2.2., the annual number of
diurnal and nocturnal HWs is defined as annual count of spells with at least n consecutive
days when Tx and Tn anomalies exceed the Tx90p and Tn90p. The number of consecutive
days n, which is required to define HWs, is however very sensitive to the studied region, and
this has never been discuss in the West-African context. Thus, in the present study, the annual
number of diurnal and nocturnal HWs has been investigated for 3 ≤ n ≤ 8 consecutive days.
Figure 8. Annual number of diurnal and nocturnal heat waves over the Gulf of Guinea coastal
regions (GG) and the Sahel. (a-c) Time-evolution and trend of annual number of diurnal (red)
and nocturnal HWs (blue), which are defined as annual count of spells with at least 3 < n < 8
consecutive days when Tx and Tn anomalies exceed the Tx90p and Tn90p, using the GG
regional index and Abidjan station data. (d-f) as for (a-c) but using the Sahel regional index
ACCEPTED MANUSCRIPT
values within the nonparametric bootstrap confidence intervals at p = 0.05. Light polygons
indicate number of HWs for every definition of n. Solid bold (thin) lines indicate the average
(maximal and minimal) trends, i.e., LOESS regressions, of bootstrap simulations. Note that
the LOESS regressions have been adjusted degree of smoothing between regional and
station-based indices (cf. Sect. 2.2). Violin plot summarizing every possible Sen’s slope values over the 1950–2012 (dark colours) and the 1980–2012 (light colours) periods are displayed on the
right hand panels. Grey violin plots indicate Sen’s slope values using extreme warm day and
nights calculated after subtracting linearly the influence of trends in daily Tx and Tn
anomalies. Percentage of chance to obtain significant trends at p = 0.05 has been assessed
through a Mann-Kendall trend test accounting for serial correlations.
Over the Gulf of Guinea coastal regions, annual number of diurnal and nocturnal HWs has
non-linearly increased, in particular over the second half of the 20th century (Figure 8a-b).
Between 1950 and 2012, significant trends are identified in more than 75% of HWs
definitions (i.e., bootstrap simulations of Tx90p and Tn90p, as well as definition of n; Figure
8c). We note that trend in the number of nocturnal HWs tend to be slightly greater than that of
diurnal HWs between 1950 and 2012 (Figure 8c). However, these trends are both increasing
over the post-1980s period (Figure 8a-c). During that period, increasing trends in number of
diurnal HWs tend to be greater than that of nocturnal HWs (Figure 8c). We also note that
trends in the number of HWs are much more pronounced using n = 3 than using n = 8, which
shows very little change (Figure 8a-c). Furthermore, over the Gulf of Guinea coastal regions,
time-evolution of diurnal and nocturnal HW occurrences appears closely linked to the
climatic diurnal and nocturnal warming trends. There is no significant increase of HWs after
subtracting the influence of diurnal and nocturnal warming trends (Figure 8c). Between 25%
and 50% of HWs definitions nevertheless show an increase of nocturnal HWs over the GG,
ACCEPTED MANUSCRIPT
In the Sahel, at the regional scale, annual number of nocturnal HWs increases non-linearly
over the 20th century, while diurnal HWs show very little change (Figure 8d). This pattern is
also identified between 1950 and 2012 using Niamey station data (Figure 8e). Between 1950
and 2012, significant increasing trends in nocturnal HWs are detected in more than 75% of
HW definitions, but not in diurnal HWs (Figure 8f). Number of nocturnal and diurnal HWs is
both slightly increasing over the post-1980s (Figure 8d-f).
However, the post-1980s increase of diurnal and nocturnal HWs seems only robust using the
Sahel regional index (more than 50% of definitions show significant trends; Figure 8f). As for
the Gulf of Guinea coastal regions, trends in the number of HWs are much more pronounced
over the Sahel using n = 3 than using n = 8, which shows very little change (Figure 8d-f).
Furthermore, time-evolution of diurnal and nocturnal heat wave occurrences over the Sahel is
strictly related to the climatic diurnal and nocturnal warming trends. There is no significant
increase of HWs after subtracting the influence of diurnal and nocturnal warming trends
(Figure 8f).
In summary, annual number of diurnal and nocturnal HWs has increase over the Gulf of
Guinea coastal regions over the second half of the 20th century, and even more substantially
over the post-1980s period. While, In Sahel, nocturnal HWs increase between 1950 and 2012,
there is no consensus for robust changes in the number of diurnal HWs. We note that such
increasing trends are primarily driven by the climatic diurnal and nocturnal warming trends.
In addition, trends in the number of HWs are detected much more pronounced when using at
least 3 consecutive days exceeding the 90th percentile in defining HWs, while very little
changes are detected using at least 8 consecutive days. In the absence of human impact data,
HWs definitions using at least 5 consecutive days should therefore be a good compromise.
Heat wave definition using at least 5 consecutive days exceeding a threshold has already been
ACCEPTED MANUSCRIPT
http://www.metoffice.gov.uk/learning/learn-about-the-weather/weather-phenomena/heatwave).
3.3 Validation of climate models and future projections
Observed trends in the percentage of extreme warm days and has been compared with those
detected in CMIP5 model outputs (Figure 9; Table 1). Pre-processing of CMIP5 model
outputs was required to restrict problems related to the spatial resolutions (Table 1). After the
regridding, the comparison between simulated and observed trends has been performed using
a grid-point centred on the stations. The historical trends are then compared with the projected
trends over the 21st century using two RCP scenarios: RCP 2.6 and RCP8.5, i.e. the most
optimistic and pessimistic scenarios (Figure 9).
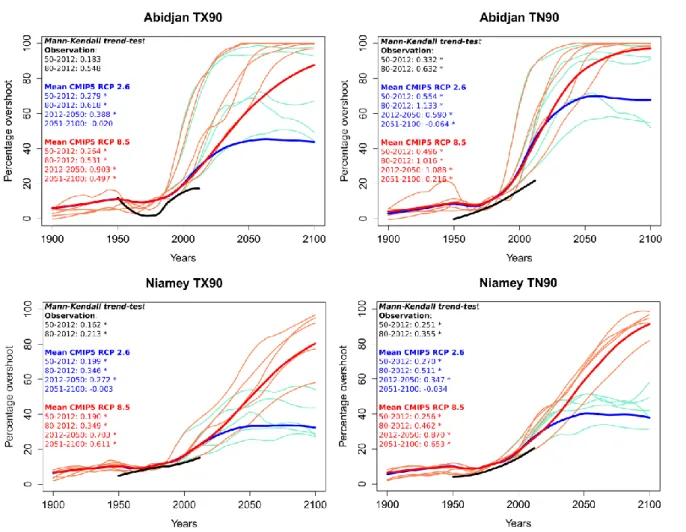
Figure 9. Observed (black lines) and simulated (coloured lines) trends in the percentage of
ACCEPTED MANUSCRIPT
the 20th and 21st centuries. Historical runs have been used between 1900 and 2012, while two
RCP scenarios (i.e., RCP 2.6 and RCP 8.5) are selected to examine the future trends in
West-African extreme temperatures. Results from the individual models are indicated in turquoise
and orange from the RCP 2.6 and RCP 8.5 scenarios, respectively. Red and blue bold lines
show the results from the CMIP5 multi-model mean (MMM). Trends in West-African
extreme temperatures are displayed by adjusting a LOESS smoothing for a span equal to the
duration of observed time series (i.e., 60 years). The trend strength (Sen slope) and statistical
significance (two-sided p-values) are evaluated using a modified Mann-Kendall trend test
accounting for serial correlation. Asterisks indicate significant trends at p = 0.05.
Between 1950 and 2010, observed and simulated trends are broadly similar over the two
regions (Figure 9). Significant increasing trends at p = 0.05, which seem more pronounced
since the last quarter of the 20th century, are identified in extreme warm days and nights
(Figure 9). In the two regions, the trends of extreme warm nights are greater that in the
percentage of extreme warm days. During the historical period, the simulated trends from the
CMIP5 experiments are, however, always overestimated compared to the observations as
determined by the Mann-Kendall’s Sen Slope values (Figure 9). Simulated and observed
trends are clearly diverging during the 1950s and the post-1990s. Although observed trends
are almost linear between 1950 and 2012 (with the exception of the percentage of exceedance
of Tx90p in Abidjan), simulated trends from the CMIP5 models display non-linear trends in
the percentage of extreme warm days and nights, which are only rising since the 1970s
(Figure 9).
In all scenarios, simulated rising trends are likely to be more and more pronounced over the
two regions in the next 50 years. This is consistent with the results of the Mann-Kendall trend
tests, which show much more pronounced trends (and significant at p = 0.05) between 2012
ACCEPTED MANUSCRIPT
exponential increase in the future trend of the West African extreme warm temperatures is
more pronounced using the Tn90p than using the Tx90p except for the period 2051-2100 for
Abidjan. The two scenarios only start to diverge after the first quarter of the 21st century
(Figure 9). During the second half of the 21st century, a significant rising trend of extreme
warm days and nights is likely to persist under the highest greenhouse gas emissions scenario
(i.e., RCP 8.5), while this increasing trend should be stopped according to the lowest
greenhouse gas emissions scenario (i.e., RCP 2.6). There are therefore no significant trends in
the West African extreme temperatures over the second half of the 21st century under the
RCP2.6 scenario.
4. Discussion and conclusion
This study aims in filling the gap in understanding the relationship between trend and extreme
in diurnal and nocturnal temperatures (Tx and Tn) over the Gulf of Guinea area and the Sahel,
through seasonal fluctuations. Two data sets have been used to ensure the robustness of the
results, and to examine the trends at the regional and local scales. To examine the
time-evolution of extreme temperature anomalies and heat waves (HWs), we used the 90th
percentile of daily Tx and Tn anomalies (Tx90p and Tn90p), with respect to the 1951–1980
base period, as threshold. HWs have been defined as a period of consecutive days where
conditions are excessively hotter than normal at that time of the year. There is therefore no
universal definition of HWs, and many definitions could apply depending on the study region.
In the present study, the annual number of diurnal and nocturnal HWs has been investigated
for 3 ≤ n ≤ 8 consecutive days, with n the number of consecutive days.
At the regional and local scales, rising trends in Tx and Tn, which appear more pronounced
over the past 60 years, are identified over the two regions. The trends are characterized, in
particular, by an intensification of: i) nocturnal/Tn warming over the second half of the 20th
century; and ii) diurnal/Tx warming over the post-1980s. These results are therefore
ACCEPTED MANUSCRIPT
Sahel. As reported over most locations over land (Easterling et al., 1997; Braganza et al.,
2004; Wang et al., 2014), nocturnal/Tn warming is greater than diurnal/Tx warming since the
mid-20th century, which results in a decrease in diurnal temperature range (DTR). However,
the opposite tends occurred over the post-1980s period. Vose et al. (2005) show similar
results; the decrease in DTR was attenuated in the early 1980s in many parts of the world.
According to Fontaine et al. (2013), hot spells over the Sahara and Sahel are linked to
anomalous winds disturbing normal circulation in the upper and lower troposphere. Both the
Harmattan and the subtropical airstream are thus weaker, resulting in a considerable increase
in the amount of water vapour both at the surface and in the whole West African atmospheric
column. It is shown here that this type of event should be defined differently in Sahel
(10-20°N) and Guinean (5-10°N) latitudes. In this study we note non-linear increases in extreme
warm days and nights from the second half of the 20th century over the Gulf of Guinea coastal
regions and the Sahel. These trends, in extremes temperatures, are most of time more
pronounced over the post-1980s periods, in particular for extreme warm days. We note,
between 1950 and 2012, increasing trend of extreme warm nights is greater than extreme
warm days; this pattern tends to reverse during the post-1980s period. These increases in the
percentage of extreme warm days and nights are principally driven by the climatic diurnal and
nocturnal warming trends. However, in monsoon season (i.e., JAS) for the Sahel, there is no
diurnal and nocturnal warming and no post-1890s increase in extreme warm days. As regards
maximal and mean duration of diurnal and nocturnal warm spells, over the Gulf of Guinea
coastal regions, there is an increasing, in particular, over the second half of the 20th century.
This is consistent with Trigo et al, (2005), who suggest that the substantial rise in Tn could
lead to increase the risk linked to HWs. In Sahel there is only an increasing of maximal
duration of diurnal and nocturnal warm spell. The most obvious and widely recognized
mechanism from a meteorological point of view for the reduction of DTR is the increase of
clouds, precipitation and soil moisture (Karl et al., 1993; Dai et al., 1999). Zhou et al. (2007)


![[PDF] Descargar tutorial de bootstrap en español pdf | Cours Bootstrap](data:image/gif;base64,R0lGODlhAQABAIAAAP///wAAACH5BAEAAAAALAAAAAABAAEAAAICRAEAOw==)