Publisher’s version / Version de l'éditeur:
Journal of Materials Science, 11, October 10, pp. 1893-1910, 1976-10-01
READ THESE TERMS AND CONDITIONS CAREFULLY BEFORE USING THIS WEBSITE. https://nrc-publications.canada.ca/eng/copyright
Vous avez des questions? Nous pouvons vous aider. Pour communiquer directement avec un auteur, consultez la première page de la revue dans laquelle son article a été publié afin de trouver ses coordonnées. Si vous n’arrivez pas à les repérer, communiquez avec nous à PublicationsArchive-ArchivesPublications@nrc-cnrc.gc.ca.
Questions? Contact the NRC Publications Archive team at
PublicationsArchive-ArchivesPublications@nrc-cnrc.gc.ca. If you wish to email the authors directly, please see the first page of the publication for their contact information.
NRC Publications Archive
Archives des publications du CNRC
This publication could be one of several versions: author’s original, accepted manuscript or the publisher’s version. / La version de cette publication peut être l’une des suivantes : la version prépublication de l’auteur, la version acceptée du manuscrit ou la version de l’éditeur.
For the publisher’s version, please access the DOI link below./ Pour consulter la version de l’éditeur, utilisez le lien DOI ci-dessous.
https://doi.org/10.1007/BF00708268
Access and use of this website and the material on it are subject to the Terms and Conditions set forth at
Significance of water-solic ratio and temperature on the
physico-mechanical characteristics of hydrating 4CaO.A12O3. Fe2O3
Ramachandran, V. S.; Beaudoin, J. J.
https://publications-cnrc.canada.ca/fra/droits
L’accès à ce site Web et l’utilisation de son contenu sont assujettis aux conditions présentées dans le site LISEZ CES CONDITIONS ATTENTIVEMENT AVANT D’UTILISER CE SITE WEB.
NRC Publications Record / Notice d'Archives des publications de CNRC:
https://nrc-publications.canada.ca/eng/view/object/?id=84dddfb0-8433-4cb3-8632-c0629d77fa59 https://publications-cnrc.canada.ca/fra/voir/objet/?id=84dddfb0-8433-4cb3-8632-c0629d77fa59Ser
TH1
317
N2Ld
National Research
Conseil national
709
Council Canada
de recherches Canada
c .
2
BLDG4 N r \ ~ ~ Z E D
- .-
,
SIGNIFICANCE OF WATER SOLID RATIO
AND
TEMPERATURE ON
THE PHYSICO-MECHANICAL
-
CHARACTERISTICS OF HYDRATING 4CaO.Al
0
.Fe
0
2 3 2 3
by
V S , Ramachandran andJ.
J.
BeaudoinReprinted from
Journal of Materials Science
Vol.
11, 1976p. 1893 1910
DBR
Paper No. 709Division of Building Research
Dee echantillone d8alumino-ferrite de tbtracalcium, eous forme de p t t e (rapport eau/eolide de 0.3; 0 , 4 ; 0 . 5 et 1 , O ) ou sou8 une forme comprimbe, eont hydratbe juequ8'a 45 joure b dee tempera- tures de 23'C e t 80eC. Le ep6cimen hydratb & un rapport eau/ eolide de 4 1 3 produit le rapport phaee ~ u b i ~ u e / ~ h a s e hexagonale le plue Clevb. Lea epbcimene trait66 b 18autocalve donnent 18aire de aurface epdcifique la plus faible. Uexpaneion de llCchantillon hydmt6 80'C eet moine marqude que celle de 186chantillon hy- drat6 'a 25 'C. Le produit form6 & une temp6rature plus blevee comporte un remeau de liens 6troite pour l a phase cubique e t une plue grande r6aistance.
J O U R N A L O F M A T E R I A L S S C I E N C E 1 1 ( 1 9 7 6 ) 1 8 9 3 - 1 9 1 0
Significance of water/solid ratio and
temperature on the physico-mechanical
characteristics of hydrating
V.S. R A M A C H A N D R A N , J . J . B E A U D O I N
Division of Building Research, National Research Council o f Cmada, Ottawa, Canada
Tetracalcium alumino-ferrite in paste form, at waterlsolid (WIS) ratios of 0.3,0.4,0.5 and 1 .O, and in pressed form a t effective waterlsolid ratios of 0.13 and 0.08 has been hydrated for up t o 45 days a t temperatures of 23 and 80" C. Some prehydrated samples have also been subjected t o autoclave treatment a t 21
6"
C. Of all the samples studied, that hydrated at a WIS = 0.1 3 at 80" C indicated the highest ratio of cubic phase t o hexagonal phase; that hydrated a t a WIS = 0.08 a t 23" C showed the lowest.Thermograms gave evidence of the formation of hexagonal phases, although X-ray diffraction patterns did not. The specific surface area values depended on the degree of hydration and the nature of the product, autoclaved samples giving the lowest values. During the four days of hydration the specimen hydrated a t 80" C expanded more than that hydrated a t 23" C, but after that time the rates of expansion were reversed: that of the sample hydrated at 80" C was much lower than that of the sample hydrated at 23" C. Microstructural examination of the material formed at higher temperatures and lower waterlsolid ratios indicated a closely welded, continuous network of cubic phase. Such a structure yields a product of higher strength than that of a loose structure formed at higher waterlsolid ratios. A reasonably linear relation was found between porosity and logarithm of microhardness.
1. Introduction dence, however, that significant differences exist, The ferrite phase comprises about 8 t o 13% of an although there is no unanimous opinion on the average Portland cement [I] and is generally rep- sequence of hydration, hydration products, and resented by the formula 4Ca0.A1203 .Fe203. In the mechanical characteristics of hydrated prod- cement literature this is abbreviated to C ~ A F . " In ucts of C4AF formed under different conditions. Portland cement the ferrite phase may have a vari- It is contended that of all cement mineral pastes able composition that can be expressed as the C4AF paste yields lowest strength [2], but it C2(AnF1 -,) where 0
<
n<
0.7. has also been reported that a C4AF paste can A literature survey indicates that of the cement develop better strength than other cement mineral minerals (C3S, C2S, C3A and C4AF) the ferrite pastes [3].
phase has received very little attention with regard Both C3A and C4AF pastes exhibit lower to its hydration and physico-mechanical character- strength than do the silicate phases under normal istics. This may be partly ascribed to the conditions of hydration. This is attributed to the assumption that the ferrite phase and the C3A formation of the cubic phase (C3AH6 or phase behave in a similar manner. There is evi- C3(FA)H6) and consequently it is believed that
*1n cement nomenclature C = CaO, A = Al, O,, F = Fe, 0 , , S = SiO, , and H = H, 0.
O 1976 Chapman and Hall Ltd. Printed in Great Britain.
formation of the cubic phase in the hydration of C3A or C4AF is not conducive to strength devel- opment. In earlier work it was shown that under certain conditions the formation of C3AH6 from C3A or CA in fact results in an enhancement of strength [4, 51
.
Tetracalcium alumino-ferrite (C4AF) hydrates to form hexagonal and cubic hydrates in which F substitutes for A in varying proportions. It was therefore of interest t o deter- mine whether the cubic and hexagonal phases formed in the hydration of C4AF and those formed in the hydration of C3A behave similarly in terms of microhardness, morphology, dimen- sional change, rate of hydration, surface and porosity characteristics.2.
Experimental2.1.
MaterialsTetracalcium alumino-ferrite (C4AF) was supplied by Portland Cement Association, Chicago, Illinois. Chemical analysis was as follows: A1203 =
20.43%; F e 2 0 3 = 32.65%, Ca0 = 45.82% free CaO
<
0.5% and loss on ignition 0.37%. The sur- face area of the material was 3300 to 3400 cm2 g-' (Blaine).Three series of samples were prepared (Table I). The first consisted of two sets made by hydrating C4 AF in a paste form at a water/C4 AF ratio (WIS) of 0.3, 0.4, 0.5 and 1.0 at 23 or 80" C. Details of preparation of the pastes of these cement minerals and of drying procedures are similar to those described elsewhere [ 4 , 6 , 71 . The second series, consisting of four sets, was produced by pressing
TABLE I Materials and methods
the into discs of 1$ or
4
in. diameter at loads of 125 000 or 40001b. The effective W/S ratio was 0.08 and 0.13, respectively. The discs were hydrated at 23 or 80" C. The third series, comprising four sets (three prehydrated and one unhydrated C4AF), was subjected t o autoclave treatment at 21 6"c
for 3 h.2.2. Technique 2.2.1. Microhardness
A Leitz miniload hardness tester was used; the test method employed the Vicker's pyramid indenter placed in a conditioned box free of C 0 2 . Hardness was calculated from the formula
where P = load (g) and d = mean value of the indentation diagonals.
Microhardness indentations were done at five points on the surface of each sample and ten diagonals were averaged for calculation of hardness according to the given formula.
2.2.2.
Length changeSamples cut to rectangular shape approximately 1 by 0.25 in. were exposed continuously in a cell for periods of up to 16 days to water at 23 or 80" C. Length change was measured periodically by a modified Tuckerman gauge extensometer. The details of this method have been described [8].
Series Set Sample form Water/C, AF ratio Temperature Total period Techniques and measurements of hydration of hydration (for most samples)
1 1 Paste 0.3,0.4,0.5, 1.0 23" C < 2 days Microhardness 2 Paste 0.3, 0.4, 0.5, 1.0 80" C < 2 days Length change
2 3 Pressed 0.08 23" C < 45 days Thermogravimetry
4 Pressed 0.08 80" C < 45 days Differential thermal analysis 5 Pressed 0.13 23" C < 2 days Scanning electron microscopy
6 Pressed 0.13 80" C 4 2 days Surface area
Porosity and pore size distribution
3 7 Paste 0.4 Aut'oclaved 3 h Conduction calorimetry
(prehydrated) (216" C)
8 Pressed 0.08 (23" C) Autoclaved 3 h X-ray diffraction
(prehydrated) (216" C)
9 Pressed 0.08 (80" C) Autoclaved 3 h
(prehydrated) (216" C)
10 Pressed
-
Autoclaved 3 h2.2.3. Thermogravimetry ( TG)
Thermogravimetric analysis (TG) of the samples was carried out using a sensitive Cahn balance at a heating rate of 10" C min-' . All runs were carried out in a continuous vacuum.
2.2.4. Differential scanning calorimeter (DSC)
Differential thermograms of the samples were obtained by a differential scanning calorimeter (DSC) supplied as a module to DuPont 900 thermal analysis system. This unit utilizes chromel-constantan for differential temperature measurement. The reference material was ignited a-A120, and the heating rate was 20" C min-' . The differential temperature was registered at a sensitivity of 0.02 mV in-' . Thern~ograms were obtained in air and in each experiment 20mg of the sample was subjected to analysis.
2.2.5. Scanning electron microscope (SEM) Microstructural examination was conducted on fractured pieces of the specimens by means of a Cambridge Stereoscan Mark 2A. The specimens were given a conductive coating of carbon and gold.
2.2.6. Surface area
Surface area was obtained with N2 as the adsorb- ate by a Numinco-Orr surface area-pore volume analyser. Each sample was dried at 110" C for 3 h prior to analysis.
2.2.7. Porosity
The Arninco-Winslow Porosimeter was used t o determine pore size distribution and porosity of both unhydrated and hydrated specimens. This instrument measures pore size diameter down to 0.012 pm.
2.2.8. Conduction calorimeter (CC)
A conduction calorimeter containing six chambers, supplied by the Institute of Applied Physics, Delft, was used to determine the rate of heat develop- ment in C4AF hydrated at 23 or 8 0 " ~ . A measured amount of water was added to the samples by syringe so that heat development from the very moment of contact of water and C4AF could be determined.
2.2.9. X-ray diffraction (X R D)
X-ray powder photographs were obtained with a
Philips Camera using a CuKa source. The relative intensities of the lines were obtained by Densitometer traces of the powder photographs. 3. Results and discussion
3.1. Differential scanning calorimeter The rate of hydration, amount and type of hy- dration product formed in the hydration of C4 AF depend on the initial waterlsolid ratio, on tem- perature, and on duration of hydration. These characteristics were examined by techniques such as DSC, TG, XRD and CC.
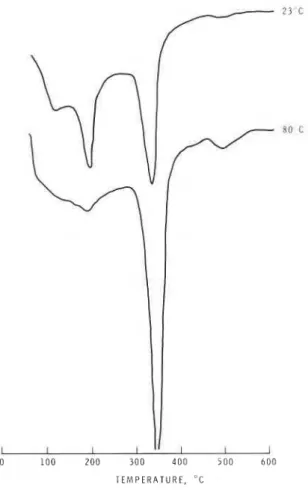
Representative differential scanning curves are shown (Figs. 1 to 4) of C4AF pressed discs (effec- tive W/S = 0.08 and 0.13), hydrated at 23, 80 or 216" C. The pastes (W/S = 0.3, 0.4 and 0.5) hy- drated for two days at 23" C indicate, in addition to a small endothermic effect at about 100°C (presumably due to desorbed water), endothermal peaks of moderate intensity at about 170 to 180" C and 480 to 490°C and an endothermal
T E M P E R A T U R E , " C
Figure I DSC curves for C, AF hydrated for 2 days at a W / S ratio of 0.13.
peak of very large intensity in the range 300 to 350" C. The first endothermal effect at 170 to 180°C may be attributed to dehydration of the hexagonal phase C4(AxFy)HI3 ; that at 300 t o 350" C partial dehydration of the cubic phase C3(AxFy)H6 to C3(AxFy)H1.S and that at 480 to 490" C to dehydration from the remaining 1.5 molecules of H,O [9]. In the hydration of C4AF the hydrated phases formed may be solid solutions containing different amounts of Fe and Al, so that in the formula for the hexagonal and the cubic phases, x
+
y = 1.A dark brown mass sometimes observed in the hydrated phases of C4AF is thought to be due to hydrated ferric oxide [ l o ] . The DSC curves indicate a small endothermal effect at about 150" C in some of the samples, merging with the
endothermal effect at bout 170 to 180° C. It is possible that this corresponds to the dehydration effect of hydrous ferric oxide and/or C2(AxF,)
H a . The results make it clear that all pastes
contain a mixture of hexagonal and cubic phases, the sample hydrated at a W/S ratio of 0.3 con- taining less cubic hydrate than the other samples. The results also indicate that C4AF hydrates more slowly than the C3A phase. Previous investigations have demonstrated that the C3A phase hydrates within a very few minutes to the cubic phase. Even at 5 min C3A paste made at a W/S ratio of 1.0 con- tains little or no hexagonal phase [6]
.
The DSC curves of C4AF pastes hydrated at 80" C for 2 days show features similar t o those of C4AF pastes hydrated at 2 3 " ~ . Treatment at 80" C, however, seems to have promoted the con-
30 S E C 6 M I N 30 M I N 2 H 1 DAY 0 100 200 300 400 500 600 TEMPERATURE, "C
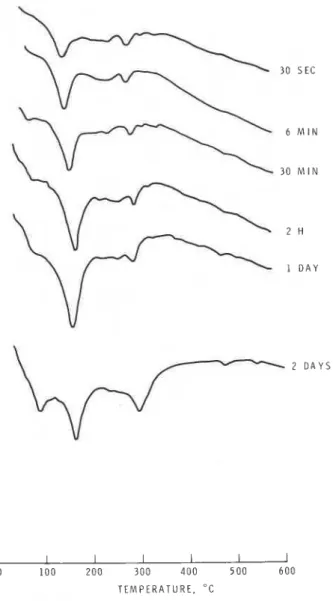
Figure 2 DSC curves of C, AF hydrated at 23' C at a W/S ratio of 0.08. 1896
version of the hexagonal to the cubic phase, as was evident from the decreased intensity of the endothermal peaks occurring in the range 160 to
170" C.
The degree of hydration of C4AF in pressed form (Fig. 1, effective W/S = 0.13, 2 days) is less than that observed for pastes and this was obvious from the intensity of the peaks resulting from the cubic phase. At 23" C, both hexagonal and cubic phases are present. Only a very small amount of the hexagonal phase and a larger amount of the cubic phase are formed at 80" C (Fig. 1). There is a considerable amount of the hexagonal phase in the paste at 80" C, whereas at W/S = 0.13 there is only a small amount of the hexagonal phase at the same temperature.
The hydration behaviour of a pressed C4AF
sample (effective W/S = 0.08 at 23°C) was
followed for up t o 2 days (Fig. 2). Small amounts of the hexagonal and cubic phases formed at about 30sec; with the progress of hydration up to 1 day an increasing amount of the hexagonal phase formed; at 2 days the cubic phase increased at the expense of the hexagonal phase. The rate of hydration of C4AF to the cubic form (in the sample prepared at W/S = 0.08 and 23" C) was slower than that in other samples.
Compared with hydration at 23" C, hydration at 80" C (W/S = 0.08) enhances the rate of forma- tion of the cubic phase (Fig. 3). The cubic hydrate form is present even after 5 sec, and after 2 days there is practically no hexagonal phase. The rate of hydration, however, is still lower than in pastes at
23" C. Formation of the cubic phase within a few seconds suggests the possibility of direct formation of the cubic phase from the anyhdrous C4AF
6 M I N 1 H 2 D A Y S I I 1 I I I 1 0 1 0 0 200 3 0 0 4 0 0 5 0 0 6 0 0 TEMPERATURE, " C
W I S - 0 4 0 P R E H Y D R A T E D A T 2 3 C W I S = 0 . 4 0 P R E H Y D R A T E D A T 8 0 C P R E S S E D P R E H Y D R A T E D A T 2 3 C P R E S S E D P R E H Y D R A T E D A T 8 0 C T E M P E R A T U R E , ' C
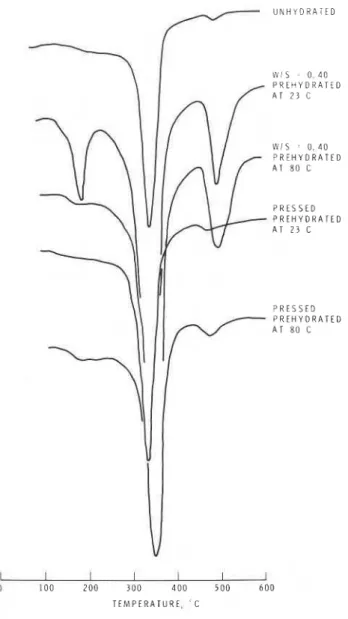
Figure 4 DSC curves of autoclaved C, AF (prehydrated).
phase. Evidence of this was obtained in C 3 A
hydrated at 80" C at a very low W/S ratio [4]. As discussed above, some of the samples were not hydrated t o any significant extent even after 2 days. It is thought that further hydration could have been effected by autoclaving prehydrated samples at 216" C. Results for some of the acto-
claved samples are shown in Fig. 4. After
autoclaving, pressed specimens (prehydrated at 23 or 80' C) showed further hydration, as evidence by the absence of the hexagonal phase and an increase in the amount of the cubic phase (Figs. 2 to 4). Autoclave treatment is known to accelerate hydration reactions in cementitious materials.
In autoclave treatment the amount of cubic phase in pressed samples is less than that observed in pastes cured at ambient temperature. A direct
autoclave treatment of unhydrated pressed C4 AF
produced less cubic phase than was present in paste samples hydrated at 23 or 80" C. Slow dif- fusion of water in the pressed sample and the formation of an impermeable layer of the cubic phase over the anhydrous phase may explain this behaviour. Autoclave treatment of the prehy- drated paste at 80' C (W/S = 0.4) resulted in the disappearance of the hexagonal phase and an in- crease in the intensity of the peak (at about 500' C), corresponding t o the cubic phase. In the
autoclaved, prehydrated sample cured at 23" C, W/S = 0.4, there was an increased amount of cubic phase although the hexagonal phase did not disap- pear. The immediate cause of the hexagonal phase is not obvious. If the original hexagonal phase does not convert to the cubic phase with autoclave treatment it is possible that the cubic phase has encapsulated the hexagonal phase at this W/S ratio.
3.2. Thermogravimetric analysis
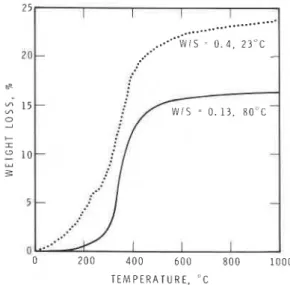
Thermogravimetric analysis (TG) of ten samples (Table I) was carried out and two typical curves are shown in Fig. 5. Depending on how the sample was made, two types of curve (with two or three regions of weight loss) could be discerned. The first region extended to about 250" C; a second region continued to about 500" C. Beyond this
T E M P E R A T U R E . " C
Figure 5 Thermogravimetric analysis of hydrated C, AF.
temperature and up to 1000" C a slow rate of loss occurred.
The TG curve in Fig. 5 for the sample prepared at a W/S ratio of 0.4 shows three regions of weight loss. Another obtained at a W/S ratio of 0.13 shows two discernible regions. The three regions correspond to the three endothermal effects in the DSC curves. The first weight loss denotes dehy- dration from the hexagonal phase; the second and third represent a stepwise loss of water from the cubic phase.
Assuming that the weight loss up to about 250°C is due to dehydration of the hexagonal phase and that the rest is due to dehydration of the cubic phase, the amounts formed in any sample could be computed (Table 11). For calcu- lation purposes the hexagonal phase is denoted by the formula C4AH,, and the cubic phase by C3AH6: In spite of the assumptions made in these calculations, an approximate estimation of the relative amounts of the phases formed under dif- ferent conditions could be made. Generally, the amounts of the hexagonal and cubic phases calcu- lated from TG results are in agreement with the relative intensities of the endothermal effects cor- responding to the hexagonal and cubic phases.
3.3.
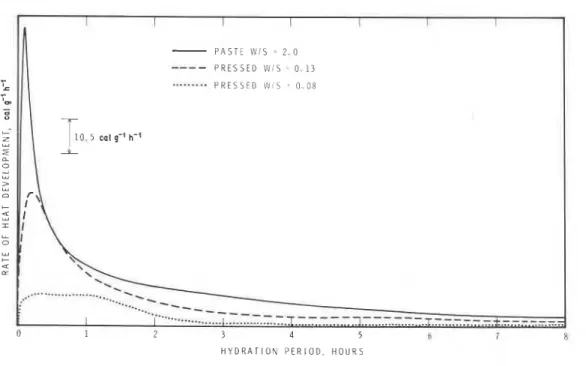
Conduction calorimeterThe rates of heat development in hydrating C4AF at 23" C and at W/S ratios of 2.0, 0.13 and 0.08 were followed by conduction calorimetric curves (Fig. 6). All the samples exhibit an immediate heat effect that represents both the heat of wetting and the onset of hydration. The peak for the maxi- mum rate of heat development occurs earlier and its amplitude is higher as the W/S ratio increases. At a W/S ratio of 0.08 only a hump extending up
T A B L E I1 Estimation of hexagonal and cubic phases by thermogravimetric analysis
Sample preparation Amounts of phases (%) Cubic phase
w / s Temperature Hexagonal Cubic Hexagonal phase
( " C) 0.3 2 3 14.5 53.3 3.68 0.4 2 3 15.2 61.2 4.03 0.5 23 9.2 71.9 7.82 1 .O 2 3 13.4 79.7 5.95 0.4 80 9.8 74.7 7.62 1 .O 80 8.2 71.5 8.72 0.13 2 3 13.2 38.5 2.92 0.13 80 2.8 52.8 18.86 0.08 2 3 8.7 17.2 1.98 0.08 80 4.0 28.5 7.13
I I I I I I
-
P A S T E W i S = 2 . 0----
P R E S S E D LUIS 0 . 1 3....----.
. - , P R E S S E D L V i S 0 . 0 8 c-
-
z + T L1
1 0 . 5 col g-' h-'-
B A a 0 2-
2...
-...
...
---Z_
....
...
...
----
---
...
----
---
---
-
---
-
I-...
I..-...
1 --J -.,-A ..A. 0 1 2 3 4 5 h 2 H Y D R A T I O N P E R I O D , H O U R SFigure 6 Conduction calorimetric curves for C, AF hydration at 2S0 C.
0 1 2 3 4 5 6 7 8 9 1 0 1 1 1 2 T I M E O F H Y D R A T I O N , H O U R S 1900
to 2 h is evident. As the W/S ratio decreases the permeability of the sample also decreases and the diffusion of water is slow, resulting in diminution of hydration rate.
Heat developed at different time intervals up to 12 h is shown in Fig. 7. Within the first 30 min a considerable amount of heat is developed, the values being 26.4, 14.8 and 4.2 calg-' at a W/S ratio of 2,0.13 and 0.08, respectively. The heat of hydration of C4AF is about 100calg-' [ l l ] . Computing t h s value (and neglecting the heat of wetting) the samples at W/S ratios, of 2,0.13 and 0.08 evolve about, 25, 15 and 4% of the total theoretical heat within the first 30min. The rate of heat development beyond 12 h is very low. The percentage of hydration at 12 h for samples pre- pared at a W/S ratio of 2.0, 0.13 and 0.08 is, respectively, 90, 44 and 16%. This is consistent with the results of TG (Table 11).
3.4. X-ray diffraction (XRD)
X-ray diffraction analysis is useful in identifying and estimating unhydrated C4AF at different times of hydration. Fig. 8 t o 10 represent densi- tometer tracings of X-ray films. Where peaks are not distinct the exact d values can be determined directly, using the film. Unhydrated C4 AF Figure 7 Influence of W/S ratio on heat development (at different intervals of time) in the hydration of C,AF.
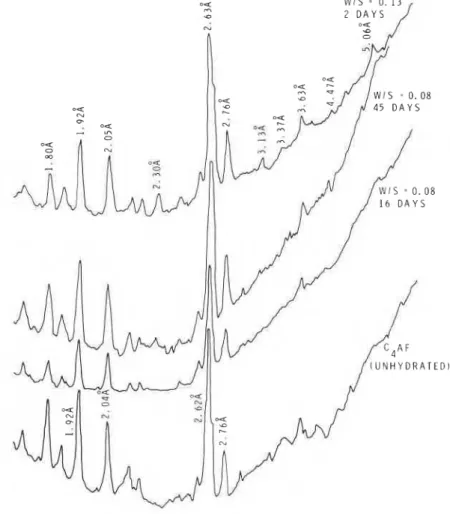
Figure 8 Densitometer tracings of C, AF hydrated at a W/S ratio of 0.08 or 0.13 at 23' C.
exhibits principal peaks at about 2.76, 2.63 and 1.92. The hydrated specimens show, in addition to peaks due to C4AF, peaks at 2.30, 3.15, 3.36,
4.45 and 5.13 typical of cubic hydrate. The cubic phase may be solid solution containing different amounts of A1203 and F e 2 0 3 . None of the samples clearly demonstrated the presence of the hexagonal phase, although it was indicated in the thermograms. The sample hydrated at a W/S = 1.0 shows a peak corresponding to the formation of a carboaluminate.
Densitometer tracings for C4AF hydrated at 80" C at W/S ratios of 0.3 to 1.0 give evidence of the cubic hydrate and residual C4AF. A semi- quantitative estimation of the relative amounts of C3(A, F)H6 and C4AF was made by determining the ratio of the peak intensity of C3(A, F)H6 : C4AF(2.3 812.76 8 ) . In all pastes these ratios for samples obtained at 80" C (1.36 to 1.58) were
higher than those obtained at 23" C (1.21 to 1 SO), results that are in agreement with TG and DSC results.
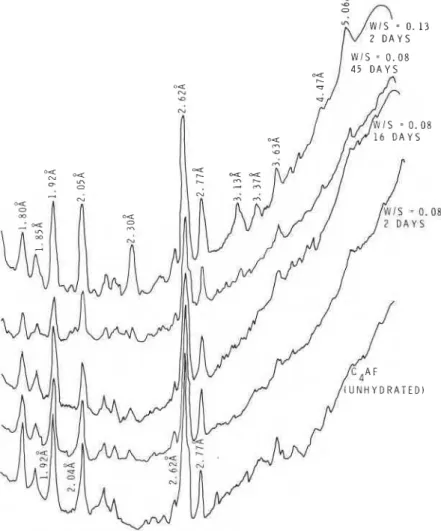
Figs. 8 and 9 compare the relative intensities of peaks in samples hydrated at W/S ratios of 0.08 and 0.13 at 23 or 80" C. Even after hydrating for 16 days the sample prepared at a W/S ratio of 0.08 (23" C) failed to show the formation of the cubic phase, but at 45 days a small quantity of the cubic hydrate formed. Samples hydrated at a W/S ratio of 0.13 showed at 2 days the formation of the cubic phase at 23°C (Fig. 8). At 80" C, at both 0.08 and 0.13 W/S ratios (2 days), the cubic form was identifiable, being more at a W/S ratio of 0.13. The amount of cubic phase formed in 2 days at 0.13 W/S exceeded that formed even after 45 days with W/S ratio of 0.08. For example, the ratio of the intensity of lines corresponding to C3(AF)H6/ C4AF for W/S = 0.13 (80" C for 2 days) was 0.86,
= 2 D A Y S 0 1 3
Figure 9 Densitometer tracings of C,AF hydrated at a W/S ratio of 0.08 or 0.13 at 80' C.
whereas at a W/S = 0.08 (80" C for 45 days) the corresponding value was only 0.33.
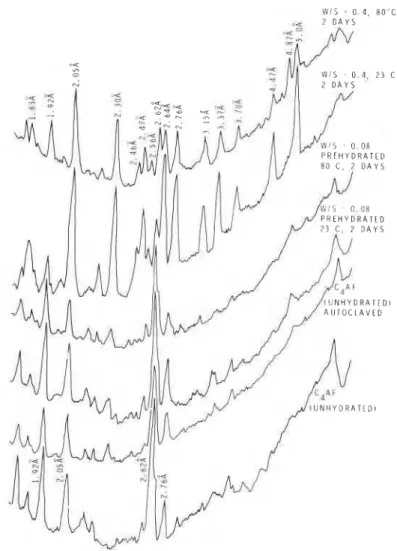
Some prehydrated specimens were autoclaved and their densitometer tracings obtained (Fig. 10). The two top curves refer to the prehydrated specimens prepared at a W/S of 0.4 and 23 or 80" C . Both samples hydrated further under auto- clave treatment to produce more of the cubic phase, the prehydrated sample at 80" C showing greater conversion. There was also some indication of gibbsite in these samples. The prehydrated pressed specimens (W/S = 0.08, at 23 and 80" C) exhibited increased amounts of the cubic phase. The unhydrated C4AF does not hydrate any more than the prehydrated pressed samples. A direct formation of the cubic phase on the unhydrated particle may impede the ingress of H 2 0 and greatly retard or inhibit further hydration.
X-ray data generally supported the thermal 1902
analysis findings, but this method did not provide evidence of the hexagonal phase, probably because it was not noticeably crystalline and existed in small quantities. The DSC method appears to be more accurate in detecting and estimating even small quantities of hydrated products of C4AF.
3.5.
Surface areaSurface area determination not only provides insight into the hydration processes but also enables a study of the mechanism of strength de- velopment. In the hydration of C4AF the surface area depends on the amount of unhydrated C4AF and on the hydrated products. Unhydrated C4AF has a surface area of 0.6 m2 g-'
.
Samples hydrated at 23" C at W/S ratios of 0.08, 0.13, and 0.3 exhibited areas of 1.8, 10.9 and 17.2m2 g-', re- spectively.W I S = 0 . 4 . 8 0 L C
2 D A Y S
Figure 10 Densitometer tracings for autoclaved samples.
has a higher surface area than the cubic form [I21
.
The larger amount of hexagonal phase, a higher degree of hydration, and a higher W/S ratio may promote the highest surface in the sample hy- drated at a W/S ratio of 0.3. A low area for the sample hydrated at a W/S ratio of 0.08 is caused by the low degree of hydration.Samples cured at 80" C form more of the cubic hydrate than do corresponding samples hydrated at 23°C. Samples hydrated at W/S ratios of 0.08 and 0.13 (80" C) have surface areas of 8.5 and 6 m2 g-'
,
respectively. Possibly the formation of a larger amount of hexagonal phase at a W/S = 0.08 may partly explain increased surface area at this W/S ratio. At 23" C and W/S = 0.08 and sample had a surface area of only 1.8; the higher value at 80" C (8.5 m2 g - l ) is evidently due to a greater degree of hydration. The surface area of thesample prepared at a W/S of 0.13, however, de- creased from 10.9 (23" C) to 6.0m2 g-l (80" C), due possibly to the decrease in the amount of the hexagonal phase (Fig. 1).
Autoclave treatment of the prehydrated speci- mens resulted in a highly consolidated structure. In the micrograph it appears as a virtified body and is expected t o show least surface area of all the samples. Autoclaved samples from prehydrated specimens, prepared at W/S = 0.08 (23" C), 0.3 (23" C, 17.2 mZ g-
'
) and 0.4 (80" C), show SI.
;ace areas of only 0.2, 2.5 and 2.1 m2 g-', respi kively. A pressed sample of unhydrated C4AF (0.6m2 g-l), autoclaved, shows a surface area of 0.5 m2 g-'
.
Surface area thus permits a qualitative assess- ment of the manner in which the hydrated material has crystallized.3.5.
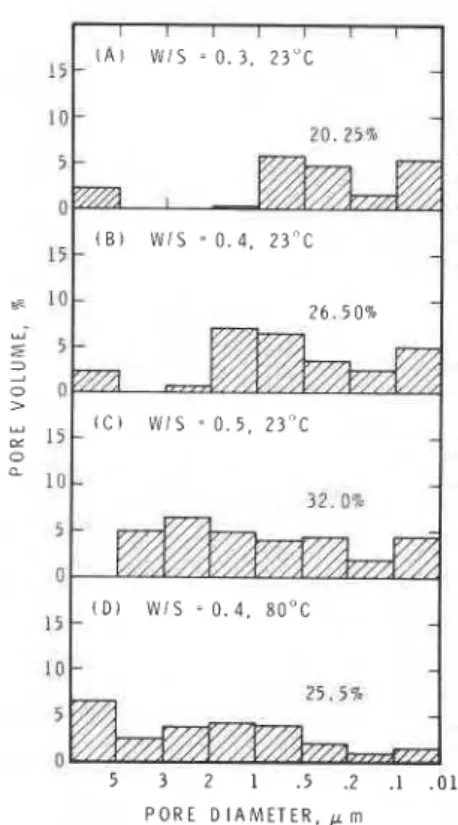
PorosityImportant physical parameters that change during the hydration of cementitious materials are porosity and pore size distribution. Pore size dis- tribution curves for samples of C4AF hydrated at different water/solid ratios are given in Figs. 11 to 13. Fig. 11 represents the pore size characteristics of pastes hydrated at W/S ratios of 0.3, 0.4 and 0.5; total porosity values are, respectively, 20.25, 26.5 and 32.0%, increasing with the initial W/S ratio. The pore sizes in the sample hydrated at W/S = 0.5 are distributed over a wide range. It is apparent that as the W/S ratio increases the pores of larger diameter (1 to 5 pm) appear. The sample formed at 80°C has a slightly reduced porosity compared with that formed at 23O C (Fig. 11, B
and D). Thermograms of these samples show that both contain large quantities of the cubic hydrate. At 80" C a slight increase in the number of larger pores is also apparent. This is probably connected with a larger amount of C3AH6 and with the ex- pansion that may occur when hydration is carried out at 80' C.
Total porosity of pressed, unhydrated C4 AF is 33.25% (Fig. 12). Hydration at room temperature
I l I I I I I I A l W I S = 0 . 3 . 2 3 ° C I 5 ( D l W I S = 0 . 4 . 8 0 ° C 1 0
1
5 3 2 1 .5 .2 .1 ,015 P O R E D I A M E T E R , p mFigure I 1 Pore size distribution in C,AF hydrated at
different W/S ratios. (A) W/S 0.3, 23'C; (B) W/S 0.4,
23" C: (C) W/S 0 . 5 , 2 3 " C; (D) W/S 0.4,80° C.
decreased this value to 7.7576, with a further de- crease to 3.5% when hydration took place at 80°C. The decrease in porosity may be due to products of hydration filling the pores. Slight increase in pores
>
5 pm may be caused by expan- sion due to hydration. At 80°C hydration~ B H Y D R A T E D A T 2 3 ° C I C
P O R E D I A M E T E R . pm
Figure 12 Pore size distribution in C, AF hydrated at W/S
ratio o f 0.13. (A) Pressed C,AF (unhydrated); (B) hydrated at 23' C; (C) hydrated at 80" C.
I A I P R E S S E D C n A F I U N H Y D R A T E D l
l 5
I
-I
( [ C I H Y D R A T E D A T 8 0 ° C
I
P O R E D I A M E T E R , p m
Figure 13 Pore size distribution in C, AF hydrated at W/S
ratio o f 0.08. (A) Pressed C,AF (unhydrated); (B)
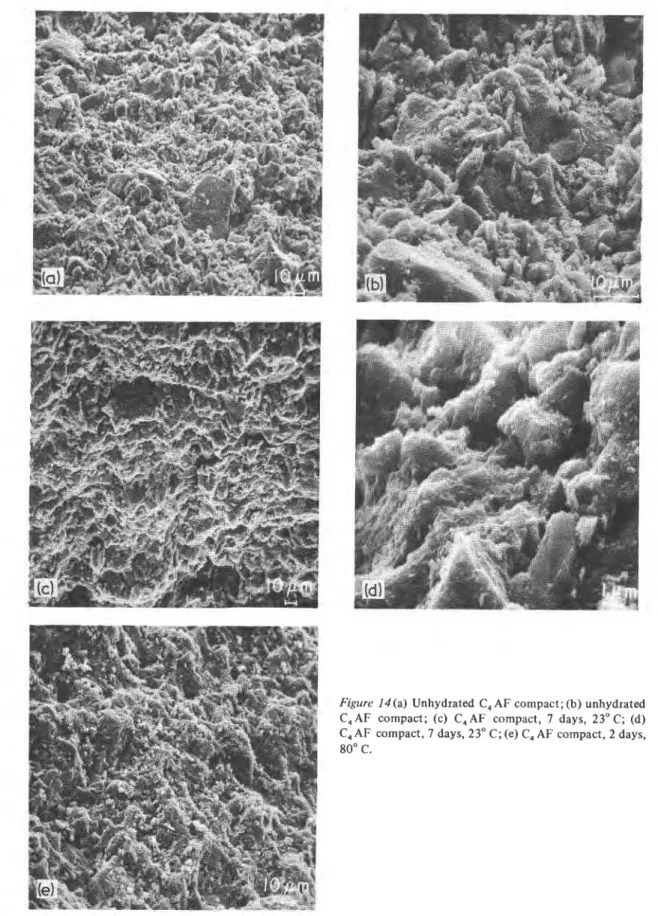
Figure I 4 ( a ) Unhydrated C, AF compact; (b) unhydrated
C,AF compact; (c) C,AF compact, 7 days, 23OC; (d)
C,AF compact, 7 days, 23" C; (e) C, AF compact, 2 days,
Figure 14 (f) C, A F compact, 7 days, 80" C; (g) C, AF compact, 7 days, 80" C; (h) C, AF compact, w/S = 0.13,2 days, 23" C; (i) C, AF compact, W/S = 0.13,2 days, 80" C.
eliminates pores of sizes from 0.1 to 5 pm existing in unhydrated C4AF. Smaller pores, 0.015 to 0.1 pm are increased by hydration, possibly because the hydrated products fill the original pores. The unhydrated pressed C4AF specimen with an effective W/S ratio of 0.08 has a porosity of 23.75% (Fig. 13), less than that obtained with an effective W/S ratio of 0.13 (Fig. 12). Hydration at 23 and 80" C decreases the porosity to 8.25 and 5.75%, respectively. Total porosity at 80" C is less because more hydration has taken place at this temperature than at 23' C (Figs. 2 and 3).
3.6. Microstructure
I SEM study of a number of samples was carried out
and a few typical micrographs are shown (Figs. 14 and 15). Samples hydrated at 23" C at W/S ratios of 0.3, 0.4, 0.5 and 1.0 indicate a cubic mor- phology. It was also observed that as the W/S ratio reduced, the system became more compact.
When subjected to hydration at 80° C pastes showed a better crystallinity, especially at higher W/S ratios, because the higher temperature accel- erates hydration of C4AF and conversion of the hexagonal to the cubic form. Compared with products at 23" C the particles in these pastes were closer together.
Fig. 14 illustrates the morphological features of C4AF hydrated at low W/S ratios of 0.08 and 0.13 (series 2, Table I). At such low W/S ratios the
Figure 15(a) C, A F compact prehydrated at 23' C and autoclaved at 216" C, 300 psi. (b) C, AF compact prehydrated at 23" C and autoclaved.
hydration products (at 23 and 80" C) form a much denser structure than do pastes made at W/S ratios of 0.3 to 1 .O. The porosities in this system are lower, varying from 3.5 to 8.25% in comparison with 20.25 to 32% in samples hydrated at W/S ratios of 0.3 to 0.5. The micrograph of unhy- drated, pressed C4AF shows particles of various sizes and shapes (Fig. 14a and b). This sample (W/S = 0.08) was hydrated at 23" C and shows a structure not much different from that of unhy- drated C4AF (Fig. 14c and d). This is to be expected because a very small amount of hy- dration occurs on the surfaces of these samples (Fig. 2). Very low porosity conditions may not allow sufficient water for hydration and the dif- fusion of water would be low. At 80" C, however, much more hydration occurs (Figs. 2 and 3) and the micrographs (Fig. 14c) give evidence of hy- dration and inter-particle bonding. In unhydrated C4AF the particles are more discrete (Fig. 14a). At higher magnifications the sample formed at 80°C shows good welding of the particles and a vitrified appearance (Fig. 14e to g). This type of micro- structure is typical of strong bodies in cemen- titious systems [ l 3 ] . In a C3A-H,O system hydrated at 80" C there was evidence of cubic morphology with a welding effect [5]
.
Among pressed samples hydrated at a W/S ratio of 0.13, that hydrated at 23°C shows a platy, cubic morphology (Fig. 14h); DSC curves indicate the presence of both hexagonal and cubic phases (Fig. 1). At 80" C the system assumes a very dense
structure, characteristic of the compacted system formed at a W/S ratio of 0.08 (Fig. 14i).
When subjected to autoclave treatment, prehy- drated C4AF at 23' C has a compact, vitrified appearance (Fig. 15a and b). The sample not sub- jected to autoclave treatment has a more open
structure. Hydration under autoclaving conditions may promote direct formation of the C3(AF)H6 phase; the reaction is very rapid, and since porosity is very low, crystallization to well-formed cubic phases does not become evident. XRD and DSC data indicate that a large amount of C3(AF) H6 is formed with autoclave treatment.
3.7.
Length changeLength change measurements during the hydration of cementitious bodies provide valuable infor- mation about the mechanism of hydration [8, 14-
171
.
Fig. 16 shows length changes in C4AF samples hydrated at 23 and 80" C at an effective waterlsolid ratio of 0.08. At early periods the sample hydrated at 80" C shows slightly higher expansion than that hydrated at 23O C; but beyond four days the rate of expansion of the sample hydrated at 80" C is much lower than that hydrated at 23" C.In the hydration of C3A also, the sample hy- drated at the higher temperature showed decreased expansion with increasing period of hydration [4]
.
Initial expansion at the higher temperature may represent the formation of the hexagonal and cubic phases at the original sites of C4AF. UnderI I I I I I I I Figure 16 Length changes of
r l M E O F H Y D R A T I O N , D A Y S
this condition there is more probability that par- ticles will create expansive forces than under the condition of solution and precipitation. At 23" C the hexagonal form forms first and is converted t o the cubic phase only gradually, probably by the solution crystallization mechanism. Hexagonal phases, having higher molar volume, produce expansive forces continuously. Very low expan- sion rates following hydration for long periods at 80°C are mainly due to the slow rate of hy- dration. At this temperature the direct formation of the cubic phase on the unhydrated particle may decrease the diffusion of water [4].
3.8.
MicrohardnessMicrohardness measurements generally support the conclusions drawn from investigations of porosity, length change, hydration and micro- structure. Microhardness has been found to correlate with compressive strength in a cemen- titious system [12]. In pastes hydrated at 23°C and W/S ratios of 0.3 to 1.0, it was found that the lower the W/S ratio the higher the microhardness values : 38 and 6 kg mm-2, respectively, at W/S ratios of 0.3 and 0.5. Microstructural results also reveal that samples obtained at lower W/S ratios showed a more compact structure. This is reflected in low porosity values for samples prepared at a low W/S ratio. Samples obtained at a W/S ratio
<
0.4 shbwed higher microhardness values when hy- drated at 80" C than at 23" C. It is probable that bonds form between the cubic phases at low W/S ratios.Significant increases in microhardness were observed in samples hydrated at an effective W/S ratio of 0.08. Unhydrated, pressed C4AF had a value of 32 k g m m - 2 ; that hydrated at 23 and 80" C had values of 1 15 and 197 kg mm-2, re-
hydrated
spectively. The sample hydrated at 23" C contains both hexagonal and cubic hydrates and that hy- drated at 80" C contains mainly cubic hydrate. It is widely believed that the formation of C,AH, (the cubic phase) is not conducive to strength development. The present results, as well as previous work [4,5]
,
show that high strengths can abe obtained in hydrated calcium aluminate and calcium ferro-aluminate systems containing the cubic phase. Microstructural examination of these samples showed them to have a dense structure (Fig. 14); and porosities were lower than in those hydrated at a higher W/S ratio.The strength of hydrated C4AF depends on how well the particles of unhydrated C4AF are brought into contact with each other (initial po- rosity), the degree of hydration, and the nature of the products. Where the effective W/S ratio was 0.13 the microhardness values of C4AF hydrated at 23 and 80" C were, respectively, 87.4 and 177.2 kg mm-2, values less than those obtained at a W/S ratio of 0.08. The initial porosity of pressed samples with effective W/S ratios of 0.08 and 0.13 was, respectively, 23.75 and 33.25% (Figs. 12 and 13).
The higher strengths at very low W/S ratios may be attributed to the direct formation of the cubic phase on the original sites of C4AF. This results in a closely welded, continuous network with en- hanced mechanical strength. At very low W/S ratios even a heat-treatment at 80°C may not completely convert the C4AF to the cubic form in 2 days. A few samples prehydrated at 23 or 80" C were, therefore, autwlaved at a temperature of 216" C. This treatment induced further hydration and bond formation and resulted in further strength development. The unhydrated pressed C4AF sample and two samples prehydrated at 23
and 80" C, having initial microhardness values of 32, 115 and 197 kgmm-2, gave on autoclave treatment values of 277, 186 and 277 kg m m - 2 , respectively. Even the paste-hydrated C4AF at a W/S ratio of 0.3 increased in microhardness from 38 to 59kgmm-' under autoclave treatment. Autoclaving, however, produced further hy- dration, which would decrease porosity and thus increase microhardness.
P O R O S I T Y . %
Figure 17 Porosity-microhardness relation for C, AF- H, 0 system.
It has generally been observed that of the parameters investigated the factor that seems to correlate well with microhardness or strength is porosity. A plot of porosity versus log micro- hardness yields a linear type of relation with some scatter (Fig. 17) and a correlation coefficient of 97.8. Some scatter was expected since the points referred to may represent different morphological features as well as different proportions of phases.
4.
ConclusionsThe formation of the cubic phase in the hydration of C4AF should not necessarily be con- sidered detrimental to strength development. In the C4AF-H20 system the cubic phase yields high strengths provided that the waterlsolid ratio is low. Autoclave treatment produces maximum strengths. Direct formation of the cubic phase at the sites of the unhydrated C4AF particles may occur at higher temperatures of hydration.
Although the bonds between the cubic phases are more discernible in the C3 A-H2 0 system, hy- drated C4AF shows a closely welded structure, as
in a vitrified body.
The differential thermal technique is more sen- sitive in identifying the hexagonal and cubic phases than the XRD method. The TG method can be used to estimate the relative proportions of the hexagonal and cubic phases.
Strengths cannot be directly correlated with surface area or degree of hydration, but mor- phology with a dense structure generally signifies
greater strength in this system. A plot of porosity
versus log microhardness yields a reasonably linear relation. At a particular porosity, however, there is some indication that the sample formed at 80' C shows higher microhardness than that formed at other temperatures.
Total expansion of the C4AF sample hydrated at 80" C is less than that of the sample hydrated at
23O C; and all expansions in this system are less
than those observed in the C3A-H20 system.
Acknowledgements
The authors acknowledge with thanks the very
valuable experimental contributions of
G. M. Polomark in most of the experiments. Grati-
tude is also due E. G. Quinn and P. J. Lefebvre for
assistance in the electron microscopic and X-ray diffraction work. This paper is a contribution from the Division of Building Research, National Research Council of Canada, and is published with the approval of the Director of the Division.
References
1. R. H. BOGUE, "The Chemistry of Portland Cement" (Reinhold, New York, 1955) pp. 32-33.
2. R . H. BOGUE and W. LERCH, Ind. Eng. Chem. 26
(1934) 837.
3. Yu. M. BUTT, V. M. KOLBASOV and V. V . TIMASHEV, High Temperature Curing of Concrete under Atmospheric Pressure, Proceedings of the Vth International Symposuim Chemistry of Cements, Tokyo, Vol. 3 (1968) 437.
4 . V. S. RAMACHANDRAN and R. F . FELDMAN, J . A p p l . Chem. Biotechnol. 23 (1973) 625.
5 . Idem, Cement and Concrete Res. 3 (1973) 729.
6. V . S. RAMACHANDRAN, ibid 3 (1973) 41.
7 . Idem, J. A p p l . Chem. Biotechnol. 22 (1972) 1125.
8. R. F. FELDMAN, P. J . SEREDA and V. S. RAMACHANDRAN, Highway Res. Rec. No. 6 2 (1964) p. 106.
9 . R. SANZHAASUREN and E . P . ANDREEVA, Kolloid 2. 33 (1971) 568.
crete" (Edward Arnold, Glasgow, 1970) p. 183. 11. W. LERCH and R . H. BOGUE, J. Res. Not. Bur.
Stan. 12 (1934) 645.
12. V. S. RAMACHANDRAN and R. F. FELDMAN,
Cement Tech. 2 (1971) 121.
13. A . TRAETTEBERG and V . S. RAMACHANDRAN,
J. Appl. Chem. Biotechnol. 24 (1974) 157.
14. R. F. FELDMAN and V . S. RAMACHANDRAN, J .
Amer. Ceram. Soc. 49 (1966) 268.
15.
v.
S . RAMACHANDRAN and R . F. FELDMAN, J .Appl. Chem. Biotechnol. 17 (1967) 328.
16. V. S . RAMACHANDRAN, P. J . S E R E D A and R . F. FELDMAN, Nature (London) 201 (1964) 288. 17. P. J. S E R E D A , R. F. FELDMAN and V . S . RAMACHANDRAN, Amer. Ceram. Soc. Bull. 44 (1965) 151.
This publication i s being distributed by the Division of Building R e s e a r c h of the National R e s e a r c h Council of Canada. I t should not be reproduced in whole o r in p a r t without p e r m i s s i o n of the original publisher. The Di- vision would b e glad to b e of a e s i s t a n c e in obtaining such permission.
Publications of the Division m a y b e obtained by m a i l - ing the a p p r o p r i a t e r e m i t t a n c e (a Bank, E x p r e s s , o r P o s t Office Money O r d e r , o r a cheque, m a d e payable to the R e c e i v e r G e n e r a l of Canada, c r e d i t NRC) to the National R e s e a r c h Council of Canada, Ottawa. K1A OR6. Stamps a r e not acceptable.
A l i s t of allpublications of the Division i s available and m a y be obtained f r o m the Publications Section, Division of Building R e s e a r c h , National R e s e a r c h Council of Canada, Ottawa. KIA OR6.