Publisher’s version / Version de l'éditeur:
Canadian Journal of Civil Engineering, 10, 4, pp. 670-680, 1983-12
READ THESE TERMS AND CONDITIONS CAREFULLY BEFORE USING THIS WEBSITE. https://nrc-publications.canada.ca/eng/copyright
Vous avez des questions? Nous pouvons vous aider. Pour communiquer directement avec un auteur, consultez la première page de la revue dans laquelle son article a été publié afin de trouver ses coordonnées. Si vous n’arrivez pas à les repérer, communiquez avec nous à PublicationsArchive-ArchivesPublications@nrc-cnrc.gc.ca.
Questions? Contact the NRC Publications Archive team at
PublicationsArchive-ArchivesPublications@nrc-cnrc.gc.ca. If you wish to email the authors directly, please see the first page of the publication for their contact information.
NRC Publications Archive
Archives des publications du CNRC
This publication could be one of several versions: author’s original, accepted manuscript or the publisher’s version. / La version de cette publication peut être l’une des suivantes : la version prépublication de l’auteur, la version acceptée du manuscrit ou la version de l’éditeur.
Access and use of this website and the material on it are subject to the Terms and Conditions set forth at
Engineering applications of new probabilistic seismic ground-motion
maps of Canada
Heidebrecht, A. C.; Basham, P. W.; Rainer, J. H.; Berry, M. J.
https://publications-cnrc.canada.ca/fra/droits
L’accès à ce site Web et l’utilisation de son contenu sont assujettis aux conditions présentées dans le site LISEZ CES CONDITIONS ATTENTIVEMENT AVANT D’UTILISER CE SITE WEB.
NRC Publications Record / Notice d'Archives des publications de CNRC:
https://nrc-publications.canada.ca/eng/view/object/?id=2828f3c9-5baa-4945-95cd-92512437f1fe https://publications-cnrc.canada.ca/fra/voir/objet/?id=2828f3c9-5baa-4945-95cd-92512437f1feSer
TH1
IN21d
I
I
National Research
Conseil national
la.
1135
I
$
Council Canada
de recherches Canada
c . 2
E
m
ENGINEERING APPLICATIONS OF NEW PROBABILISTIC SEISMIC GROUND-MOTION MAPS OF CANADA
by A.C. Heidebrecht, P.W. Basham,
J.H.
Rainer, and M.J. BerryReprinted from
Canadian Journal of Civil Engineering Vol. 10, No. 4, 1983
p. 670
-
680DBR Paper No. 1135
Division of Building Research
Price $1.50 OTTAWA N R C
st00
R C ~ : ~
LIBRARY
e4- 02-
? 3
B J B L I O T H ~ Q U E
Rwh.
B&im.
C N R C-
I C I @ T NRCC 22665Reprinted from
Canadian
Journal of
Civil Engineering
Reimpression du
Revue
canadienne de
genie civil
IEngineering applications of new probabilistic
seismic ground-motion maps of Canada
A. C. HEIDEBRECHT,
P.
W.
BASHAM,J.
H.
RAINER, ANDM.
J.
BERRY
Volume
10
Number 4
1983
Pages 670-680
NRCC 22665 DBR Paper No 1 135 Pride $1.50 INat~onal Research Consell nat~onal
I*
Counc~l Canada de recherches Canada Rmld In Canada by K G Campbell CorporatlonEngineering applications of new probabilistic seismic ground-motion maps
of Canada1"
A . C. HEIDEBRECHT
Faculw of Engineering, McMaster University, Hamilton. Onr., Canada L8S 4L7
P. W. BASHAM
Earth Physics Branch, Energy, Mines and Resources Canada. Ottawa, Onr., Canada K I A 0Y3
J . H. RAINER
Division of Building Research, National Research Council of Canada, Ottawa, Ont., Canada K I A OR6
AND
M. J. BERRY
Earth Physics Branch, Energy, Mines and Resources Canada, Ottawa, Ont., Canada K I A 0Y3
Received April 14, 1983 Manuscript accepted July 12, 1983
New peak horizontal acceleration and velocity zoning maps with a probability of exceedance of 10% in 50 years and seven seismic zones are developed from new probabilistic strong seismic ground-motion estimates for replacement of the 1970 seismic zoning map in the National Building Code of Canada. The adoption of a probability of exceedance of 10% in 50 years produces reference seismic ground motion appropriate to the level of protection afforded by provisions of the current code; the use of two ground-motion parameters, the relative levels of which vary considerably throughout the country, provides independent reference levels for structures having short and long fundamental periods.
For calculating seismic base shear, a new seismic response factor is derived in which seismic forces for long-period structures are directly proportional to zonal velocities, and for short-period structures proportional to zonal accelerations, with an upper limit on the acceleration/velocity ratio applicable for any location. To maintain the same design standard as provided by the current code, the base shear is calibrated to remain the same, on average, in large population centres in regions of moderate to high seismic risk. The resulting changes in the base shear applicable at various locations reflect the improved estimates of seismic risk, in particular the introduction of additional zones in the higher risk regions of the country and the higher levels of short-period ground motion estimated for some regions of eastern Canada.
These and associated changes in seismic design provisions have been recommended for adoption in the 1985 edition of the National Building Code of Canada.
Les auteurs Ctablissent, dans cet article, de nouvelles cartes montrant les zones d'accC1Crations horizontales et de vitesses maximales avec une probabilite de dkpassement de 10% en 50 ans ainsi que sept zones ~Cismiques. Ces cartes sont Ctablies a partir de nouvelles tvaluations probabilistes des mouvements skismiques importants du sol en vue du remplacement de la carte des zones sCismiques de 1970, du Code National du Bgtiment du Canada.
Le choix d'une probabilitk de depassement de 10% en 50 ans permet une rCfCrence appropriee des mouvements sCismiques Cquivalente au niveau de protection exigC par les dispositions du code en vigueur; I'utilisation de deux paramktres de mouvement du sol qui ont une grande variation a travers le pays permet d'obtenir des niveaux de rCference indCpendants pour les structures ayant de petites et de grandes periodes fondamentales.
Pour le calcul du cisaillement 5 la base, un nouveau facteur de rkponse skismique est dCveloppt de f a ~ o n a c e que les forces skismiques pour les structures ayant une grande ptriode soient proportionnelles aux vitesses de la zone concernke, et pour les structures ayant une petite pCriode, proportionnelles aux accCICrations, avec une limite suptrieure sur le rapport accClCration/ vitesse applicable a n'importe quelle rCgion.
Pour maintenir les mCmes standards de design que le code en vigueur, le cisaillement a la base est calibre de f a ~ o n a rester le mCme, en moyenne, dans les centres populeux des rCgions a risque sCismique modCrC ou ClevC. Les changements resultants dans le cisaillement
a
la base sont applicables a une variCt6 de regions et refletent les estimations amCliorCes des risques ~Cismiques, en particulier I'introduction de nouvelles zones dans les regions du pays a risques plus ClevCs et les niveaux plus ClevCs de sCismes a faible pCriode rencontrks dans I'est du Canada.Ces changements ainsi que les changements inhCrents a ceux-ci dans les dispositions du design sCismique ont CtC re- commandes pour adoption dans I'Cdition de 1985 du Code National du Bstiment du Canada.
[Traduit par la revue]
Can. I. Civ. Eng. 10, 670-680 (1983)
'Contribution from the Earth Physics Branch No. 1064.
'A substantial amount of the material in this paper was presented at the Annual Conference of the Canadian Society for Civil Engineering, Ottawa, Ontario, June 1-3, 1983, and also at the Fourth Canadian Conference on Earthquake Engineering, Vancouver, British Columbia, June 15- 17, 1983.
HEIDEBRECHT ET AL. 67 1 Introduction
In Canada, the primary application of seismic zoning information is made within the context of the seismic loading provisions of the National Building Code of I Canada (NBCC). In the first edition of the code (1941)
the seismic provisions appeared in an appendix and were based on concepts presented in the 1937 U.S. Uniform Building Code. In the 1953 edition of NBCC the earthquake loading requirements were updated and
, placed in the main text, and referenced the first seismic
I
zoning map of Canada, which was subsequently de- scribed by Hodgson (1956). Uzumeri et al. (1978) have described these and subsequent developments in NBCC seismic loading provisions up to the 1977 edition of the code.
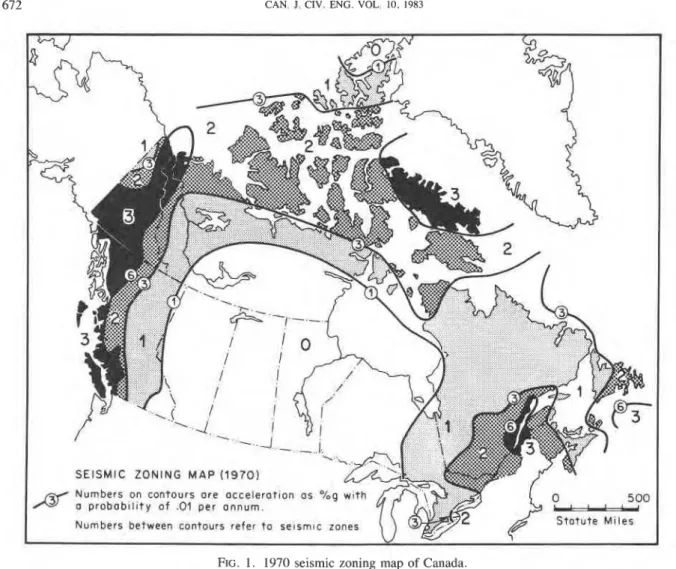
The Hodgson (1956) seismic zoning map, a qualita- tive "seismic probability map" based on knowledge of the larger earthquakes and general considerations of the regional extent of earthquake zones, was replaced in the 1970 NBCC by the 1970 Seismic Zoning Map of Canada (Fig. 1). This, the first strictly probabilistic map, was developed from the work of Milne and Davenport (1969) (see also Whitham et al. 1970), and displayed contours of peak horizontal acceleration at a
,
probability of exceedance of 0.01 per annum, which were used as boundaries for the four seismic risk zones. Although some of the seismic loading provisions have changed (Uzumeri et al. 1978), the 1970 seismic zon- ing map has been referenced in subsequent editions of the NBCC up to and including the 1980 edition of the code (Associate Committee on the National Building Code 1980).The Earth Physics Branch of Energy, Mines and Resources Canada has recently derived new probabilis- tic seismic ground-motion maps of Canada displaying both peak horizontal acceleration and peak horizontal velocity (Basham et al. 1982). The purpose of the present paper is to describe how the new seismic zoning maps, which are based on both acceleration and veloc- ity, can be incorporated into the seismic loading pro- visions of NBCC 1980. This is preceded by a brief description of the development of the new probabilistic ground-motion maps, and followed by an outline of engineering applications of the new maps that do not fall within the normal provisions of the NBCC.
Development of ground-motion maps
The 1970 seismic zoning map (Fig. 1) was developed using extreme-value statistics applied to the catalogue of known Canadian earthquakes to compute probabili- ties of peak acceleration exceedance at a grid of sites throughout the country (Milne and Davenport 1969). A recent review of methods of estimating seismic risk in Canada (Weichert and Milne 1979) has shown that the
method developed by Cornell (1968) is more appropri- ate for the preparation of new maps. In particular, the Cornell method enables the incorporation of geological and tectonic information, when available, to assist in defining earthquake source zones; in contrast, the extreme-value method implicitly assumes that future large earthquakes will occur in the same locations as the historic events. The Cornell method has been adopted for the new maps, and a full description of their devel- opment is given by Basham et al. (1982); here we briefly summarize the procedure with reference to the schematic of the methodology shown in Fig. 2.
The seismicity of Canada and adjacent active regions has been modelled as 32 earthquake source zones, each based on the distribution of historic and recent earth- quakes and any geologic or tectonic evidence that can be employed to constrain the probable extent of future earthquake activity (Fig. 2a). For each of the zones a magnitude recurrence relation, M versus log N, where N is the cumulative number of earthquakes exceeding magnitude M (Fig. 2b), is derived from estimated rates of past earthquakes. A maximum magnitude is adopted for each source zone and used to place an upper bound on the recurrence relation. There is seldom definitive evidence for this maximum, and in most cases a mag- nitude about half a magnitude larger than the largest historic event has been adopted. Attenuation relations that predict ground motion as a function of magnitude and distance (Fig. 2c) are required for the ground- motion parameters being mapped. The parameters se- lected are peak horizontal acceleration (PHA) and peak horizontal velocity (PHV), using the attenuation re- lations of Hasegawa et al. (1981). For a particular site, or for each grid point on a map, a distribution function for probability of exceedance ( ~ i ~ . 2 d ) is computed by numerical integration of ground-motion parameter con- tributions from all relevant source zones. The results for all grid points can be displayed as contours of the ground-motion parameter at a fixed probability, or of probability at a fixed level of ground motion.
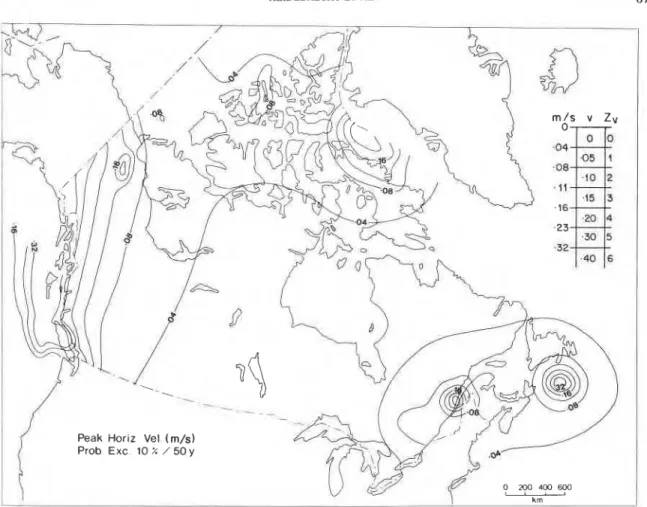
The total model that has been developed, including source zone descriptions, magnitude recurrence rela- tions, and attenuation relations, as well as the computer programs used to perform the risk analysis, is main- tained on a computer file by the Earth physics Branch. Using this package, PHA and PHV can be computed for a variety of probabilities of exceedance for the whole country, for specific regions of interest, or for individ- ual site locations. For purposes of this paper, of recom- mending seismic zoning maps for Canada and seismic loading provisions to replace those in NBCC 1980, contour maps of PHA and PHV at a probability of exceedance of 10% in 50 years are shown in Figs. 3 and 4, respectively. The contour levels and the
CAN. 1. CIV. ENG. VOL. 10, 1983
SElSMlC ZONING MAP (1970)
FIG. 1. 1970 seismic zoning map of Canada. Development of zoning maps
The method described above provides contour maps of peak ground-motion exceedance at selected proba- bilities. These estimates necessarily have uncertainties associated with them, which vary with our knowledge and understanding of the seismicity of the region in question. Because of the nature of earthquakes it is not possible to define accurately their size and location and the ground motion effects that they will produce. The uncertainty also increases as the selected probability decreases; Weichert and Milne (1979) and Basham et al. (1979) have considered the question in some detail. On the basis of these studies and others it is reasonable to consider the estimates mapped in Figs. 3 and 4 as being uncertain by approximately a factor of 2.
Recognizing the unavoidable uncertainties associated with any predictive estimate of seismic ground-motion behaviour, and the practical problems in enforcing building codes based on smoothly varying contour maps, it is recommended that the next version of NBCC, like the current one, use seismic zones rather
than contour maps. The understanding of Canadian seismicity may improve sufficiently in the future that contour maps can realistically be used for code pur- poses, but it is premature to consider this at the present time.
In developing the contour maps for defining zones one must choose the appropriate probability and the strong ground-motion parameters that are most useful for engineering design. These considerations are de- scribed in the following.
Probability level
In common usage, levels of probability are fre- quently expressed in terms of return period of an event rather than in terms of the probability of occurrence in a given time period. The two approaches are equivalent mathematically, but the former carries with it the con- notation that a statement is being made about seismic risk over long periods of time. Thus, a return period of
500 years implies a prediction of risk far into the future based on information over an equally long period of
HEIDEBRECHT ET AL. 673 (a) (b) EARTHQUAKE MAGNITUDE SOURCE ZONES R E C U R R E N C E .c./..*. A MAGNITUDE comphation grid (cl (dl
GROUND MOTION SITE OR G R I D ATTENUATION CALCULATION
DISTANCE GROUND MOTION
FIG. 2. Schematic of probabilistic seismic ground motion methodology showing: (a) earthquake source zones and com- putational grid; (b) magnitude recurrence relations terminated at upper-bound magnitude; (c) ground-motion attenuation; and (d) probability distribution of ground motion parameter at a site or grid point.
time in the past. For present purposes, therefore, it is strongly recommended that probability be expressed as the probability of exceedance of a strong ground motion in the average lifetime of a building. Thus, the current level of probability used in the NBCC 1980 version of the seismic zoning map (Fig. 1) can be expressed as a return period of 100 years, a 1% probability of exceed- ance per annum, or approximately 40% probability of exceedance in 50 years. Only the last readily gives an impression of the risk of ground-motion exceedance over the lifetime of a structure.
The design loads that result from the static provisions of NBCC 1980 were originally set or calibrated empir- ically, which necessarily then and still to a degree now, is based on building practice and experience in Califor- nia. The probability level used as the basis for the calculation of the seismic ground motion in the 1970 map (40% exceedance in 50 years) is, therefore, not the probability of exceedance that is associated with the seismic design loads. The probability level that should be associated with these design loads is not known precisely, but it is much lower than that now used as the basis for the zoning maps. To this extent, the seismic risk probability level can be considered somewhat arbi- trary and required only as a means of assessing relative risk levels across the country. However, experience
during the last 20 years has shown that the values of peak ground acceleration provided by the 1970 zoning map are frequently used in non-code applications in the mistaken belief that this will result in levels of protec- tion comparable to that afforded by the NBCC. For the reasons given above, this is not the case.
The state-of-the-art in normal engineering practice is not yet such that the concept of probability can be carried through the whole design process. However, current experience suggests that a probability of 10% exceedance in 50 years for seismic ground motion is more nearly appropriate to the effective design levels provided by the current code. Thus it is recommended that this probability be employed for new zoning maps. This probability has the further advantage of corre- sponding to that employed by the ATC-3 guidelines in the U. S .A. (Applied Technology Council 1978), and will thus facilitate comparison of seismic risk maps across the Canadian - American border.
Strong ground-motion parameters
NBCC 1980 uses PHA to specify the level of strong ground motion that a structure must be designed to withstand without major failure or loss of life. This would be adequate if experience showed that all build- ing damage correlated well with peak acceleration; but this is not the case, especially for modem tall buildings having fundamental periods greater than approximately 0.5 s. Estimates of PHA are most appropriate to periods centred near 0.2 s, while estimates of PHV are-appro- priate to periods centred near 1 s. Thus, the parameters PHA and PHV together have the potential for signifi- cantly improving the seismic provisions contained in NBCC 1980.
Strong seismic ground motion can be characterized in many ways. Peak acceleration, velocity, and displace- ment are the most commonly employed in engineering applications, but sustained levels and duration are also important in fully characterizing the ground motion and estimating damage potential. However, for NBCC ap- plications PHA and PHV are considered sufficient for revised zoning maps. Special considerations in zones of high-risk and non-code applications of the proposed maps are treated in a later section.
Zone boundaries
The 1970 seismic zoning map (Fig. 1) has four zones: zone 0 denotes negligible risk of earthquake damage, while zones 1, 2, and 3 reflect a risk of minor, mod- erate, and major damage, respectively. Zones 0 to 2 are bounded by upper and lower contours, but zone 3 in- cludes all areas with peak acceleration exceeding 6% g, at a probability of exceedance of 0.01 per annum. In some regions of zone 3, particularly near the seis- mically active areas along the west coast, computed accelerations exceeded 50% g.
674 CAN. J. CIV. ENG. VOL. 10, 1983
FIG. 3. Peak horizontal acceleration with a probability of exceedance of 10% in 50 years, recommended as a basis for an acceleration zoning map.
The specific contour levels that have been employed in Figs. 3 and 4 have been adopted, following trials to determine in which resulting zones various-cities in eastern and western Canada would fall with different choices of contours. There is an inevitable subjective and judgemental aspect to this choice based on our perception (and our understanding of the perception of others) of the relative risk between western and eastern Canada (e.g., Vancouver versus Montreal) and within western and eastern Canada (e.g., Victoria versus Van- couver and Montreal versus Quebec City). Where pos- sible, it is also desirable to avoid having contours, which become zone boundaries, bisecting large urban areas. This will minimize the need for "committee decisions" to alter contour locations to ~roduce more acceptable zone boundaries. These considerations led to the 0,0.04,0.08,0.11,0.16,0.23,0.32 (g and m/s) scheme in Figs. 3 and 4.
The choice of the units for PHA and PHV in Figs. 3 and 4 (g and m/s) is a matter of convenience; but the choice of the same numbers for the PHA and PHV contours requires some justification. The energy con-
tent in the spectra of strong seismic ground motion tends to show a comer period between the velocity-flat and acceleration-flat segments near 1 s. The peak ground-motion bounds suggested for dynamic analysis in the Commentary to the 1980 NBCC, which were developed to match the average spectrum for a large number of recorded strong ground motions, have this comer period at 0.6 s. Converting numerically equal g
and m/s to common units (e.g., m/s2 and m/s), this comer perod is 0.27~, i.e., approximately 0.6 s. There- fore, the comer period implicit in the numerically equivalent contours on Figs. 3 and 4 is the same as the corner period of the acceleration- and velocity-flat levels in a typical strong ground-motion spectrum.
In fact, the relative levels of PHA and PHV do vary considerably across Canada. If they did not, i.e, if the PHV/PHA ratio, or the comer period discussed above, were indeed constant and independent of the types of earthquakes contributing to the ground motion, a sepa- rate velocity zoning map would not be needed; it could be simply scaled from the acceleration map. From Figs.
FIG. 4. Peak horizontal velocity with a probability of exceedance of 10% in 50 years, recommended as a basis for a velocity zoning map.
from about 0.5 to 2.5. This ratio is high, i.e., velocity dominates, at sites that are influenced by large earth- quakes at a distance (e.g., Prince George). It is low, i.e., acceleration dominates, at sites that are influenced by moderate earthquakes nearer-by (e. g .
,
Montreal).Zonal acceleration and velocity ratios
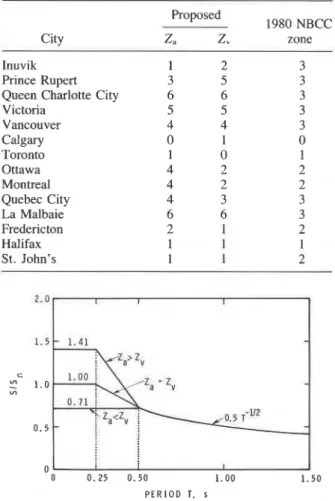
For purposes of applying the zoning maps to the building code, two new dimensionless variables, a and v, are proposed to denote the zonal acceleration and velocity ratios. The acceleration ratio, a , as is A in NBCC 1980, is the ratio of the peak horizontal ground acceleration to the acceleration due to gravity; the ve- locity ratio, v , is the ratio of the peak horizontal velocity to a velocity of 1 m/s. A summary of the zone defini- tions in terms of acceleration and velocity ratios is given in Table 1. The proposed zonal ratios, which would be applied uniformly throughout each zone, are a pro- gression of values intermediate between the zonal con- tour limits. The nominal zonal ratio for Zone 6 is 0.40. However, it may be appropriate to employ larger values in certain regions of Zone 6, as discussed further in a later section.
Comparisons for selected Canadian cities
Table 2 shows the proposed zones, and the 1980 NBCC zones, for selected Canadian cities. The applica- tion of the new zones in the code and the implications for some of the cities is discussed in the following section. We note here that all of the western Canadian locations in Table 2 have velocity zones greater than, or equal to, their acceleration zones; the eastern Canadian locations have acceleration zones greater than, or equal to, their velocity zones.
Application of zoning maps to the building code
With the seismic zoning maps established in terms of ground-motion parameters for a given probability of exceedance, their application to a building code re- quires a quantitative link between the zoning maps and the desired response and performance of buildings dur- ing earthquakes. It is the purpose of this section to describe the changes to the 1980 NBCC seismic re- sponse factor and base shear formula that are required to accommodate the proposed zoning maps.
676 CAN. J . CIV. ENG. VOL. 10, 1983 TABLE I . Definition of seismic zones
Range of peak acceleration
Seismic zone and velocity in g and m/s, Zonal
z.,
z,
respectively (see Figs. 3 and 4) ratio0 <0.04 0 I 0.04 to <0.08 0.05 2 0.08 to < O . 1 1 0.10 3 0.11 to <0.16 0.15 4 0.16 to <0.23 0.20 5 0.23 to <0.32 0.30 6 20.32 0.40*
*Larger values may be appropriate (see text).
[I] (V)19so = ASKIFW
where A is the acceleration ratio (the 1980 zonal value at a probability of exceedance of 0.01 per annum), S the seismic response factor, K the structural behaviour coefficient, I the importance factor, F the foundation factor, and W the dead load. For buildings of normal importance, and for good quality foundation condi- tions, both I and F are equal to one. Using these values, since it is beyond the scope of the paper to consider changes in I and F , rearranging eq. [l] yields the fol- lowing normalized base shear coefficient
L2]
(V/m)1980 = AS1980Since it is not intended to consider the effect of varying or modifying K in this paper, it is included in the left hand side of eq. [2]. This format for the normalized base shear coefficient will be used in the remainder of this paper to discuss the effects of changes in seismic zoning.
The 1980 NBCC seismic response factor is given by
S = 0.5 T - ' ' ~ 5 1.0
where T is the natural period of the building in question. The equality in this expression is applicable to the medium and long period range (velocity amplification), whereas the limiting value is associated with the short period range (acceleration amplification).
It is proposed that the new base shear formula be given in the form
[3] V = vS,,, KIFW
where v is the zonal velocity ratio. A new seismic response factor, S,,,, is described graphically in Fig. 5
in terms of a parameter S,, which is to be determined. The proposed normalized base shear coefficient is therefore given by
[41 (Vim) = vSnew
As can be seen from the foregoing, it is proposed that the seismic forces for long-period structures
TABLE 2. Proposed and 1980 NBCC seismic zones for selected Canadian cities
Proposed
1980 NBCC
City
za
Z, zoneInuvik Prince Rupert Queen Charlotte City Victoria Vancouver Calgary Toronto Ottawa Montreal Quebec City La Malbaie Fredericton Halifax St. John's P E R I O D T, s
RG. 5 . Proposed seismic response factor (S) in terms of parameter S. to be determined (see text). The response factor is illustrated for the three cases Z, < Z,, Z, = Z,, and
z,
> Z".(T 2 0.5 s) be directly proportional to zonal velocities. Forces for short-period structures (T 5 0.25 s) are pro-
portional to zonal accelerations, with the exception that the effective acceleration zone is allowed to deviate by only one zone (up or down) from the velocity zone at any site. The forces in the intermediate period region
(0.25 s
<
T<
0.5 s) are determined by~linear interpo-lation between the two transition periods (see Fig. 5).
The advantage of this arrangement is to provide a transition region that is in the neighbourhood of the normal response spectrum comer-period (approximate- ly 0.4 s), while maintaining the acceleration bound comer period of 0.25 s at the same place as in NBCC
1980. For long periods the forces vary with period, as
in NBCC 1980. This scheme avoids large shifts in the transitional period for different Z, and Z , combinations, while permitting seismic forces to vary as the Z , / Z ,
HEIDEBRECHT ET AL. 677
ratio varies. 0 . 1 5 I r
The restriction that the effective acceleration zone
----
a ) NBCC-1980 ZONE 3 can deviate by a maximum of one from the velocity7
\zone in effect at a given site will affect several locations (e.g., Montreal and Ottawa; see Table 2) and requires some explanation. In locations where the actual acceleration/velocity ratio is high, the ground acceler-
ations will often be high frequency and of short duration 0.05
-
in character; these accelerations will consequently notproduce amplified response to the same extent as would
5
velocity. Thereforejt is reasonable to impose an upper 2
to velocity (i.e., T r 0.5 s) are designed for the seis- mic forces associated with the velocity; i.e., it is not deemed appropriate to allow low site accelerations to reduce forces for T 2 0.5 s. This is accomplished by not allowing the 'effective' acceleration to be more than one zone lower than the velocity zone. At locations where the velocity zone, Z,, is zero but the acceleration zone, Z,, is non-zero, it is considered desirable to re- quire that all structures have a minimum level of seis- mic resistance. For these cases, the condition is imposed that Z, = 1.
The value of S, is determined by calibrating the pro- posed seismic shear forces to those in effect in NBCC 1980. The calibration is based on the principle that the new seismic forces should be equivalent, in an average way across the country, to those of NBCC 1980. Since the adoption of the new estimates of seismic risk has altered in some detail the geographical distribution of seismic risk within Canada, this equivalence can only be attained in a cumulative sense by summing or inte- grating these effects across the country.
The approach used here is to calibrate by equating the sum of the weighted base shear coefficients for
T 2 0.5 s (1980 and new; i.e., equations [2] and [4]) for the ten Canadian cities in 1980 zones 2 and 3 with populations greater than 100 000 (Chicoutimi, Ham- ilton, Montreal, Ottawa, Quebec City, St. Catherines, St. John, St. John's, Vancouver, and Victoria, accord- ing to the 1976 metropolitan census). It is desirable to give more weight to cities in higher seismic zones, so the weighting factors were the populations multiplied by the 1980 zonal accelerations. This procedure re- sulted in S, = 0.44.
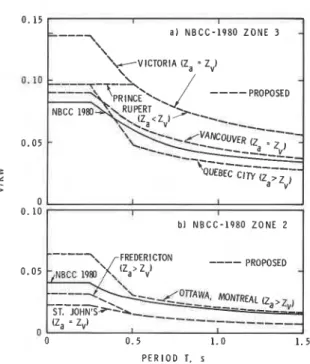
Figure 6 shows plots of 1980 and new base shear coefficients for a selected group of Canadian cities that are located in NBCC 1980 zones 2 and 3. The effect of differing Z, and Z, combinations can be seen clearly. The comparison of Prince Rupert (Z,
<
Z,) and Victoria (Z, = Z,) shows the effect of different acceler- ation zones for cities that have the same velocity zone (Z, = 5). A similar comparison can be made forlimit oh the 'effective' acceleration/velocity ratio.-For
-
0locations with low actual acceleration/velocity ratios, it 0 . 1 0 is necessary that the structures that would be sensitive
PROPOSED
I I
I I
b l NBCC-1980 ZONE 2
PERIOD T, s
FIG. 6. Comparison of proposed normalized base shear
with NBCC 1980 for selected cities in NBCC 1980 seismic zones 2 and 3.
Fredericton ( Z ,
>
Z,) and St. John's (Z, = 2,).For the cities included in Fig. 6 the largest changes in base shear coefficient from NBCC 1980 occur for Victoria (increase of 65%) and St. John's (reduction of 45%). The increase for Victoria is due primarily to the inclusion of more zones in the higher risk regions of the country, thereby permitting the risk in Victoria to be distinguished from that in Vancouver, whereas both cities are in NBCC 1980 zone 3. The reduction for St. John's arises primarily from a change in seismic risk estimate with the change in method.
Moderate- and long-period structures (T 2 0.5 s) in Vancouver, Ottawa, and Montreal have very little change in force levels (an increase of about 10%). How- ever, there are increases (55%) for the short-period structures in Ottawa and Montreal, owing to the accel- eration zone being higher than the velocity zone. Quebec City has some decrease (18%) for moderate- to long-period structures, and an increase (17%) for short- period structures, due to the fact that Z,
>
Z,. It should be noted that both the NBCC 1980 and the above pro- posed new base shears are unfactored loads; i.e., they need to be multiplied by the load factor of 1.5 to obtain the design base shear.Non-NBCC applications
Dynamic analysis
In the commentaries on dynamic analysis in the 1975, 1977, and 1980 NBCC an average elastic re-
678 CAN. 1. CIV. ENG. VOL. 10, 1983
sponse spectrum for the structure in question was devel- oped by scaling the acceleration portion of the peak ground-motion bounds to the acceleration for the local- ity in question, and then applying acceleration, veloci- ty, and displacement amplification factors that depend on the assumed level of damping. As indicated earlier, the relative levels of the 10% in 50 years acceleration and velocity vary considerably across Canada; the PHV/PHA ratio has a range of about 0.5 to 2.5. (A
similar range is indicated in the most recent proba- bilistic acceleration and velocity maps of the United States prepared by Algexmissen et al. (1982).) These variations can now be incorporated into response spec- tra employed for dynamic analysis by independently scaling the acceleration and velocity peak ground- motion bounds to the PHA and PHV for the locality in question. Peak displacement attenuation relations for Canada cannot yet be derived because the data base for this parameter is too sparse (Hasegawa et al. 1981). In view of this, it is recommended that the displacement- velocity comer period near 5 s be maintained for pur- poses of setting peak displacement bounds.
With a probability of exceedance that is deemed to provide reasonable protection against earthquake- induced failure, the new zoning maps, or equivalent ground motion computed for a particular site, can be employed in design of many non-critical structures and facilities that may not be covered by the NBCC. Some standards for critical facilities require an 'operating basis' design ground motion such that operation is maintained during and following a seismic event. For example, the Canadian Standards Association (1981 a) standard for LNG facilities requires the operating basis ground motion, when determined probabilistically, to have a probability of exceedance of 10% in 50 years. The American Petroleum Institute (1980) has zoned the coastal regions of the United States using accelerations with a probability of exceedance of about 10% in 50 years to illustrate relative levels of earthquake risk and to suggest minimum levels of design ground motion for fixed offshore platforms. The ground motion con- tours in the coastal and continental shelf regions of Figs. 3 and 4 would provide equivalent information for Canada, although Weichert et al. (1983) and Basham et al. (1983) have suggested that additional consid- erations would be appropriate along the western and eastern continental margins.
There are, however, important limitations on the ap- plications of these zoning maps; in particular, regions of high earthquake risk and the determination of design ground motion for critical structures require special considerations.
Zone 6 considerations
Zone 6 on the recommended zoning maps would
include, for both Za and Z, (see Figs. 3 and 4), small areas near the Charlevoix and Laurentian Channel earthquakes in eastern Canada, and a significant portion of the western Canada offshore region as well as north- em Vancouver Island and the Queen Charlotte Islands. In addition, Z, = 6 appears in Baffin Bay, the central Queen Elizabeth Islands, and the north-central Yukon; although for parts of these regions an application of the procedures described in the previous section would im- pose an 'effective' Za that is only one zone greater than the applicable Z,. These are regions of high risk, be- cause a structure built in Zone 6 is expected during its lifetime to be in the near field of a large earthquake. Hasegawa et al. (1981) have emphasized that the PHA and PHV attenuation relations are so poorly controlled in the high-magnitude, near-distance range that they should be used with considerable caution in predicting large amplitude ground motion.
Thus, a Zone 6 designation for a location should be treated as a preliminary indication of high risk. The nominal zonal ratio of 0.40 (see Table 1) may be in- creased on the basis of a site-specific calculation indi- cating a larger value is appropriate, and the proposed new provisions of the code may be applied. However, depending on the nature of the structure it may be nec- essary to attempt to characterize more explicitly the nature of the expected seismic ground motion in the dominant frequency range of structural response. This would require state-of-the-art modelling of large- earthquake excitation and propagation of strong ground motions. In this sense, the normal provisions of NBCC cannot cover all potential requirements for earthquake- resistant design of structures in the new Zone 6. How- ever, it must also be recognized that reliable estimates of seismic ground motion from large, near-by earth- quakes bearing the precision that engineers may desire, are largely impossible at this time. The most recent advances, both in understanding strong motion ex- citation and propagation processes and in modelling these processes by sophisticated computational meth- ods can provide only a range of expected values. Critical structures
Critical structures and facilities require a more rig- orous assessment of earthquake risk. Regulation or nor- mal engineering practice usually imposes more severe design requirements than those contained in the NBCC. Nuclear power plants, radioactive waste repositories, pipelines, offshore petroleum exploration and produc- tion facilities, LNG storage facilities, high dams, cer- tain military installations, and other critical structures may all fall within this category, because of either high potential hazards to humans, severe environmental ef- fects, or high economic or strategic losses should they fail under earthquake loading. Adequate assurance
HEIDEBRECHT ET AL. 679
against earthquake-induced failure is achieved by re- quiring these facilities to withstand very low probability earthquake effects.
The probabilistic seismic ground-motion model used to develop the zoning maps discussed above does pro- vide information relevant to critical structures for pre- liminary design considerations and for comparisons of one region or site against another in terms of the relative severity of earthquake effects, but it does not provide the details of design ground motion required to protect such structures. Although any probabilistic seismic ground-motion calculation is dependent on model as- sumptions (earthquake source zones, magnitude recur- rence, and attenuation relations), it becomes increasing- ly so at low probabilities. The degree of uncertainty in the model, e.g., in the nature of the source zones or the near-field earthquake effects, or the 'probability' that the model is an incorrect representation of reality, al- though unquantifiable, can become greater than the probability associated with the ground motion being calculated. It is for this reason that standards developed for critical structures such as nuclear power plants and LNG storage facilities (Canadian Standards Association 1981 a , b ) require extensive site and regional investiga- tions to establish appropriate design seismic ground motion.
Summary and discussion
A method has been presented of how the new seismic risk maps of Canada can be incorporated into the seis- mic loading provisions of the National Building Code. The new probabilistic seismic ground motion maps pro- vide a refined estimate of earthquake risk across the country; the adoption of a probability of exceedance of 10% in 50 years yields reference seismic ground- motion levels that are appropriate to the levels of pro- tection that are afforded by the provisions of the current Code; the incorporation of the two ground-motion pa- rameters of PHA and PHV in terms of acceleration and velocity zones provides independent ground-motion reference levels for buildings having short and long fundamental periods, respectively.
The two ground-motion parameters are accommo- dated by a new seismic response factor in which seismic forces for long-period structures are directly propor- tional to zonal velocities, and for short-period structures proportional to zonal accelerations, but with an upper limit on the effective acceleration/velocity ratio that will apply at any location. To maintain the level of protection provided by NBCC 1980, the new seismic response factor is calibrated so that the sum of the weighted base shear applicable at periods 2 0 . 5 s in large population centres located in NBCC 1980 seismic zones 2 and 3 remains the same. The resulting change in base shear for certain locations reflects the improved
estimates of seismic risk: an increase at all periods for sites in some regions of NBCC 1980 zone 3 (e.g., Victoria and Prince Rupert), a result of the adoption of additional zones in the higher risk regions of the coun- try; a reduction at all periods for some sites in NBCC 1980 zone 2; and an increase for short-period structures in some regions of eastern Canada (e.g., Ottawa and Montreal), reflecting higher levels of short-period ground motion in the new seismic risk estimates.
Revisions to the NBCC 1980 seismic loading pro- visions, equivalent to those summarized in this paper, have been recommended by the Canadian National Committee on Earthquake Engineering to the Associate Committee on the National Building Code for incorpo- ration into NBCC 1985.
This change, in both the basic description of seismic risk in Canada through the new zoning maps and the methods of accommodating the seismic ground-motion information in seismic design provisions, will come 15 years after the adoption of the 1970 seismic zoning map employed in the current edition of the code. This is a time period over which it is reasonable for the user to expect design standards to remain constant; it is also the time period over which research and accumulating in- formation on seismicity would be expected to yield improved information on seismic risk. Thus, the au- thors would expect the revised seismic zoning maps described in this paper to remain applicable to NBCC for at least a decade. Readers are reminded, however, that there is, and always will be, an inherent uncertainty in the appropriate seismic ground motions to be used in earthquake-resistant design. Because of the nature of earthquakes, it will not be possible to define accurately their size and location and the ground motion effects that they will produce. The ground motions computed to produce Figs. 3 and 4 are considered to be current best estimates for NBCC purposes, but research on all aspects of this subject is continuing and improvements can be made expected as more knowledge is gained.
Acknowledgements
We are grateful to W. G . Milne, D. H. Weichert, A. E. Stevens, and J. E. Adams for discussions and comments on draft manuscripts, and to F. M. Anglin for assistance with seismic ground-motion calculations during the preparation of this paper. We also acknowl- edge the contributions of all other members of the Canadian National Committee on Earthquake En- gineering, without whose thoughtful consideration of the implications the completion of this work would not have been possible.
ALGERMISSEN, S. T., PERKINS, D. M., THENHAUS, P. C., HANSON, S. L., and BENDER, B . L. 1982. Probabilistic estimates of maximum acceleration and velocity in rock in
680 CAN. 1. CIV. ENG. VOL. 10. 1983
the contiguous United States. U.S. Geological Survey Open File Report 82-1028, 107 p.
AMERICAN PETROLEUM INSTITUTE. 1980. Recommended practice for planning, designing, and constructing fixed offshore platforms. American Petroleum Institute RP 2A, Eleventh Edition,Washington, DC., 7 1 p.
APPLIED TECHNOLOGY COUNCIL. 1978. Tentative provisions for the development of seismic regulations for buildings. National Bureau of Standards, Washington, DC. Special Publication 510, 514 p.
ASSOCIATE COMMIT~EE ON THE NATIONAL BUILDING CODE. 1980. National Building Code of Canada 1980, NRCC No. 17303; The Supplement to the National Building Code of Canada 1980, NRCC No. 17724, National Research Coun- cil, Ottawa, Canada.
BASHAM, P. W., ADAMS, J., and ANGLIN, F. M. 1983. Earth- quake source models for estimating seismic risk on the eastern Canadian continental margin. Proceedings of the Fourth Canadian Conference on Earthquake Engineering, Vancouver, B.C., pp. 495-508.
BASHAM, P. W., WEICHERT, D. H., ANGLIN, F. M., and BERRY, M. J . 1982. New probabilistic strong seismic ground-motion maps of Canada: A compilation of earth- quake source zones, methods, and results. Earth Physics Branch, Energy, Mines and Resources Canada, Ottawa, Canada, Open File Report 82-33, 205 p.
BASHAM, P. W., WEICHERT, D. H., and BERRY, M. J. 1979. Regional assessment of seismic risk in Eastern Canada. Bulletin of the Seismological Society of America, 69, pp. 1567-1602.
CANADIAN STANDARDS ASSOCIATION. 198 1 a. Liquefied natural gas (LNG) - Production, storage and handling. Canadian Standards Association, Standard 2276-M 198 1,
Rexdale, Ontario.
198 1 b. Ground-motion determination for seismic qualification of CANDU nuclear power plants. Canadian Standards Association, Standard CAN3-N289.2-M8 1, Rexdale, Ontario.
CORNELL, C. A. 1968. Engineering seismic risk analysis. Bulletin of the Seismological Society of America, 58, pp. 1583-1606.
HASEGAWA, H. S., BASHAM, P. W., and BERRY, M. J. 1981. Attenuation relations for strong seismic ground motion in Canada. Bulletin of the Seismological Society of America, 71, pp. 1943-1962.
HODGSON, J . H. 1956. A seismic probability map for Canada. Canadian Underwriter, 23, p. 7.
MILNE, W. G., and DAVENPORT, A. G. 1969. Distribution of earthquake risk in Canada. Bulletin of the Seismological Society of America, 59, pp. 729-754.
UZUMERI, S. M., OTANI, S., and COLLINS, M. P. 1978. An overview of Canadian Code requirements for earthquake resistant concrete buildings. Canadian Journal of Civil Engineering, 5, pp. 427-441.
WEICHERT, D. H., and MILNE, W. G. 1979. On Canadian methodologies of probabilistic seismic risk estimation. Bulletin of the Seismological Society of America, 69, pp. 1549-1566.
WEICHERT, D. H., ROGERS, G. C., HYNDMAN, R. D., and HORNER, R. B. 1983. Seismic risk of the Queen Charlotte Islands and adjacent areas. Proceedings of the Fourth Cana- dian Conference on Earthquake Engineering, Vancouver, B.C., pp. 529-538.
WHITHAM, K., MILNE, W. G., and SMITH, W. E. T. 1970. The new seismic zoning map for Canada 1970. Canadian Underwriter, 15, p. 6.