HAL Id: tel-02864837
https://tel.archives-ouvertes.fr/tel-02864837
Submitted on 11 Jun 2020
HAL is a multi-disciplinary open access archive for the deposit and dissemination of sci-entific research documents, whether they are pub-lished or not. The documents may come from teaching and research institutions in France or abroad, or from public or private research centers.
L’archive ouverte pluridisciplinaire HAL, est destinée au dépôt et à la diffusion de documents scientifiques de niveau recherche, publiés ou non, émanant des établissements d’enseignement et de recherche français ou étrangers, des laboratoires publics ou privés.
patients with disorders of consciousness : a machine
learning approach applied to electrophysiological brain
and body signals
Federico Raimondo
To cite this version:
Federico Raimondo. Standardisation and automatisation of the diagnosis of patients with disorders of consciousness : a machine learning approach applied to electrophysiological brain and body signals. Neurons and Cognition [q-bio.NC]. Sorbonne Université; Universidad de Buenos Aires, 2018. English. �NNT : 2018SORUS321�. �tel-02864837�
Sorbonne Université
Universidad de Buenos Aires
Ecole Doctorale Cerveau Cognition Comportement (ED3C)
Institut du Cerveau et de la Moelle êpinière - PICNIC Lab et Laboratorio de Inteligencia Artificial - DC, FCEyN
Normalisation et automatisation du diagnostic des patients atteints de troubles de
la conscience: une approche par apprentissage automatique appliquée aux
signaux électrophysiologiques du cerveau et du corps.
Standardisation and automatisation of the diagnosis of patients with disorders of
consciousness: a machine learning approach applied to electrophysiological brain
and body signals.
par Federico RAIMONDO
Thèse de doctorat de Neurosciences
Dirigé para Laurent COHEN, Diego FERNÁNDEZ SLEZAK et Jacobo Diego SITT Présentée et soutenue publiquement le 27/11/2018
Devant un jury composé de :
M Joaquin NAVAJAS AHUMADA PU, Universidad Torcuato Di Tella Rapporteur M Enzo TAGLIAZUCCHI CR, Instituto de Física de Buenos Aires Rapporteur M Pablo Miguel GRANITTO PU, CIFASIS - CONICET Examinateur M Salvador Martin GUINJOAN PU, FLENI - CONICET Examinateur
M Jacobo Diego SITT CR, INSERM Directeur
M Diego FERNÁNDEZ SLEZAK PU, Departamento de Computación, UBA Directeur M Laurent COHEN PU-PH, Sorbonne Université Directeur
Contents
Acknowledgments vii Abstract ix Résumé xi Resumen xiii 1 Introduction 11.1 The study of Consciousness . . . 2
1.1.1 Conscious Access vs Conscious States . . . 2
1.1.2 Disorders of Consciousness . . . 2
1.1.3 Why diagnosis is important? . . . 3
1.2 State of the art of DOC diagnosis . . . 5
1.2.1 Current tools for DOC diagnosis . . . 5
1.3 Electroencephalography . . . 9
1.3.1 What is EEG? . . . 9
1.3.2 What do we analyse in EEG? . . . 11
1.4 Electroencephalography in DOC patients . . . 15
1.5 Methods used in this thesis . . . 17
1.5.1 The Coma Recovery Scale (Revised) . . . 17
1.5.2 The Local-Global paradigm . . . 18
1.5.3 Machine Learning . . . 19 1.5.4 Statistics . . . 22 1.6 This work . . . 23 1.6.1 Purpose . . . 23 1.6.2 Description of chapters . . . 23 iii
2 Automation and identification of robust EEG-extracted markers for the
diagno-sis of DOC 25
2.1 Background . . . 26
2.2 Objectives . . . 27
2.3 Automation . . . 27
2.3.1 Reasons to rewrite the code and automate the process . . . 27
2.3.2 Software Implementation . . . 28
2.3.3 Preprocessing . . . 28
2.3.4 Optimisations and Performance . . . 29
2.4 Replication . . . 30 2.4.1 Methods . . . 30 2.4.2 Results . . . 35 2.5 Validation . . . 36 2.5.1 Methods . . . 36 2.5.2 Results . . . 36 2.6 Clinical application . . . 38 2.6.1 Report . . . 38
2.7 Further steps: towards a universal tool . . . 39
2.7.1 Generalisation to difference EEG recording configurations . . . 40
2.7.2 Generalisation to Resting State . . . 43
2.7.3 Discussion . . . 45
2.8 Insights from Machine Learning . . . 47
2.8.1 Methods . . . 47
2.8.2 Results . . . 48
2.8.3 Discussion . . . 48
2.9 Summary . . . 50
3 Towards cross-modal integration as a measure of consciousness 51 3.1 Background . . . 52 3.2 Hypotheses . . . 54 3.3 Methods . . . 55 3.3.1 Cross-modal Local-Global . . . 55 3.3.2 Subjects . . . 58 3.3.3 EEG acquisition . . . 58 3.3.4 Analysis . . . 59 3.3.5 Group-Level analysis . . . 59 3.3.6 Statistics . . . 60 3.4 Results . . . 60 3.4.1 ERP analysis . . . 60
CONTENTS v
3.4.2 ERP characterisation through MVPA . . . 61
3.5 Discussion . . . 61
4 Brain-Body interactions as a diagnostic marker for DOC 69 4.1 Background . . . 70
4.2 Hypotheses . . . 71
4.3 Baseline cardiac activity . . . 72
4.3.1 Methods . . . 72
4.3.2 Results . . . 75
4.4 Cardiac markers of cognitive processing . . . 78
4.4.1 Methods . . . 78
4.4.2 Results . . . 82
4.5 EEG and EKG Multivariate Pattern Analysis . . . 82
4.5.1 Methods . . . 82
4.5.2 Results . . . 84
4.6 Discussion . . . 86
Acknowledgments
Despite that it is at the beginning, this is the last page that I wrote about this work. I have been thinking in this text since the moment that I opened the first file and started writing. It has been a bit more than five years, three countries, five summers, seven winters, three labs, and in each one of those moments, countless persons that have been part of this present in which I am. It is my wish to thank all these people that were and are part of my life.
I want to thank my parents, Martha and Dicky, who pushed me since I was little, but let me free to choose my future (although they never gave me the chance to live from rock).
To my sisters and brother, Nina, María y Tomás, who had to put up with moves, formali-ties, orders and favours. Who were always there, in good and bad times, even when I was not present enough.
To my aunts, uncles, grandparents and cousins: Magdalena, Pepe, Diana, Leticia, Julia, Tadeo, Candela. Who in every visit to Patagonia they reminded me that family is still there. To my uncle Gustavo, who was an enormous influence in my childhood and adolescence, and continues to show that one must still fight despite the misfortunes and bad moments. Stay strong!
To my Patagonian friends, who despite the distance, were always a place of comfort and joy. In alphabetical order and without articles: Adriano, Chacha, Chiqui, Chomba, Churi, Eze, Foco, Gato, Guille, Herni, Juanpa, Pablito, Pantro, Rata, Rodri, Ruso, Topo. Without forgetting Córdoba and Rosario.
To Tut, imperceptible and present at the same time. To Yorgos, for the mind-cleansing videogames nights.
To Abuela Lidia, that at its time provided a place of encounter and exchange between friends. But principally, to those friends, that assisted religiously to discuss new ways to change the world between wines and bondiolas.
To the Department of Computer Sciences, for the excellent education provided and for being a community that does not let go, that forms you as a student, teacher and person.
To PICNIC Lab, a team with multiple formations, but always a team, with top players like Mariam, Diana, Sami, Denis, Camille, Florence, Benjamin, Melanie, Pauline, Bertrand, Kasia, Tal and everyone that passed by when I was around, and showed me that excellent
science can also be fun.
To the Coma Science Group, the place where I am writing this, for giving me the oppor-tunity to continue my career.
To Diego, that one day found me in the hallway and proposed a project that started me as a researcher.
To Lionel, for his trust.
To Jaco, that wore the band, took the wheel, and started to row alone in a boat that was drifting, taking this PhD to and end, and to end in a way in which I never though possible. Who formed me as a neuroscientist, who gave me direction, who trusted my and, principally, taught me how to do good science.
And last, but without diminishing merit, to those beautiful human beings with whom I share my life every day, that stood up to everything, the good and the bad moments, and that do not stop giving me energy. To Athena and Alex.
During the development of this work, I received funds from the Department of Computer Sciences (FCEyN, UBA), ICM (France) and, in particular, a scholarship from CONICET, that supported me during 5 years. For this reason, I want to thank specially to all the people that fought and keep fighting for the Argentinian science.
Standardisation and automatisation of the diagnosis of patients with
disorders of consciousness: a machine learning approach applied to
electrophysiological brain and body signals.
Advances in modern medicine have led to an increase of patients diagnosed with disor-ders of consciousness (DOC). In these conditions, patients are awake, but without behavioural signs of awareness. An accurate evaluation of DOC patients has medico-ethical and societal implications, and it is of crucial importance because it typically informs prognosis. Misdi-agnosis of patients, however, is a major concern in clinics due to intrinsic limitations of be-havioural tools. One accessible assisting methodology for clinicians is electroencephalogra-phy (EEG). In a previous study, we introduced the use of EEG-extracted markers and machine learning as a tool for the diagnosis of DOC patients. In this work, we developed an automated analysis tool, and analysed the applicability and limitations of this method. Additionally, we proposed two approaches to enhance the accuracy of this method: (1) the use of multiple stimulation modalities to include neural correlates of multisensory integration and (2) the analysis of consciousness-mediated modulations of cardiac activity. Our results exceed the current state of knowledge in two dimensions. Clinically, we found that the method can be used in heterogeneous contexts, confirming the utility of machine learning as an automated tool for clinical diagnosis. Scientifically, our results highlight that brain-body interactions might be the fundamental mechanism to support the fusion of multiple senses into a unique percept, leading to the emergence of consciousness. Taken together, this work illustrates the importance of machine learning to individualised clinical assessment, and paves the way for inclusion of bodily functions when quantifying global states of consciousness.
Normalisation et automatisation du diagnostic des patients atteints de
troubles de la conscience: une approche par apprentissage automatique
appliquée aux signaux électrophysiologiques du cerveau et du corps.
Les progrès de la médecine moderne ont entraîné une augmentation du nombre de pa-tients ayant des troubles de la conscience (DOC). Ces derniers, alors qu’ils sont éveillés, ne présentent pas de signes comportementaux de conscience. L’évaluation comportemen-tale précise de ces patients a des implications médico-éthiques et sociales cruciales, car elle conditionne généralement le pronostic. Ainsi, les erreurs diagnostiques liées aux limites in-trinsèques des outils comportementaux sont une préoccupation majeure pour les cliniciens et l’électroencéphalographie (EEG) pourrait s’avérer utile. Dans une étude précédente, nous avions introduit l’utilisation de marqueurs extraits de l’EEG et l’apprentissage supervisé pour le diagnostic des patients DOC. Dans ce travail, nous avons développé cet outil et analysé son applicabilité et ses limites. De plus, nous avons proposé deux approches pour améliorer la précision de cette méthode: (1) l’utilisation de multiples modalités de stimulation pour inclure des corrélats neuronaux de l’intégration multisensorielle et (2) l’analyse des mod-ulations de l’activité cardiaque par la conscience. Nos résultats dépassent l’état actuel des connaissances dans deux dimensions. Cliniquement, nous avons constaté que la méthode pouvait être utilisée dans des contextes hétérogènes, confirmant l’utilité de l’apprentissage automatique en tant qu’outil automatisé de diagnostic clinique. Scientifiquement, nos résul-tats soulignent que les interactions cerveau-corps pourraient être le mécanisme fondamental pour soutenir l’intégration multisensorielle en un percept unique, conduisant à l’émergence de la conscience. Au total, ces travaux illustrent l’importance de l’apprentissage automa-tique pour une évaluation individualisée de la conscience et ouvrent la voie à l’inclusion des fonctions corporelles pour la quantification des états de conscience.
Estandarización y automatización en el diagnóstico de pacientes con
desordenes de conciencia: aprendizaje automático aplicado a señales
electrofisiológicas del cerebro y el cuerpo.
Avances en la medicina moderna han llevado a un incremento en el número de pacientes diagnosticados con desordenes de consciencia (DOC). En estas condiciones, los pacientes se encuentran despiertos, pero no muestran signos de entendimiento acerca de si mismos o el lugar donde se encuentran. Una evaluación precisa de los pacientes tiene implicaciones medico-éticas y sociales, y es de suma importancia porque típicamente informa el pronós-tico. Los diagnósticos erróneos, no obstante, es una gran preocupación en las clínicas debido a las limitaciones intrínsecas de las herramientas de diagnostico basados en comportamiento. Una tecnología accesible para asistir a los médicos es la electroencefalografía (EEG). In un estudio previo, introducimos el uso de marcadores extraídos de EEG en combinación con aprendizaje automático como una herramienta para el diagnostico de pacientes DOC. En este trabajo, desarrollamos una herramienta de análisis automatizado, y analizamos la aplicabil-idad y limitaciones de este método. Adicionalmente, proponemos dos enfoques para incre-mentar la precision del diagnóstico: (1) el uso de múltiples modalidades de estimulación para incluir los correlatos neuronales de la integración multisensorial y (2) el análisis de las mod-ulaciones de la actividad cardíaca mediadas por la conciencia. Nuestros resultados exceden el conocimiento actual en dos dimensiones. Clínicamente, encontramos que el método puede ser utilizada en contextos heterogéneos, confirmando la utilidad del aprendizaje automático como una herramientas para el diagnóstico clínico. Científicamente, nuestros resultados re-saltan que las interacciones entre el cerebro y el cuerpo pueden ser el mecanismo funda-mental para sostener la fusión de multiples sentidos en una única percepción, conduciendo a la emergencia de la consciencia. En conjunto, este trabajo ilustra la importancia del apren-dizaje automático para la evaluación clínica individualizada, y crea un punto de partida para la inclusión de las funciones corporales en la cuantificación de los estados de conciencia globales.
Chapter 1
Introduction
Contents
1.1 The study of Consciousness . . . 2
1.1.1 Conscious Access vs Conscious States . . . 2
1.1.2 Disorders of Consciousness . . . 2
1.1.3 Why diagnosis is important? . . . 3
1.2 State of the art of DOC diagnosis . . . 5
1.2.1 Current tools for DOC diagnosis . . . 5
1.3 Electroencephalography . . . 9
1.3.1 What is EEG? . . . 9
1.3.2 What do we analyse in EEG? . . . 11
1.4 Electroencephalography in DOC patients . . . 15
1.5 Methods used in this thesis . . . 17
1.5.1 The Coma Recovery Scale (Revised) . . . 17
1.5.2 The Local-Global paradigm . . . 18
1.5.3 Machine Learning . . . 19 1.5.4 Statistics . . . 22 1.6 This work . . . 23 1.6.1 Purpose . . . 23 1.6.2 Description of chapters . . . 23 1
1.1
The study of Consciousness
1.1.1
Conscious Access vs Conscious States
Throughout history, the term consciousness has been studied from disciplines as philosophy, psychology and biomedical sciences. Nowadays, there is still no universal definition for such an ambiguous concept (Baars, 2015). Depending on the use of the word conscious, it can refer to the state of consciousness or to conscious access or processing. In its intransitive use (e.g. “the patient is still conscious”), it refers to the state of consciousness, also called wakefulnessor vigilance. In its transitive use (e.g. “I was not conscious of the red light”), it refers to access or processing of a specific piece of information. The information accessed consciously at a given moment defines the conscious content, which can be reported (Dehaene and Changeux,2011).
1.1.2
Disorders of Consciousness
The state of consciousness, at the same time, is a multidimensional construct (Bayne et al.,
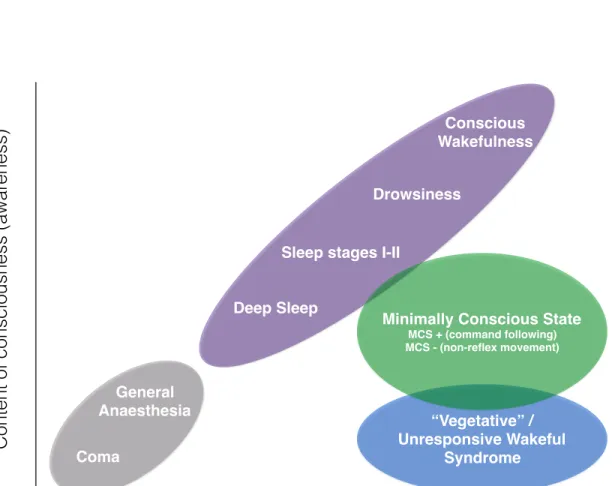
2016). This means that it can be expressed in several distinct states which describe arousal level, cognitive function, and bodily states. In lack of a full description of these dimensions of each state of consciousness, we will here adopt a simplified definition coming from clinical practice (Posner et al.,2007). Clinical neurologists typically evaluate consciousness on two dimensions, arousal and awareness. Arousal refers to the level of wakefulness and is clin-ically indicated by eyes-opening. Awareness refers to the contents of consciousness and it is clinically evaluated by command following and by observing nonreflex behaviours. What is further known from clinics is that the relationship between these two dimensions is not always a positive one. The introduction of the mechanical ventilator in the 1950s and the development of intensive care in the 1960s made it possible for many patients to sustain their vegetative functions and allowed them to survive their severe injuries. Despite such advance-ment, many patients were found to suffer from altered states of consciousness, which had never been encountered before as these patients would normally die from apnea (Laureys and Boly, 2007). Patients in a vegetative state/unresponsive wakefulness syndrome (VS/UWS), although they show intermittent periods of wakefulness, they do not respond to stimulation
1.1. THE STUDY OF CONSCIOUSNESS 3 evidencing awareness of self and the environment (Jennett and Plum,1972). Even when pa-tients show discernible signs of behavioural non-reflex activity, coined as the minimally con-scious state (MCS), they remain unable to communicate and are considered with impaired consciousness (Giacino et al.,2002). When patients regain the capacity of functional com-munication or object user are considered to be emerged from MCS (EMCS). An illustration comparing the different consciousness states is shown in Figure 1.1 on the following page.
1.1.3
Why diagnosis is important?
The impact of such profound states of unconsciousness is reflected in the composition of the first bioethical committees discussing the redefinition of life and death, hence predicting the medico-ethical legal, and societal debates that were to follow (Beecher et al.,1968). Debates of this kind mainly stem from how consciousness is considered in these conditions (Racine et al.,2008). For example, with a wide European survey among healthcare professionals there was a unanimous support for pain perception in MCS (96%) but less for the VS/UWS (56%) (Demertzi et al., 2009). Similarly, the majority (66%) of healthcare professionals agreed to withdraw life-sustaining treatment from chronic VS/UWS patients whereas only 28% agreed so for the chronic MCS (Demertzi et al., 2011). Additionally, disorders of consciousness have required the mediation of legal authorities in order to regulate end-of-life decisions (Quill, 2005): in the absence of a written statement about end-of-life preference from pa-tients’ behalf (advance directive), a surrogate decision maker is eligible to mediate trying to maximise patients’ self-determination and protect their interests (Bernat, 2002, 2004). As such, conflicts of interest among caregivers can arise leading to wide societal debates (Quill,
2005; Striano et al., 2009). Also, treatment resources are not unlimited. The allocation of medical resources and the economics at the end of life have not yet been fully determined for patients for whom the dilemma on treating becomes crucial either because treatments are not guaranteed as successful (i.e., the condition is too bad to be treated) or unkind (i.e., the qual-ity of life of those surviving is not acceptable) (Fins, 2003). Finally, the ethical significance of consciousness has raised many discussions as to whether greater sentience entails greater quality of life. As being conscious entails being conscious both of wellbeing and suffering (Kahane and Savulescu, 2009), it might hence not be in patients’ best interest to preserve life-sustaining aids (Horne,2009).
Content of consciousness (awa
reness)
Level of consciousness (wakefulness)
Conscious Wakefulness Drowsiness
Sleep stages I-II Deep Sleep
“Vegetative” / Unresponsive Wakeful
Syndrome
Minimally Conscious State
MCS + (command following) MCS - (non-reflex movement)
General Anaesthesia Coma
Figure 1.1: Simplified illustration of the two major components of consciousness: the level (wakefulness) and the content of consciousness (awareness). Normal physiological states (purple) present a positive correlation. Patients in coma or anaesthesia (gray) are unconscious and they cannot be awakened. DOC patients are awake but do not present signs of awareness (VS/UWS patients; blue) or show inconsistent but discernible signs of behavioural activity (MCS patients; green). Adapted fromLaureys 2005b
1.2. STATE OF THE ART OF DOC DIAGNOSIS 5 Taken collectively, to evaluate consciousness in noncommunicating patients has medico-ethical significance. To date, efforts are focused on determining reliable diagnostic labels. Diagnosis is considered a crucial level, because it typically informs about patients’ progno-sis, i.e., unresponsive patients have less favourable outcome as compared to those in MCS (Faugeras et al., 2017), and may influence clinical management and treatment options (Jox et al.,2012).
1.2
State of the art of DOC diagnosis
1.2.1
Current tools for DOC diagnosis
Behavioural evaluation
Voluntary and reflexive behaviours are difficult to distinguish. Clinicians and caregivers could miss the subtle signs of consciousness behaviour present in MCS patients. Despite the specification of a diagnostic criteria for MCS (Giacino et al., 2002), a study showed that non-standardised observation presented a 41% misdiagnosis of VS/UWS patients when compared with a standardised scale (Schnakers et al.,2009). Among the several sources of variance that contribute to this misdiagnosis, the patient’s fluctuations in terms of arousal, fatigue, illness, pain, cortical sensory deficits, motor impairments or cognitive disturbance decreases the probability of observing signs of consciousness (Schnakers et al., 2015). Tak-ing this fact into account, behavioural evaluations should occur repeatedly over time and should be sensitive enough to detect this subtle but meaningful fluctuations.
Conventional bedside assessment procedures as the Glasgow Coma Scale (GCS;Teasdale and Jennett 1974) are designed to detect gross changes in behaviour rather than reflexive from voluntary behaviour. An alternative scale which present higher sensitivity in detecting levels of brainstem function in the acute stage of brain injury is the Full Outline of UnResponsive-ness score (FOUR score) (Wijdicks et al.,2005). Neverhteless, this score does not include a systematic assessment of signs of consciousness (Giacino et al.,2002) and it may not capture the transition from VS to MCS (Schnakers et al.,2006;Bruno et al.,2011).
Standardised neurobehavioral assessment measures tailored for DOC patients include the Coma Recovery Scale – Revised (CRS-R) (Giacino et al.,2004), the Coma-Near Coma Scale
(CNC) (Rappaport et al., 1992), the Western Neurosensory Stimulation Profile (WNSSP) (Ansell and Keenan, 1989), the Western Head Injury Matrix (WHIM) (Shiel et al., 2000), and the Sensory Modality Assessment and Rehabilitation Technique (SMART) (Wilson and Gill-Thwaites,2000). Although item content varies across measures, all evaluate behavioural responses to a variety of auditory, visual, motor, and communication prompts.
Neuroimaging
Nowadays, behavioural assessment of DOC remains the ‘gold standard‘ due to the lack of an objective test of consciousness. Nevertheless, neuroimaging permits objective documentation of central nervous system damage after acquired brain injury. Scientifically, neuroimaging studies contributes to a better understanding of the neural correlates of human conscious-ness. Clinically, they provide additional information concerning diagnosis, prognosis and the course of recovery of consciousness, and can serve as surrogate markers for novel therapeutic interventions (Giacino et al.,2014).
Structural neuroimaging techniques used in DOC comprises Magnetic Resonance Imag-ing (MRI) and Computed Tomography (CT). These images allow the visualisation of the location and extent of brain damage, but cannot reliably differentiate VS/UWS from MCS patients. A previous study showed that structural MRI can predict the outcome of DOC patients; for example, the presence of corpus callosum and dorsolateral brain-stem lesions correlates with the lack of recovery at the group level (Kampfl et al., 1998). However, the recently developed quantitative diffusion tensor imaging (DTI) techniques, which permit as-sessment of structural white matter damage, have been shown to outperform clinical markers in predicting 1-year functional outcome at the individual-patient level in patients with trau-matic (Galanaud et al.,2012) or anoxic (Luyt et al.,2012) brain injury.
Functional neuroimaging can measure brain function, either in active or passive (resting) states. Among the available technologies, functional MRI (fMRI), F-fluorodeoxyglucose PET (FDG-PET) and Electroencephalography (EEG) have helped understanding DOC. Each technique measures different aspects: FDG-PET measures the brain’s metabolic activity, fMRI the haemodynamic activity and EEG the electrical activity.
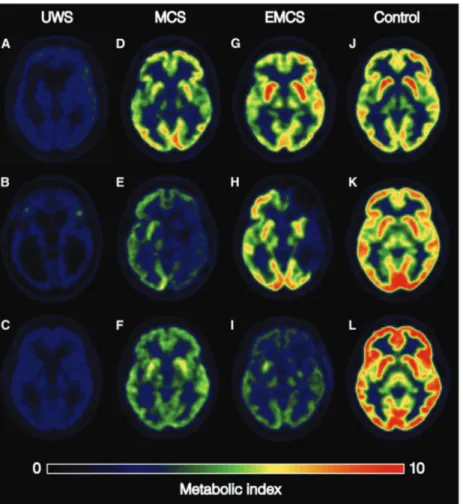
A recent study used FDG-PET to measure whole-brain glucose metabolic state, conclud-ing that this quantification allows accurate diagnosis and prediction of disorders of
conscious-1.2. STATE OF THE ART OF DOC DIAGNOSIS 7
Figure 1.2: FDG-PET images for representative group samples as extracted fromStender et al. 2016.
ness (Figure 1.2;Stender et al. 2014). Nevertheless, in the same work, the authors depict the need for high standards in image quality and registration.
Using fMRI, studies have been carried using auditory, tactile or visual stimuli, depicting near-normal cortical activation patterns in MCS patients contrary to the low-level activations in VS/UWS patients (Laureys and Schiff,2012). Despite their potential value as prognostic markers, the diagnostic value and interpretation of activation fMRI studies in DOC in terms of the presence or absence of residual consciousness have remained controversial. Indeed, in the absence of a full understanding of the neural correlates of consciousness, deficient cortical activation to external stimuli does not necessarily prove the absence of consciousness ( Lau-reys,2005a). On the other hand, task-free resting-state fMRI measurements are also used for
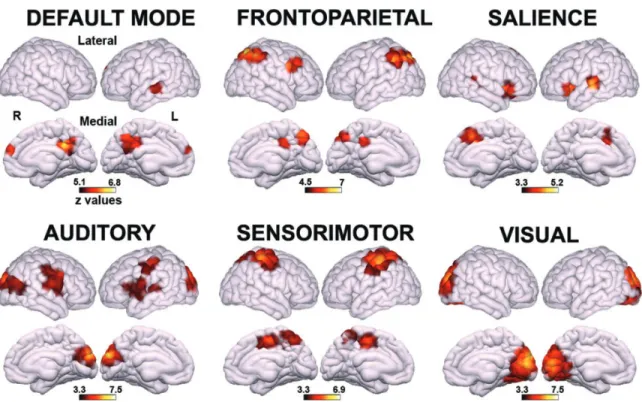
Figure 1.3: Regions showing higher functional connectivity in MCS patients as compared to VS/UWS patients (extracted fromDemertzi et al. 2015).
diagnosis of DOC. In a recent study, automatic classification using functional connectivity between left auditory, right auditory and occipital cortex was able to determine the conscious state of 20 out of 22 patients (figure 1.3;Demertzi et al. 2015).
Electrophysiology
Another technique consists of studying the electrical activity of neurons or muscles. The term electrophysiology encompass several particular techniques, depending on the source of the signals. A common technique used throughout this entire thesis is electroencephalography (EEG) which focus on measuring the electrical activity of the cerebral cortex.
1.3. ELECTROENCEPHALOGRAPHY 9
1.3
Electroencephalography
1.3.1
What is EEG?
How does it work?
Electroencephalography (EEG) is an electrophysiological technique for the recording of elec-trical activity arising form the human brain. The history of EEG goes back to the 19th century, starting by Richard Caton in 1875 who performed the first known neurophysiologic recording of animals using a galvanometer. It was not until 1924 when the first studies in human began, made by Has Berger, a German psychiatrist (St. Louis and Frey,2016).
EEG uses the principle of differential amplification, or recording voltage differences be-tween different points using a pair of electrodes that compares one active exploring electrode site with another neighbouring or distant reference electrode. This differences are measured in volts (typically microvolts or µV ).
An EEG acquisition system consists on a set of delicate electrodes connected to a set of differential amplifiers (one for each channel), following by filters. Before the digital era, this amplified signals were written by a mechanical pen directly into a rolling paper, leaving ink traces of waveforms that mirrored the electrical potential differences on the scalp. Modern systems contains analog-to-digital converters (ADC) that transforms the analog signal into discrete digital data, readable by a computer or microprocessor which can be used to store the acquired signals (Sanei and Chambers,2007).
The electrodes used to sense the voltage differences are crucial for acquiring high quality data. Nowadays, electrodes can be used to record neuronal activity in the scalp (EEG), brain cortex (Electrocorticography; ECoG), brain tissue (Local Field Potentials; LFP) or single neurons (single-unit recordings). Nevertheless, except for scalp EEG, the mentioned tech-niques are invasive and requires surgical procedures. Scalp EEG electrodes are pasted or glued to the scalp. For multichannel recordings with a large number of electrodes, caps are often used.
What do we measure?
The nerve cells in the brain produce signals that are called action potentials. These action potentials move from one cell to another across a gap called the synapse. Special chemicals called neurotransmitters help the signals to move across the gap. There are two types of neurotransmitters, one will help the action potential to move to the next cell (excitatory), the other will stop it moving to another nerve cell (inhibitory).
The electrical activity measured by scalp EEG recordings is generated by similarly ori-ented groups of cerebral cortical neurons near the scalp where the recording electrodes are placed. Each scalp electrode collects, at a minimum, an estimated 6 cm2 synchronous cortical activity. The majority of the electrical activity collected in the EEG is generated by groups of pyramidal neurons. These cells have cell bodies primarily in layers three and five of the cerebral cortex. The electrical activity recorded on the scalp represents the summation of the inhibitory or excitatory postsynaptic potentials (not action potentials, they are too short to be recordable) from thousands of pyramidal cells near each recording electrode. This summated activity can be represented as a field with positive and negative poles (dipole).
There are systematic interconnections between cortical neurons, as well as cortical to subcortical connections to structures such as the thalamus, that have well-developed feed-back linkages. Any sinusoidal rhythmic activity seen on the EEG is thought to represent oscillatory communications between the cortex and deeper, subcortical structures. These communication loops occur when the cortex is at rest or is not performing any specific task. Once the cortex has a task to perform, the electrical activity of the cortex desynchronises, and lower amplitude, faster electrical rhythms take predominance until the cortex completes its task and returns to a resting state (St. Louis and Frey,2016).
Resolution, precision and accuracy of EEG
The differences between precision, resolution and accuracy are subtle but important. Resolu-tion refers to the number of data samples by unit time, precision refers to the certainty of the measurements at teach time point and accuracy to the relationship between the timing of the EEG signal and the biophysical event that lead to that signal.
The temporal resolution of the EEG is given by the sampling rate of the acquisition, gen-erally between 100 Hz and 20 Khz, depending on the purpose of the acquisition. For most
1.3. ELECTROENCEPHALOGRAPHY 11 analysis on scalp EEG, resolutions between 250 Hz and 1000 Hz are sufficient and appropri-ate. In contrast, the temporal precision depends on the analysis applied. Raw (unprocessed data) have the highest temporal precision because each sample was taken at a precise time point. Nevertheless, filtered data is a weighted average of the temporal surrounding activity, which reduces the temporal precision. In terms of accuracy, the EEG is extremely accu-rate because brain electrical activity travels instantaneously from the neurons generating the electrical field to the electrodes measuring them.
Although EEG has high temporal precision, resolution and accuracy, it is not the case for spatial properties, as they are considered low compared to neuroimaging techniques such as fMRI. The spatial resolution of EEG is determined by the number of electrodes. Common configurations consists on 21 electrodes (10-20 standard;Jasper 1958), 32, 64, 128 and 256. The spatial precision of the EEG is considered low, although it can be improved by spatial filters. In terms of accuracy, the problem is that one electrode does not reflect the activity from neurons directly below that electrode, but rather a complex mixture of activities from many brain regions close to and distant from it. Furthermore, the extent to which one brain region contributes to the signal recorded from each EEG electrode depends on cortical anatomy and to what extent that brain region is active at a given point in time (Cohen,2014).
1.3.2
What do we analyse in EEG?
Oscillations
An oscillation is a rhythmic alternation of states. They can occur in time or in space, and are commonly seen in physical and biological systems. In the brain, they refer to fluctuations in the excitability of neurons or populations of neurons. Neural oscillations are observed on many spatial and temporal scales (Varela et al.,2001) and have been linked to many neurobi-ological events ranging from long-term potentiation to conscious perception (Buzsáki,2009;
Engel et al.,2001;Herrmann et al.,2010;Kistler et al.,2000;Klimesch et al.,2007;McBain and Kauer, 2009). These neurobiological mechanisms are fairly well understood (Buzsáki et al.,2012;Wang, 2010) although uncertainties remain in the extent to which different fac-tors contribute to the signal recoded by EEG, in part due to the complexity of the models and the difference in spatial scale between individual neurons and scalp EEG.
Brain rhythmic activity contains multiple frequencies simultaneously, which can be sepa-rated through signal processing techniques. These rhythms are grouped into bands, defined as delta (2-4 Hz), theta (4-8 Hz), alpha (8-12 Hz), beta (15-30 Hz), lower gamma (30-80 Hz), up-per gamma (80-150 Hz). Although there are more oscillations, there bands are most typically associated with cognitive processes, defined from neurobiological mechanisms of brain oscil-lations, including synaptic decay and signal transmission dynamics (Buzsáki,2009;Buzsáki and Draguhn,2004;Kopell et al.,2010;Niedermeyer and Silva,2004;Wang,2010)
Changes in rhythmic activity correlate with task demands, including perceptual, cogni-tive, motor, linguistic, social, emotional, mnemonic and other functional processes (Cohen,
2014).
Event-related Potentials (ERPs)
One way to study the human brain function is by analysing the reactions of the brain to a variety of stimuli. Some of these reactions may be associated with clear cut changes in the EEG; some others, however, consist of changes that are difficult to visualise. These EEG changes may be treated globally under the common term event-related potentials (ERPs); a subset of the ERPs are sensory (visual, auditory, somatosensory) evoked potentials (ERPs).
ERPs are usually defined in the time domain as the brain electrical activity that is trig-gered by the occurrence of particular events or stimuli. A basic problem of analysis is how to detect ERP activity within the often much larger ongoing EEG or background activity. According to the most widely accepted model, ERPs are signals generated by neural popu-lations that are time-locked to the stimulus; these signals would be summed to the ongoing EEG activity. According to another model, however, ERPs are assumed to result, at least partially, from a reorganisation of the ongoing activity (Sayers et al., 1974). More recently, a study demonstrated that ERPs could be generated by stimulus-induced phase resetting of ongoing EEG components (Makeig et al.,2004).
The ERP waveform can be quantitatively characterised across three main dimensions: amplitude, latency, and scalp distribution. In addition, an ERP signal may also be analysed with respect to the relative latencies between its subcomponents. The amplitude provides an index of the extent of neural activity (and how it responds functionally to experimental variables), the latency (i.e. the time point at which peak amplitude occurs) reveals the timing
1.3. ELECTROENCEPHALOGRAPHY 13 −100 0 100 200 300 400 500 600 700 Time (ms) −3 −2 −1 0 1 2 3 4 5 6 7 8 E vo ke d R e sp o n se ( μ V ) N100 P300 Frequent Rare
Figure 1.4: Timeseries of two auditory evoked responses corresponding to an oddball paradigm. Rare trials (blue) present distinct evoked responses when compared to frequent trials (red). This classic paradigm elicits a P300 wave. The two main components of the wave are a negative deflection 100 ms after the stimuli (N100) and a positivity 300ms after the stimuli (P300).
of this activation, and the scalp distribution provides the pattern of the voltage gradient of a component over the scalp at any time instant (Sanei and Chambers,2007).
The ERP signals are either positive, represented by the letter P, such as P300, or negative, represented by the letter N, such as N100 and N400 (see figure 1.4 for an example). The digits indicate the time in terms of milliseconds after the stimuli (audio, visual, or somatosensory). The amplitude and latency of the components occurring within 100 ms after stimulus onset are labelled oxogenous, and are influenced by physical attributes of stimuli such as intensity, modality, and presentation rate. On the other hand, endogenous components such as P300 are nonobligatory responses to stimuli, and vary in amplitude, latency, and scalp distribution with strategies, expectancies, and other mental activities triggered by the event eliciting the ERP. These components are not influenced by the physical attributes of the stimuli (Sanei and Chambers,2007).
The ERP parameters such as amplitude and latency are the indicators of the function of the brain neurochemical systems. ERPs are also related to the circumscribed cognitive process. For example, there are interesting correlations between late-evoked positivities and
memory, N400 and semantic processes, or the latencies of ERPs and the timing of cognitive processes. Therefore, the ERP parameters can be used as indicators of cognitive processes and dysfunctions not accessible to behavioural testing.
Nevertheless, there are overlapping components within ERPs, which represent specific stages of information processing, which are difficult to distinguish (Frodl-Bauch et al.,1999;
Dien et al., 2003). An example is the composite P300 wave, a positive ERP component, which occurs with a latency of about 300 ms after novel stimuli, or task-relevant stimuli, which requires an effortful response on the part of the individual under test (Frodl-Bauch et al.,1999;Dien et al.,2003;Kok et al.,2004;Friedman and Cycowicz,2001).
In the P300 wave (figure 1.4 on the preceding page), the elicited ERPs are comprised of two main components: the mismatch negativity (MMN) and the P300 complex. The MMN is the earliest ERP activity that indicates that the brain has detected a change in a background of brain homogeneous events, and it has been detected even when the stimuli are unattended or ignored. Because the MMN is evoked by stimuli that fall outside the focus of attention, it is considered to be a relatively automatic, pre-attentive response to stimulus deviance ( Fried-man and Cycowicz, 2001). The P300 complex represents cognitive functions involved in orientation of attention, contextual updating, response modulation, and response resolution (Dien et al.,2003;Kok et al.,2004), and consists mainly of two overlapping subcomponents P3a and P3b (Frodl-Bauch et al., 1999; Friedman and Cycowicz, 2001; Comerchero and Polich,1999). P3a reflects an automatic orientation of attention to novel or salient stimuli in-dependent of task relevance. Profrontal, frontal, and anterior temporal brain regions play the main role in generating P3a, giving it a frontocentral distribution (Friedman and Cycowicz,
2001). In contrast, P3b has a greater centroparietal distribution due to its reliance on poste-rior temporal, parietal, and posteposte-rior cingulate cortex mechanisms (Frodl-Bauch et al.,1999;
Dien et al., 2003). The P3b wave is though to reflect a higher-order violation of subject’s expectaions of a given rule, constructed over a longer time period than the MMN, and has been closely linked to working memory (Goldstein et al.,2002;Polich,2007) and conscious access (Dehaene et al.,2006;Dehaene and Changeux,2011).
According to the classic view, ERP analysis is based on two basic assumptions: (1) the electrical response evoked from the brain is invariably delayed relative to the stimulus and (2) the ongoing activity is a stationary noise, the samples of which may or may not be
corre-1.4. ELECTROENCEPHALOGRAPHY IN DOC PATIENTS 15 lated. Thus, ERP detection becomes a question of improving signal-to-noise ratio. A simple method to detect ERPs is to average across many repetitions (trials) with the main objective, of course, to increase the signal-to-noise ratio so that the EEG background activity is atten-uated (Niedermeyer and Silva, 2004). Nevertheless, quantifying ERPs can be difficulty for several reasons, including environmental artifacts and intra-subject variability. This problem of classification can be solved using multivariate statistical methods (Donchin, 1969) and multivariate pattern (MVP) analysisKing et al.(2013a).
1.4
Electroencephalography in DOC patients
Regarding EEG, we must differentiate between the ERP-based or active, passive and resting state methods used for the diagnosis of disorders of consciousness. The multidimensional construct of consciousness can be assessed through a variety of stimulation and recording paradigms, each one addressing particular aspects of consciousness across the spectrum of pathologies with disorders of consciousness.
For example, in case of comatose state, Brainstem Auditory Evoked Potentials (BAEPs), Middle Latency Auditory Evoked Potentials (MLAEPs), Somatosensory Evoked Potentials (SEPs) and Visual Evoked Potentials (VEP) are general indicators of prognosis The pres-ence of these potentials indicate preserved brainstem, sensory pathways and primary cortex function (Garcia-Larrea et al., 1992; Litscher, 1995). Nevertheless, these potentials are not related to cognition or high order function, hence they only indicate a bad prognosis with the absence of responses. Contrarily, cognitive ERPs are used to assess and predict higher order functions as language, attention and working memory.
The N400 (negative deflection 400 ms after the stimuli) ERP is found in healthy subjects when they see or hear semantically anomalous sentences like “The coffee is too hot to fly” versus “The coffee is too hot to drink” (Schoenle and Witzke, 2004), hence used a test to probe linguistic capabilities. When applied to DOC patients, the presence of an N400 due to semantic processing indicates preserved cognitive function and has only been detected in MCS patients (Rohaut et al.,2015).
Neural responses to motor imagery and spatial navigation tasks have proven to detect consciousness (Goldfine et al., 2011; Cruse et al., 2011, 2012) by asking subjects to
imag-ine movements or navigate spatially and analysing the oscillatory responses. However, the specificity and sensitivity of this marker is still under discussion (Goldfine et al.,2013).
Another classic ERP used in DOC is the MMN (mismatch negativity, see 1.3.2 on page 12). In comatose patients, these evoked potential elicited by novelty detection (oddball paradigms) has been reported as a highly specific (>90%) predictor of awakening (Kane et al.,1993; Fis-cher et al.,2004;Naccache et al.,2005). Highly associated with the novelty P300, and with several flavours ranging from auditory beeps (Naccache et al., 2005) to the subject’s own name (Fischer et al., 2010;Schnakers and Laureys, 2009), this ERPs has not proved to be always specific in regard to diagnosis of DOC in post-comatose states as MCS or VS/UWS: they have been detected in both MCS and VS/UWS patients (Faugeras et al.,2011;Naccache et al.,2005;Fischer et al.,2010).
The main reason for the specificity failure of the novelty P300 ERPs is that this particular complex represents several cognitive functions and consists of two overlapping subcompo-nents (P3a, P3b, see 1.3.2 on page 12). In 2009,Bekinschtein et al. 2009proposed a two-level hierarchical oddball paradigm designed to differentiate the MMN and P3b responses (for de-tails, see 1.5.2 on page 18). This new paradigm named Local-Global presented an effect when subjects were able to maintain conscious attention, thus implying capacity for conscious ac-cess. When applied to DOC patients, it was only detected in EMCS and MCS patients, with an exception of two VS/UWS patients that later recovered (Faugeras et al.,2012). Neverthe-less, the main caveat of this test is its low sensitivity: it was detected in 53.8% of the EMCS patients and only 14.3% of the MCS patients.
Interestingly, a recent work proposed a multidimensional cognitive evaluation of DOC patients using ERPs (Sergent et al., 2017). During a 1.5 hour session, patients were probed for own name recognition, temporal attention, spatial attention, detection of spatial incon-gruence, motor planning and modulation of these effects by global context, reflecting higher-level function. This proof-of-concept study revealed that the combination of several ERP markers increased diagnostic sensitivity, particularly in the detection of minimally conscious states with the presence of high-level effects.
So far, these ERPs are mainly elicited by auditory, somatosensory and in less frequency, visual stimuli. The main reason behind this unbalance is the difficulty to force patients to open their eyes and fixate in the case of visual stimuli. An alternative stimulation is the use
1.5. METHODS USED IN THIS THESIS 17 of Transcranial Magnetic Stimulation (TMS).
The Integrated Information Theory of consciousness (Tononi et al., 2016) states that, phenomenologically, each conscious experience is both differentiated (composed of several phenomenal distinctions that exist within it) and integrated (the distinctions are bound to-gether in various ways). These properties, from a neurophysiological point of view, rely on the ability of multiple, functionally specialised areas of the brain to interact rapidly to form an integrated whole (Dehaene and Changeux,2011;Friston,2002;Laureys,2005b;Tononi and Koch, 2008). In Information Theory, integration and differentiation is also defined as com-plexity. Under this premises, the spatio-temporal complexity of an EEG can act as a proxy to the combination of integration and segregation. Casali et al. 2013proposed a marker of brain complexity that quantifies the response to direct cortical stimulation using TMS and measured by EEG, named Perturbational Complexity Index (PCI). In a follow-up study on a cohort of 38 MCS and 43 VS/UWS patients, authors reported a sensitivity of 94.7% and a specificity of 80% (Casarotto et al.,2016).
In a recent review,Bai et al. 2017report several common aspects among various studies on resting state (or spontaneous) EEG recordings in DOC patients: spectrum power differ-ences in alpha, delta and theta bands between MCS and VS/UWS patients; ratios between higher and lower frequencies correlates with CRS-R scores; spectral entropy, markers of EEG complexity and functional connectivity differentiates patients groups.
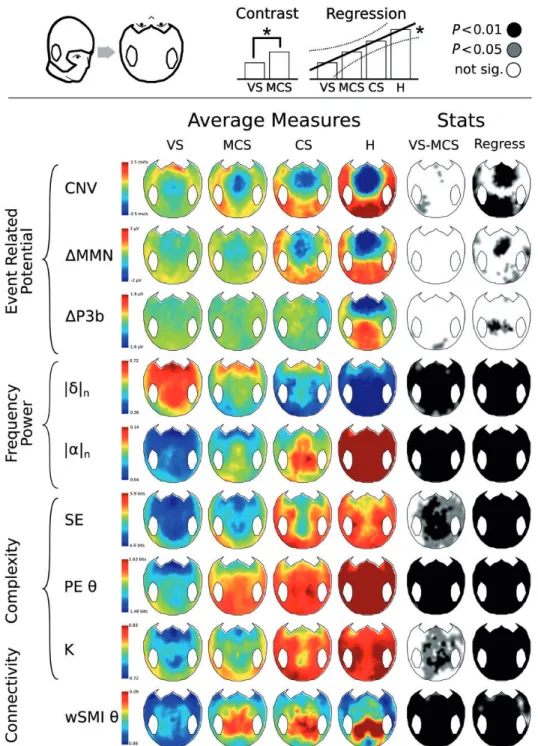
One particular work, analysed in this thesis, is the one presented bySitt et al. 2014which combines EEG-extracted markers from diverse theoretical frameworks and uses machine learning to predict the diagnosis of individual patients. In particular, they analyse dozens of markers including ERPs from the Local-Global paradigm and markers of information, com-plexity, connectivity and spectral power, obtaining an AUC of 78% when used to diagnose a cohort of 68 MCS and 75 VS/UWS patients.
1.5
Methods used in this thesis
1.5.1
The Coma Recovery Scale (Revised)
The current gold standard for the behavioural diagnosis of DOC patients is the Coma Recov-ery Scale - Revised (CRS-R). This scale, initially described inGiacino et al. 1991and later
revised inGiacino et al. 2004 was developed to characterise and monitor patients, detect-ing subtle but potentially meandetect-ingful changes in neurobehavioural function, while ensurdetect-ing proper interrater reliability.
The CRS-R consists of 26 hierarchically arranged items that comprise 6 subscales ad-dressing auditory, visual, motor, oromotor, communication, and arousal processes. Scoring is based on the presence or absence of specific behavioural responses to sensory stimuli ad-ministered in a standardised manner. The lowest item on each subscale represents reflexive activity, whereas the highest items represent cognitively mediated behaviours. Depending on the different scores in the subscales, the CRS-R will diagnose the patient as VS/UWS, MCS or EMCS.
1.5.2
The Local-Global paradigm
As described previously in 1.4 on page 15, the MMN and P3b events are close in time and extremely difficult to differentiate in individual subjects. For that purpose,Bekinschtein et al. 2009propose a new paradigm named Local-Global which adds a second level of novelties to a classic oddball paradigm. A first level of regularities is defined at a local (or within trial) level, while the second level is defined at a global (or across trial) level. While disrup-tions of the local level regularities elicits the MMN and P3a ERPs, disrupdisrup-tions of the global regularities elicits a P3b ERP.
Each trial of the paradigm is formed by 5 consecutive sounds lasting 50 ms, with a 150-millisecond gap between the sounds’ onsets and an intertrial interval ranging from 1,350 to 1,650 milliseconds. The fifth sound can be either equal to or different from the first four; this defines whether the trial is standard or deviant at the local level. The second level of regularities is defined across trials (or at a global level); frequent trials (80%) define the regularity, and rare ones (20%) violate this regularity.
Two types of stimulation blocks are played to the subjects; in the XX blocks, the frequent stimulus corresponds to five equal sounds (local standard and global standard [LSGS]). In contrast, the infrequent stimulus corresponds to four equal sounds followed by a fifth different sound (local deviant and global deviant [LDGD]). In the XY blocks, the frequent stimulus corresponds to four equal sounds and a fifth different sound (local deviant and global standard [LDGS]). The infrequent stimulus corresponds to 5 equal sounds (local standard and global
1.5. METHODS USED IN THIS THESIS 19
...
Regularity
...
Local Deviant
Global Standard Local StandardGlobal Deviant Local Standard
Global Standard Global DeviantLocal Deviant Block XX
Block XY
Local-Global paradigm
Figure 1.5: Illustration of the Local-Global paradigm. Each trial of the auditory paradigm was composed by 5 consecutive sounds. Four equal sounds define a local regularity (music notes). The fifth sound could be equal or different, defining a local standard or deviant trial, respectively. At a second level, frequent trials (80%, green shaded area) defined a global regularity and rare trials (20%, red shaded area) violated this regularity.
deviant [LSGD]). For more details see figure 1.5.
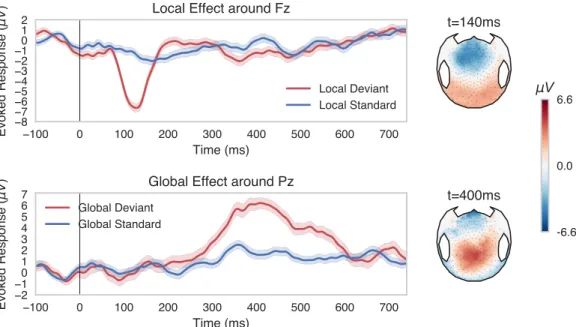
The local effect is quantified by contrasting all local deviant (LD) trials (LDGS+LDGD) versus all local standard (LS) trials (LSGS+LSGD). The global effect is quantified by con-trasting all global deviant (GD) trials (LSGD+LDGD) versus all global standard (GS) trials (LSGS+LDGS). All subjects were presented with these four conditions, twice for each block type. Each block started with 20–30 global standard trials to establish the global regularity before the occurrence of the first global deviant trial. An example of the neural response to the Local-Global paradigm is shown in 1.6 on the next page.
Subjects were instructed to count the GD trials and asked after each stimulation block ( 3.5 minutes). For patients, if they appeared asleep, they were stimulated with pressure as recommended in the arousal facilitation protocol in the CRS-R.
1.5.3
Machine Learning
According toMitchell 1997, “the field of machine learning is concerned with the question on how to construct computer programs that automatically improve with experience”. Through-out this thesis, we will focus on a specific type of learning named supervised learning, that is, algorithms that could learn from examples provided by a supervisor. In this case, the algo-rithm is first presented with a set of samples and its corresponding labels (training set). Once the algorithm has learnt from the examples, one can feed it with an independent set of sam-ples (test set) and ask the algorithm to classify the samsam-ples based on the knowledge obtained from the training set. The performance of the algorithm can be assessed by comparing the
t=140ms t=400ms -6.6 0.0 6.6 μV −100 0 100 200 300 400 500 600 700 Time (ms) −8 −7 −6 −5 −4 −3 −2 −10 1 2 E vo ke d R e sp o n se ( μ V
) Local Effect around Fz
Local Deviant Local Standard −100 0 100 200 300 400 500 600 700 Time (ms) −2 −10 1 2 3 4 5 6 7 E vo ke d R e sp o n se ( μ V
) Global Effect around Pz
Global Deviant Global Standard
Figure 1.6: Local and Global effects as measured with EEG in one of the directors of this thesis. Timeseries of the Local Effect around the Fz electrode (top left) present the MMN around 140 ms after the onset of the 5th sound only when it is different from the first four. The associated scalp map (top right) shows a frontal/central negativity and a posterior positivity. Timeseris of the Global Effect around the Pz electrode (bottom left) depict the P3b component starting around 350ms after the onset of the 5th sound. The associated scalp map (bottom right) presents a central/posterior positivity.
1.5. METHODS USED IN THIS THESIS 21 labels provided by the algorithm and the ones provided by the supervisor. An good algorithm is the one who provides accurate labels within some reasonable error.
A classification algorithm can be univariate or multivariate. In the first case, a single vari-able or feature is provided for each sample. Multivariate Pattern Analysis (MVPA) classifiers refers to classification algorithms that uses more than one feature for each sample. Depend-ing on the algorithm and the number of features, some of them could be discarded to reduce dimensionality. This is called feature selection.
Cross Validation
In order to test the real performance of a classification algorithm, one must provide two sets of representative data from the underlying real population distribution. For the train set, it should be big enough so the algorithm learns generalizable rules and not particular and specific to the available samples. For the test set, its size will have a direct impact on the variance of the estimated performance.
A common problem we face when evaluating models in neuroimaging and clinical ap-plications is that the number of available samples is severely limited. For example, data from DOC patients in the Pitié-Salpêtrière hospital in Paris is acquired weekly: 52 samples a year in the best case scenario. To address this issue, a widely used validation technique is to partition the available data into independent sets and use them for training and testing the algorithm. In order to reduce variability, this action can be repeated with different par-titions. This method is called cross-validation and there are several partitioning schemes. We here focus on two particular methods: Stratified Shuffle Split (also called Monte Carlo cross-validation) and Stratified K-Fold.
The Stratified Shuffle Split method consists on randomly shuffling the data and splitting the data into two partitions for training and testing the algorithm. The sizes of the partition are determined by the user, but both of them respects the label distributions of the original set. This action is repeated several times and the performance is estimated across the repetitions. A disadvantage of this methods is that there is no guarantee that a sample will be used for the validation set, and that validation sets overlap.
In the Stratified K-fold cross validation, samples are split into K different groups (folds) that respects the original label distributions. The algorithm is then trained on K − 1 folds and
tested on the remaining one. This action is repeated K times with a different testing fold. An advantage of this method is that it guarantees that each samples is used for validation exactly once.
Area under the ROC curve (ROC-AUC)
Univariate and multivariate discrimination performance was summarised with Area Under the Curve (AUC) calculated from the receiver operator characteristic (ROC). For a binary clas-sification system, the ROC pits the detection probability, commonly referred to as sensitivity against the probability of false alarm (1 - sensitivity). These probabilities are empirically estimated by moving the decision cut-off along the sorted values of a continuous variable, e.g. a score, and evaluating its relation to the true label. In the case of traditional model-free univariate analysis, the score is the EEG-marker itself, in the case of univariate or multivari-ate machine learning it is the predicted probability of a given sample to belong to the target class. The AUC can then be conveniently used to summarise the performance, where a score of 0.5 is uninformative and equals to random guessing whereas a score of 1 amounts to per-fect classification and 0 to total confusion, indicating negative correlation between the score and the label.
1.5.4
Statistics
Statistical analysis encompassed correlations using Pearson product–moment correlation co-efficient (r) and Spearman rank correlation coco-efficient (rho) with corresponding probability values. Pearson chi-square and Wilcoxon rank sum test were used to test for independence between the diagnosis and the demographic information of the patients. Bayesian ANOVA was performed to test the differences between groups using the BayesFactor R package (JZS Bayes factor with “medium” default prior setting r = 0.5;Rouder et al. 2012;Morey et al. 2014; R Development Core Team 2016. Bayes factor (BF) interpretation was done accord-ing to the Kass & Raftery scale (Kass and Raftery,1995). Differences between groups were also tested using 2-sided paired samples signed tests. Different between conditions at single subjects and group level were tested using paired t-tests. Performance of MVPA models was assessed using the Area Under the Curve (AUC). MVPA models were tested using nonpara-metric Kruskal–Wallis test adjusted for multiple comparisons. We extended our visualisations
1.6. THIS WORK 23 into hypothesis tests by employing the percentile bootstrap (Efron and Tibshirani,1994). Ac-cordingly, we generated 2000 bootstrap samples by drawing with uniform probability and replacement n samples from the dataset. The test-statistic of interest was then evaluated on each bootstrap sample. Two-sided 95% confidence intervals were obtained by querying the 2.5 and 97.5 percentiles and the significance-level was then obtained by inversion of the con-fidence interval that excluded the value under H0.
1.6
This work
1.6.1
Purpose
The purpose of this thesis is to analyse the current EEG-based tools used to diagnose disorders of consciousness with two major objectives: (1) validate and standardise the usage of state-of-the-art tools based on machine learning methods and (2) analyse and propose novel tests in order to increase the sensitivity of the current tool and improve the diagnostic accuracy.
1.6.2
Description of chapters
Chapter 2: Automation and identification of robust EEG-extracted markers for the diagnosis of DOC. As a first step, we analyse the validity and clinical usage of a previous publication which combines EEG-extracted markers and a Support Vector Machine classifier to diagnose DOC patients. In order to develop an online clinical tool, we automate the process and analyse the application across different clinical setups.
Chapter 3: Towards cross-modal integration as a measure of consciousness. Previous works on diagnosis of DOC using auditory ERP analyses show high specificity but low sen-sitivity. Past research on multimodal stimulation suggest the existence of a variety of neural responses that can be measured using EEG. In this chapter, we analyse the possibility of using the neural responses to multimodal stimulation and cross-modal integration for the diagnosis of DOC.
Chapter 4: Brain-Body interactions as a diagnostic marker for DOC. So far, all the assisting technologies used to diagnose DOC patients are based on a strict neuro-centric approach. Nevertheless, past research on healthy subjects demonstrate interactions between the body and the brain, which are also affected by cognitive processes. In this chapter, we shift away from this neuro-centric approach and analyse the possibility of evaluating DOC patients via the embodied paradigm, according to which body-brain functions contribute to a holistic approach to conscious processing.
Chapter 5: Summary and final remarks. In this chapter, we summarise the findings and discuss future lines of research.
Chapter 2
Automation and identification of robust
EEG-extracted markers for the diagnosis
of DOC
Parts of the work described in this chapter has been accepted for publication as “Robust EEG-based cross-site and cross-protocol classification of states of consciousness”. Raimondo F.*, Engemann DA.*, King JR., Rohaut B., Louppe G., Faugeras F,. Annen J,. Cassol H., Gosseries O., Fernandez Slezak D., Laureys S., Naccache L., Dehaene S., Sitt JD. Brain, to be published in Volume 141, Issue 11, November 2018.
Additionally, this work was the basis for a case report published as “Probing consciousness in a sensory-disconnected paralysed patient”. Rohaut B., Raimondo F., Galanaud D., Valente M,. Sitt JD., Naccache L. Brain Injury, Volume 31, Issue 8, Pages 1-6. 2017.
Contents
2.1 Background . . . 26 2.2 Objectives . . . 27 2.3 Automation . . . 27 2.3.1 Reasons to rewrite the code and automate the process . . . 27 2.3.2 Software Implementation . . . 28 2.3.3 Preprocessing . . . 28 2.3.4 Optimisations and Performance . . . 29 2.4 Replication . . . 30 2.4.1 Methods . . . 30 2.4.2 Results . . . 35
2.5 Validation . . . 36 2.5.1 Methods . . . 36 2.5.2 Results . . . 36 2.6 Clinical application . . . 38 2.6.1 Report . . . 38 2.7 Further steps: towards a universal tool . . . 39 2.7.1 Generalisation to difference EEG recording configurations . . . 40 2.7.2 Generalisation to Resting State . . . 43 2.7.3 Discussion . . . 45 2.8 Insights from Machine Learning . . . 47 2.8.1 Methods . . . 47 2.8.2 Results . . . 48 2.8.3 Discussion . . . 48 2.9 Summary . . . 50
2.1
Background
Over the last decade, several electrophysiological signatures of consciousness has been pro-posed, varying from simple quantifications of ERPs or oscillations, to complex topological summaries of connectivity. This chapter is based on one of the key studies in EEG-based DOC diagnosis (Sitt et al.,2014). This work analysed dozens of EEG-markers obtained from more than 150 EEG recordings of the Local-Global paradigm. The authors demonstrated that by using a Support Vector Machine (SVM) classifier combining several EEG-markers, the diagnostic precision was higher than any of the individual markers. Furthermore, when the clinical (behavioural) diagnosed VS/UWS patients where classified by the SVM as MCS pa-tients, the proportion of those who later showed signs of consciousness significantly increased (Sitt et al.,2014).
The main result, a gain in diagnostic precision by combining several EEG measures, has both theoretical and clinical implications. Theoretically, the results indicate that the mark-ers addresses distinct and dissociable features of conscious states. Clinically, they depict the usefulness of combining EEG measures for the diagnosis. Particularly, the increase in the
2.2. OBJECTIVES 27 probability of recovery of those clinically VS patients classified as MCS using the EEG mark-ers, indicates that this approach is discovering information that could escape highly trained clinicians. Taken together, these results provide the basis for a reliable bedside tool to probe consciousness in DOC patients.
2.2
Objectives
In this chapter, we will focus on the follow-up analysis after the work published inSitt et al. 2014. The purpose of this work has both clinical and scientific objectives:
1. Evaluate the use of the previously developed model for the diagnosis of DOC in a clinical environment.
2. Provide a semi-supervised algorithm to obtain the results, in which there is no need for human intervention.
3. Analyse the implications of modifying data acquisition conditions in order to assess the use of the developed tool across clinical centres with heterogeneous EEG systems and acquisition protocols.
4. Obtain insight from the classification model and determine which are the markers that drives the distinction between VS/UWS and MCS patients.
2.3
Automation
2.3.1
Reasons to rewrite the code and automate the process
The development of a clinical tool that goes beyond research requires a high grade of attention to the software development processes. For example, a defect in a news website or word processor application could result on the inability to perform a certain task, the loss of data or a security breach. Nevertheless, the magnitude of this events do not directly compare to a defect in a software that predicts the diagnosis of a patient. The clinicians might take end-of-life decisions upon the wrong results due to an error in the software. It is of uttermost importance to ensure a high quality software through the development process.
Particularly in data handling for machine learning applications, it is crucial that the fea-tures are well defined and obtained in an objective manner, with no prior knowledge of the output to be predicted. When it comes to EEG, one of the first steps is to identify non-neural signals or artifacts. In addition to the neuronal activity, EEG captures the electrical activity of muscles, cardiac activity, movements and environmental noise. A common procedure is to visually inspect the recording and discard the portions of data that are contaminated by any of this artifacts. This procedure is prune to be subjective, hence a potential problem is a bias in the extracted features.
To address these potentials problems, the proposed solution is to create a high quality software which extracts the features in a fully unsupervised manner.
2.3.2
Software Implementation
The software was written in Python and C, using open-source libraries. All the EEG-measures described inSitt et al.(2014) were re-implemented taking advantage of the already optimised Numpy and Scipy libraries for fast algebra and scientific computing (Jones et al.,2001). For general data processing and visualisation, we used the open source MNE software package (Gramfort et al.,2013,2014). Machine learning was performed using the scikit-learn library (Pedregosa et al.,2012). Bash scripts and GNU-parallel (Tange,2011) were used to distribute processes and obtain results in a faster way.
2.3.3
Preprocessing
The first procedure after data acquisition, and before the computation of ERPs and EEG-extracted markers is called preprocessing. The objective of the preprocessing step is straight-forward: convert raw and contaminated data into artifact-free data ready to analyse. Depend-ing on the analysis to be done, the steps and tools used in preprocessDepend-ing can vary.
Data was first filtered using a 0.5 Hz high-pass 6thorder and a 45 Hz low-pass 8th order FFT-based Butterworth filters. The second step consisted on epoching (separate in trials) from -200ms to 1336ms relative the onset of the first sound of the Local-Global paradigm.
We then used an adaptive outlier detection algorithm specifically developed to detect and reject contaminated electrodes and epochs. This adaptive algorithm first selects bad
2.3. AUTOMATION 29 electrodes where more than 50 % of the epochs present a peak-to-peak amplitude higher than 100 µV . The second step consists on computing the variance of each individual channel and its corresponding z-score across all channels. Channels with a z-score greater than 4 are discarded. This operation is repeated 4 times. The remaining data is then analysed at the epoch level: epochs with more than 10% of the channels outside the 100 µV peak-to-peak amplitude range are then discarded. Finally, the second step is repeated, but with the standard deviation of the channels filtered with a 4thorder Butterworh high-pass filter at 25 Hz.
In order to use the same set of electrodes for every patients, electrodes marked as “bad” by the outlier algorithm are interpolated using a spherical spline interpolation. Data was finally re-referenced using an average reference and baseline corrected over the first 200 ms window preceding the onset of the first sound.
The development of the peak-to-peak amplitude rejection algorithm led to the develop-ment of an automated algorithm for rejection and repair of bad trials in EEG and MEG sig-nals. This algorithm estimates the individual peak-to-peak threshold for each channel, rather than M/EEG system-dependent user set threshold (Jas et al., 2016). The presented method capitalises on cross-validation in conjunction with a robust evaluation metric to estimate the optimal peak-to-peak threshold, extended to a more sophisticated algorithm which estimates this threshold for each sensor yielding trial-wise bad sensors. Depending on the number of bad sensors, the trial is then repaired by interpolation or excluded from subsequent analysis.
2.3.4
Optimisations and Performance
Among the EEG-extracted measures used, three of them needed a reimplementation in Python: Permutation Entropy (PE;Bandt and Pompe 2002), Weighted Symbolic Mutual Information (wSMI;King et al. 2013b) and Kolmogorov-Chaitin complexity (K;Sitt et al. 2014).
Due to the complexity of the algorithms, optimisations were done in C using OpenMP for multithreading, with its corresponding Python bindings. This allowed to perform the computation of all the markers for a single subject in about 30 minutes in a 16 Gb RAM Intel Core i7 type workstation.
These benchmarks are particularly relevant for the practical purpose of the system. The current implementation facilitates the computation of reference models that are estimated on EEG-measures from hundreds of clinical recordings to predict unseen patients. This not